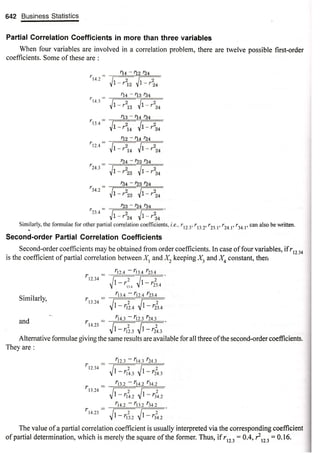
Partial and multiple correlation and regression
22 likes16,671 views
Partial and multiple correlation and regression
1 of 20
Downloaded 226 times


Ad
Recommended
The indian patent act 1970
The indian patent act 1970ANANT NAG Under the Indian patent law, a patent can be obtained only for an invention that is new and useful. The invention must relate to the machine, article, or substance produced by a manufacturer, or the process of manufacture of an article.
introduction to research-2023.ppt
introduction to research-2023.pptDoctorOkelloBen This document provides an introduction and overview of research methods. It outlines the aim and objectives of the course which are to give participants an appreciation of the research process and enable them to describe research, prepare proposals, design instruments, collect and analyze data, and write reports. It defines research and describes the importance of research being systematic, logical, empirical, and replicable. It also discusses the different types of research including basic research, applied research, and evaluation research. The document outlines the overall research process and covers topics such as identifying research areas, the qualities of a good topic, research philosophies including epistemology and axiology, and the different methodologies of quantitative and qualitative research.
Sexual Harassment of Students & Women in Colleges and Universities 
Sexual Harassment of Students & Women in Colleges and Universities Urwi Keche University Grants Commission (Prevention, Prohibition and Redressal of Sexual Harassment of Women Employees and Students in Higher Institutions) Regulation, 2015
Correlation Analysis
Correlation AnalysisBirinder Singh Gulati This document discusses correlation and different types of correlation analysis. It defines correlation as a statistical analysis that measures the relationship between two variables. There are three main types of correlation: (1) simple and multiple correlation based on the number of variables, (2) linear and non-linear correlation based on the relationship between variables, and (3) positive and negative correlation based on the direction of change between variables. The degree of correlation is measured using correlation coefficients that range from -1 to +1. Common methods to study correlation include scatter diagrams and Karl Pearson's coefficient of correlation.
Multiple Correlation - Thiyagu
Multiple Correlation - ThiyaguThiyagu K Multiple Correlation Coefficient denoting a correlation of one variable with multiple other variables. The Multiple Correlation Coefficient, R, is a measure of the strength of the association between the independent (explanatory) variables and the one dependent (prediction) variable. This presentation explains the concept of multiple correlation and its computation process.
Maths Pi
Maths PiPuru Agarwal - William Jones is credited with first using the symbol π in 1706 to represent the ratio of a circle's circumference to its diameter, which had previously been undefined.
- Archimedes was one of the first to calculate an approximation of pi, determining that 223/71 < π < 22/7.
- Pi Day is celebrated on March 14th in recognition of the first three digits of pi in decimal form - 3.14. Some also celebrate Pi Approximation Day on July 22nd due to the common approximation of 22/7.
Trigonometry project
Trigonometry projectKajal Soni Trigonometry is the branch of mathematics dealing with triangles and trigonometric functions of angles. It is derived from Greek words meaning "three angles" and "measure". Trigonometry specifically studies relationships between sides and angles of triangles, and calculations based on trigonometric functions like sine, cosine, and tangent. Trigonometry has many applications in fields like astronomy, navigation, architecture, engineering, and more.
Correlation and Regression
Correlation and RegressionRam Kumar Shah "Struggler" It is most useful for the students of BBA for the subject of "Data Analysis and Modeling"/
It has covered the content of chapter- Data regression Model
Visit for more on www.ramkumarshah.com.np/
Partial Correlation, Multiple Correlation And Multiple Regression Analysis
Partial Correlation, Multiple Correlation And Multiple Regression AnalysisSundar B N This document discusses correlation and regression analysis. It defines partial correlation as assessing the relationship between two variables while controlling for the effect of a third variable. Multiple correlation is defined as measuring the strength of the relationship between a single dependent variable and two or more independent variables. Formulas are provided for partial correlation coefficients measuring the correlation between different pairs of variables while controlling for others. Multiple correlation coefficients are also defined as measuring the correlation between a dependent variable and the combination of multiple independent variables.
Correlation and partial correlation
Correlation and partial correlationUdaybhaskar Mogallapu This document discusses correlation analysis and different types of correlation. It defines correlation as the degree of inter-relatedness between two or more variables. Correlation can be positive, negative, simple, partial or multiple depending on the direction and number of variables analyzed. Linear and non-linear correlation are determined based on whether the relationship between variables is constant or not. The document provides examples of calculating correlation coefficients in Excel and SPSS and computing partial correlation coefficients controlling for other variables.
What is a partial correlation?
What is a partial correlation?Ken Plummer Partial correlation estimates the relationship between two variables while removing the influence of a third variable. It is a way to determine the correlation between two variables when controlling for a third. For example, a researcher may want to know the correlation between height and weight but also wants to control for gender, which can influence bone and muscle structure. Using the data sample provided, the correlation between height and weight was 0.825 but decreased to 0.770 when controlling for gender, showing gender partially explains the relationship between height and weight.
Correlation analysis
Correlation analysisShivani Sharma This document discusses correlation analysis and its various types. Correlation is the degree of relationship between two or more variables. There are three stages to solve correlation problems: determining the relationship, measuring significance, and establishing causation. Correlation can be positive, negative, simple, partial, or multiple depending on the direction and number of variables. It is used to understand relationships, reduce uncertainty in predictions, and present average relationships. Conditions like probable error and coefficient of determination help interpret correlation values.
Correlation and Regression 
Correlation and Regression Dr. Tushar J Bhatt This presentation covered the following topics:
1. Definition of Correlation and Regression
2. Meaning of Correlation and Regression
3. Types of Correlation and Regression
4. Karl Pearson's methods of correlation
5. Bivariate Grouped data method
6. Spearman's Rank correlation Method
7. Scattered diagram method
8. Interpretation of correlation coefficient
9. Lines of Regression
10. regression Equations
11. Difference between correlation and regression
12. Related examples
Karl pearson's coefficient of correlation
Karl pearson's coefficient of correlationteenathankachen1993 This document discusses Karl Pearson's coefficient of correlation and how it is used to measure the relationship between two variables. It defines positive, negative, and zero correlation, and explains that Pearson's correlation coefficient (represented by r) varies from -1 to 1, where -1 is total negative correlation, 0 is no correlation, and 1 is total positive correlation. The document also provides an example of calculating r using product-moment method for a set of test score data, and interprets the resulting correlation value.
Mpc 006 - 02-03 partial and multiple correlation
Mpc 006 - 02-03 partial and multiple correlationVasant Kothari 3.2 Partial Correlation (rp)
3.2.1 Formula and Example
3.2.2 Alternative Use of Partial Correlation
3.3 Linear Regression
3.4 Part Correlation (Semipartial correlation) rsp
3.4.1 Semipartial Correlation: Alternative Understanding
3.5 Multiple Correlation Coefficient (R)
The Binomial, Poisson, and Normal Distributions
The Binomial, Poisson, and Normal DistributionsSCE.Surat The document summarizes key concepts relating to three probability distributions:
1) The normal distribution describes variables that arise from the addition of small random effects and approximates the binomial distribution for large numbers of trials. It is used to model natural phenomena influenced by many independent factors.
2) The binomial distribution describes discrete random variables resulting from Bernoulli trials with a fixed probability of success. It gives the probability of a given number of successes in fixed number of trials.
3) The Poisson distribution approximates the binomial when the probability of success is very small but the number of trials is large. It is used to model rare random events occurring independently over an interval of time or space.
Chi -square test
Chi -square testVIVEK KUMAR SINGH The chi-square test is used to compare observed data with expected data. It was developed by Karl Pearson in 1900. The chi-square test calculates the sum of the squares of the differences between the observed and expected frequencies divided by the expected frequency. The chi-square value is then compared to a critical value to determine if there is a significant difference between the observed and expected results. The degrees of freedom, which determine the critical value, are calculated based on the number of rows and columns in a contingency table. The chi-square test can be used to test goodness of fit, independence of attributes, and other hypotheses.
Karl pearson's correlation
Karl pearson's correlationfairoos1 this ppt gives you adequate information about Karl Pearsonscoefficient correlation and its calculation. its the widely used to calculate a relationship between two variables. The correlation shows a specific value of the degree of a linear relationship between the X and Y variables. it is also called as The Karl Pearson‘s product-moment correlation coefficient. the value of r is alwys lies between -1 to +1. + 0.1 shows Lower degree of +ve correlation, +0.8 shows Higher degree of +ve correlation.-0.1 shows Lower degree of -ve correlation. -0.8 shows Higher degree of -ve correlation.
Correlation and Regression
Correlation and RegressionSir Parashurambhau College, Pune 1. Correlation analysis measures the strength and direction of the linear relationship between two variables. It ranges from -1 to 1, where -1 is a perfect negative correlation, 0 is no correlation, and 1 is a perfect positive correlation.
2. Scatter diagrams provide a visual representation of the relationship between two variables but do not provide a precise measure of correlation. Pearson's correlation coefficient (r) calculates the numerical strength of the linear relationship.
3. Correlation is widely used in fields like agriculture, genetics, and physiology to study relationships between variables like crop yield and fertilizer use, gene linkage, and organism growth and environmental factors.
Simple linear regression
Simple linear regressionRekhaChoudhary24 This document provides an introduction to basic statistics and regression analysis. It defines regression as relating to or predicting one variable based on another. Regression analysis is useful for economics and business. The document outlines the objectives of understanding simple linear regression, regression coefficients, and merits and demerits of regression analysis. It describes types of regression including simple and multiple regression. Key concepts explained in more detail include regression lines, regression equations, regression coefficients, and the difference between correlation and regression. Examples are provided to demonstrate calculating regression equations using different methods.
Anova ppt
Anova pptSravani Ganti This document provides an overview of analysis of variance (ANOVA). It describes how ANOVA was developed by R.A. Fisher in 1920 to analyze differences between multiple sample means. The document outlines the F-statistic used in ANOVA to compare between-group and within-group variations. It also describes one-way and two-way classifications of ANOVA and provides examples of applications in fields like agriculture, biology, and pharmaceutical research.
Measures of dispersion
Measures of dispersionSachin Shekde This document provides an overview of measures of dispersion, including range, quartile deviation, mean deviation, standard deviation, and variance. It defines dispersion as a measure of how scattered data values are around a central value like the mean. Different measures of dispersion are described and formulas are provided. The standard deviation is identified as the most useful measure as it considers all data values and is not overly influenced by outliers. Examples are included to demonstrate calculating measures of dispersion.
Regression ppt
Regression pptShraddha Tiwari Regression analysis is a statistical technique for investigating relationships between variables. Simple linear regression defines a relationship between two variables (X and Y) using a best-fit straight line. Multiple regression extends this to model relationships between a dependent variable Y and multiple independent variables (X1, X2, etc.). Regression coefficients are estimated to define the regression equation, and R-squared and the standard error can be used to assess the goodness of fit of the regression model to the data. Regression analysis has applications in pharmaceutical experimentation such as analyzing standard curves for drug analysis.
Correlation and regression
Correlation and regressionHuma Ansari Meaning
Types
Objectives
Methods
Difference
For classification the output(s) is nominal
In regression the output is continuous
Correlation and regression
Correlation and regressionMOHIT PANCHAL The document discusses correlation and regression analysis. It defines correlation as the statistical relationship between two variables, where a change in one variable corresponds to a change in the other. The key types of correlation are positive, negative, simple, partial and multiple, and linear and non-linear. Regression analysis establishes the average relationship between an independent and dependent variable in order to predict or estimate values of the dependent variable based on the independent variable. Methods for studying correlation include scatter diagrams and Karl Pearson's coefficient of correlation, while regression analysis uses equations to model the linear relationship between variables.
Discriminant analysis
Discriminant analysisAmritashish Bagchi This document discusses discriminant analysis, which is a statistical technique used to classify observations into predefined groups based on independent variables. It can be used to predict the likelihood an entity belongs to a particular class. The document outlines the objectives, purposes, assumptions, and steps of discriminant analysis. It provides examples of using it to classify individuals as basketball vs volleyball players or high vs low performers based on variables.
Correlation
CorrelationAnish Maman Correlation and regression analysis are statistical tools used to analyze relationships between variables. Correlation measures the strength and direction of association between two variables on a scale from -1 to 1. Regression analysis uses one variable to predict the value of another variable and draws a best-fit line to represent their relationship. There are always two lines of regression - one showing the regression of x on y and the other showing the regression of y on x. Regression coefficients from these lines indicate the slope and intercept of the lines and can help estimate unknown variable values based on known values.
Partial correlation
Partial correlationDwaitiRoy This document is a presentation by Dwaiti Roy on partial correlation. It begins with an acknowledgement section thanking various professors and resources that helped in preparing the presentation. It then provides definitions and explanations of key concepts related to partial correlation such as correlation, assumptions of correlation, coefficient of correlation, coefficient of determination, variates, partial correlation, assumptions and hypothesis of partial correlation, order and formula of partial correlation. Examples are provided to illustrate partial correlation. The document concludes with references and suggestions for further reading.
Statistics report THE RANGE
Statistics report THE RANGECharliez Jane Soriano The range is the simplest measure of variability, defined as the difference between the highest and lowest values in a data set. It is quick to calculate but does not provide a full picture of the data distribution and can be strongly influenced by outliers. Other measures of variability include the average deviation, which calculates the average amount each score deviates from the mean, and the interquartile range, which is less influenced by outliers than the range. The interquartile range only considers data between the first and third quartiles and ignores half the data points.
Percentile
PercentileDMCI The remaining documents provide more information and examples about percentiles, percentile rank, and how to calculate them based
Ad
More Related Content
What's hot (20)
Partial Correlation, Multiple Correlation And Multiple Regression Analysis
Partial Correlation, Multiple Correlation And Multiple Regression AnalysisSundar B N This document discusses correlation and regression analysis. It defines partial correlation as assessing the relationship between two variables while controlling for the effect of a third variable. Multiple correlation is defined as measuring the strength of the relationship between a single dependent variable and two or more independent variables. Formulas are provided for partial correlation coefficients measuring the correlation between different pairs of variables while controlling for others. Multiple correlation coefficients are also defined as measuring the correlation between a dependent variable and the combination of multiple independent variables.
Correlation and partial correlation
Correlation and partial correlationUdaybhaskar Mogallapu This document discusses correlation analysis and different types of correlation. It defines correlation as the degree of inter-relatedness between two or more variables. Correlation can be positive, negative, simple, partial or multiple depending on the direction and number of variables analyzed. Linear and non-linear correlation are determined based on whether the relationship between variables is constant or not. The document provides examples of calculating correlation coefficients in Excel and SPSS and computing partial correlation coefficients controlling for other variables.
What is a partial correlation?
What is a partial correlation?Ken Plummer Partial correlation estimates the relationship between two variables while removing the influence of a third variable. It is a way to determine the correlation between two variables when controlling for a third. For example, a researcher may want to know the correlation between height and weight but also wants to control for gender, which can influence bone and muscle structure. Using the data sample provided, the correlation between height and weight was 0.825 but decreased to 0.770 when controlling for gender, showing gender partially explains the relationship between height and weight.
Correlation analysis
Correlation analysisShivani Sharma This document discusses correlation analysis and its various types. Correlation is the degree of relationship between two or more variables. There are three stages to solve correlation problems: determining the relationship, measuring significance, and establishing causation. Correlation can be positive, negative, simple, partial, or multiple depending on the direction and number of variables. It is used to understand relationships, reduce uncertainty in predictions, and present average relationships. Conditions like probable error and coefficient of determination help interpret correlation values.
Correlation and Regression
Correlation and Regression Dr. Tushar J Bhatt This presentation covered the following topics:
1. Definition of Correlation and Regression
2. Meaning of Correlation and Regression
3. Types of Correlation and Regression
4. Karl Pearson's methods of correlation
5. Bivariate Grouped data method
6. Spearman's Rank correlation Method
7. Scattered diagram method
8. Interpretation of correlation coefficient
9. Lines of Regression
10. regression Equations
11. Difference between correlation and regression
12. Related examples
Karl pearson's coefficient of correlation
Karl pearson's coefficient of correlationteenathankachen1993 This document discusses Karl Pearson's coefficient of correlation and how it is used to measure the relationship between two variables. It defines positive, negative, and zero correlation, and explains that Pearson's correlation coefficient (represented by r) varies from -1 to 1, where -1 is total negative correlation, 0 is no correlation, and 1 is total positive correlation. The document also provides an example of calculating r using product-moment method for a set of test score data, and interprets the resulting correlation value.
Mpc 006 - 02-03 partial and multiple correlation
Mpc 006 - 02-03 partial and multiple correlationVasant Kothari 3.2 Partial Correlation (rp)
3.2.1 Formula and Example
3.2.2 Alternative Use of Partial Correlation
3.3 Linear Regression
3.4 Part Correlation (Semipartial correlation) rsp
3.4.1 Semipartial Correlation: Alternative Understanding
3.5 Multiple Correlation Coefficient (R)
The Binomial, Poisson, and Normal Distributions
The Binomial, Poisson, and Normal DistributionsSCE.Surat The document summarizes key concepts relating to three probability distributions:
1) The normal distribution describes variables that arise from the addition of small random effects and approximates the binomial distribution for large numbers of trials. It is used to model natural phenomena influenced by many independent factors.
2) The binomial distribution describes discrete random variables resulting from Bernoulli trials with a fixed probability of success. It gives the probability of a given number of successes in fixed number of trials.
3) The Poisson distribution approximates the binomial when the probability of success is very small but the number of trials is large. It is used to model rare random events occurring independently over an interval of time or space.
Chi -square test
Chi -square testVIVEK KUMAR SINGH The chi-square test is used to compare observed data with expected data. It was developed by Karl Pearson in 1900. The chi-square test calculates the sum of the squares of the differences between the observed and expected frequencies divided by the expected frequency. The chi-square value is then compared to a critical value to determine if there is a significant difference between the observed and expected results. The degrees of freedom, which determine the critical value, are calculated based on the number of rows and columns in a contingency table. The chi-square test can be used to test goodness of fit, independence of attributes, and other hypotheses.
Karl pearson's correlation
Karl pearson's correlationfairoos1 this ppt gives you adequate information about Karl Pearsonscoefficient correlation and its calculation. its the widely used to calculate a relationship between two variables. The correlation shows a specific value of the degree of a linear relationship between the X and Y variables. it is also called as The Karl Pearson‘s product-moment correlation coefficient. the value of r is alwys lies between -1 to +1. + 0.1 shows Lower degree of +ve correlation, +0.8 shows Higher degree of +ve correlation.-0.1 shows Lower degree of -ve correlation. -0.8 shows Higher degree of -ve correlation.
Correlation and Regression
Correlation and RegressionSir Parashurambhau College, Pune 1. Correlation analysis measures the strength and direction of the linear relationship between two variables. It ranges from -1 to 1, where -1 is a perfect negative correlation, 0 is no correlation, and 1 is a perfect positive correlation.
2. Scatter diagrams provide a visual representation of the relationship between two variables but do not provide a precise measure of correlation. Pearson's correlation coefficient (r) calculates the numerical strength of the linear relationship.
3. Correlation is widely used in fields like agriculture, genetics, and physiology to study relationships between variables like crop yield and fertilizer use, gene linkage, and organism growth and environmental factors.
Simple linear regression
Simple linear regressionRekhaChoudhary24 This document provides an introduction to basic statistics and regression analysis. It defines regression as relating to or predicting one variable based on another. Regression analysis is useful for economics and business. The document outlines the objectives of understanding simple linear regression, regression coefficients, and merits and demerits of regression analysis. It describes types of regression including simple and multiple regression. Key concepts explained in more detail include regression lines, regression equations, regression coefficients, and the difference between correlation and regression. Examples are provided to demonstrate calculating regression equations using different methods.
Anova ppt
Anova pptSravani Ganti This document provides an overview of analysis of variance (ANOVA). It describes how ANOVA was developed by R.A. Fisher in 1920 to analyze differences between multiple sample means. The document outlines the F-statistic used in ANOVA to compare between-group and within-group variations. It also describes one-way and two-way classifications of ANOVA and provides examples of applications in fields like agriculture, biology, and pharmaceutical research.
Measures of dispersion
Measures of dispersionSachin Shekde This document provides an overview of measures of dispersion, including range, quartile deviation, mean deviation, standard deviation, and variance. It defines dispersion as a measure of how scattered data values are around a central value like the mean. Different measures of dispersion are described and formulas are provided. The standard deviation is identified as the most useful measure as it considers all data values and is not overly influenced by outliers. Examples are included to demonstrate calculating measures of dispersion.
Regression ppt
Regression pptShraddha Tiwari Regression analysis is a statistical technique for investigating relationships between variables. Simple linear regression defines a relationship between two variables (X and Y) using a best-fit straight line. Multiple regression extends this to model relationships between a dependent variable Y and multiple independent variables (X1, X2, etc.). Regression coefficients are estimated to define the regression equation, and R-squared and the standard error can be used to assess the goodness of fit of the regression model to the data. Regression analysis has applications in pharmaceutical experimentation such as analyzing standard curves for drug analysis.
Correlation and regression
Correlation and regressionHuma Ansari Meaning
Types
Objectives
Methods
Difference
For classification the output(s) is nominal
In regression the output is continuous
Correlation and regression
Correlation and regressionMOHIT PANCHAL The document discusses correlation and regression analysis. It defines correlation as the statistical relationship between two variables, where a change in one variable corresponds to a change in the other. The key types of correlation are positive, negative, simple, partial and multiple, and linear and non-linear. Regression analysis establishes the average relationship between an independent and dependent variable in order to predict or estimate values of the dependent variable based on the independent variable. Methods for studying correlation include scatter diagrams and Karl Pearson's coefficient of correlation, while regression analysis uses equations to model the linear relationship between variables.
Discriminant analysis
Discriminant analysisAmritashish Bagchi This document discusses discriminant analysis, which is a statistical technique used to classify observations into predefined groups based on independent variables. It can be used to predict the likelihood an entity belongs to a particular class. The document outlines the objectives, purposes, assumptions, and steps of discriminant analysis. It provides examples of using it to classify individuals as basketball vs volleyball players or high vs low performers based on variables.
Correlation
CorrelationAnish Maman Correlation and regression analysis are statistical tools used to analyze relationships between variables. Correlation measures the strength and direction of association between two variables on a scale from -1 to 1. Regression analysis uses one variable to predict the value of another variable and draws a best-fit line to represent their relationship. There are always two lines of regression - one showing the regression of x on y and the other showing the regression of y on x. Regression coefficients from these lines indicate the slope and intercept of the lines and can help estimate unknown variable values based on known values.
Partial correlation
Partial correlationDwaitiRoy This document is a presentation by Dwaiti Roy on partial correlation. It begins with an acknowledgement section thanking various professors and resources that helped in preparing the presentation. It then provides definitions and explanations of key concepts related to partial correlation such as correlation, assumptions of correlation, coefficient of correlation, coefficient of determination, variates, partial correlation, assumptions and hypothesis of partial correlation, order and formula of partial correlation. Examples are provided to illustrate partial correlation. The document concludes with references and suggestions for further reading.
Viewers also liked (8)
Statistics report THE RANGE
Statistics report THE RANGECharliez Jane Soriano The range is the simplest measure of variability, defined as the difference between the highest and lowest values in a data set. It is quick to calculate but does not provide a full picture of the data distribution and can be strongly influenced by outliers. Other measures of variability include the average deviation, which calculates the average amount each score deviates from the mean, and the interquartile range, which is less influenced by outliers than the range. The interquartile range only considers data between the first and third quartiles and ignores half the data points.
Percentile
PercentileDMCI The remaining documents provide more information and examples about percentiles, percentile rank, and how to calculate them based
QUARTILES, DECILES AND PERCENTILES
QUARTILES, DECILES AND PERCENTILESMARIA KATRINA MACAPAZ This document discusses different methods for organizing data, including percentiles, quartiles, and deciles. It provides the definitions and formulas for calculating each. Percentiles indicate the value below which a given percentage of observations fall. Quartiles divide a data set into four equal parts, with the median (Q2) separating the lower and upper halves. Deciles divide a data set into ten equal parts. The document gives examples of calculating percentiles, quartiles, and deciles for sample data sets.
Correlation
CorrelationNabaz Nazim Correlation is a statistical technique used to determine the degree of relationship between two variables. Correlational research aims to identify and describe relationships but does not imply causation. Positive correlation indicates high scores on one variable are associated with high scores on the other, while negative correlation means high scores on one variable are associated with low scores on the other. Correlational research can be used for explanatory or predictive purposes. More complex techniques like multiple regression allow prediction using combinations of variables. Threats to internal validity like subject characteristics must be controlled.
Multiple regression
Multiple regressionVenkata Reddy Konasani Here are the key steps and results:
1. Load the data and run a multiple linear regression with x1 as the target and x2, x3 as predictors.
R-squared is 0.89
2. Add x4, x5 as additional predictors.
R-squared increases to 0.94
3. Add x6, x7 as additional predictors.
R-squared further increases to 0.98
So as more predictors are added, the R-squared value increases, indicating more of the variation in x1 is explained by the model. However, adding too many predictors can lead to overfitting.
Measures of dispersion
Measures of dispersionSouthern Range, Berhampur, Odisha The document discusses various measures used to describe the dispersion or variability in a data set. It defines dispersion as the extent to which values in a distribution differ from the average. Several measures of dispersion are described, including range, interquartile range, mean deviation, and standard deviation. The document also discusses measures of relative standing like percentiles and quartiles, and how they can locate the position of observations within a data set. The learning objectives are to understand how to describe variability, compare distributions, describe relative standing, and understand the shape of distributions using these measures.
Multiple linear regression
Multiple linear regressionJames Neill Introduces and explains the use of multiple linear regression, a multivariate correlational statistical technique. For more info, see the lecture page at http://goo.gl/CeBsv. See also the slides for the MLR II lecture http://www.slideshare.net/jtneill/multiple-linear-regression-ii
Correlation and regression
Correlation and regressionKhalid Aziz This document provides an introduction to correlation and regression analysis. It defines correlation as a measure of the association between two variables and regression as using one variable to predict another. The key aspects covered are:
- Calculating correlation using Pearson's correlation coefficient r to measure the strength and direction of association between variables.
- Performing simple linear regression to find the "line of best fit" to predict a dependent variable from an independent variable.
- Using a TI-83 calculator to graphically display scatter plots of data and calculate the regression equation and correlation coefficient.
Ad
More from Kritika Jain (20)
Lecture 12 q uestion on leverage analysis
Lecture 12 q uestion on leverage analysisKritika Jain This document contains 22 questions from Amity Business School related to financial leverage, operating leverage, and combined leverage. Questions ask students to calculate various leverage ratios from income statements and balance sheets of companies. They are also asked to interpret the significance of leverage ratios and how they impact decision making. Students must calculate earnings per share, break-even point, changes in EPS from changes in sales or costs.
Lecture 11 leverage
Lecture 11 leverageKritika Jain The document discusses financial leverage and how it is calculated. Financial leverage measures the relationship between earnings before interest and taxes (EBIT) and earnings per share (EPS). It reflects how a change in EBIT impacts EPS due to the presence of fixed financial charges like interest and dividends. The degree of financial leverage (DFL) is calculated as the percentage change in EPS divided by the percentage change in EBIT. Financial leverage exists when there are fixed financial costs, and is a measure of how much debt a firm uses.
Lecture 10 leverage
Lecture 10 leverageKritika Jain 1. Leverage reflects the responsiveness of one financial variable to changes in another variable. It is measured by the percentage change in the dependent variable divided by the percentage change in the independent variable.
2. Leverage refers to using fixed costs to magnify returns. There are operating fixed costs like rent and financial fixed costs like interest. Operating, financial, and total leverage can be measured.
3. Operating leverage measures the relationship between sales and earnings before interest and taxes (EBIT). It indicates how much EBIT changes with sales. Firms with high operating leverage face more risk from changes in sales.
Lecture 6 time value of money
Lecture 6 time value of moneyKritika Jain The document contains questions related to time value of money concepts such as compound interest, present and future value of investments, annuities, and loans. It asks the reader to calculate future and present values under different interest rate scenarios, determine investment amounts needed to achieve future targets, and analyze loan and investment schemes. It also includes a mini case about determining retirement planning numbers.
Lecture 5 time value of money
Lecture 5 time value of moneyKritika Jain The document discusses discounting techniques used to determine the present value of future cash flows. It provides formulas to calculate the present value of a single cash flow, an annuity, and an annuity due. Examples are given of calculating the present value of Rs. 50,000 received in 15 years, an ordinary annuity of Rs. 1,000 for 3 years, and an annuity due of Rs. 1,000 for 3 years. The document also provides an example of choosing between a lump sum payment and annual pension based on present value calculations.
Lecture 4 time value of money
Lecture 4 time value of moneyKritika Jain The document discusses compounding techniques and calculating future values. It defines compound interest as interest earned on the initial principal sum becoming part of the principal. It then provides formulas and examples for calculating the future value of a single cash flow (lump sum) and the future value of a series of cash flows (annuity), including ordinary annuities where payments occur at the end of each period and annuities due where payments occur at the beginning of each period. Non-annual compounding and sinking funds are also briefly discussed.
Lecture 3 time value of money
Lecture 3 time value of moneyKritika Jain This document discusses the time value of money concept from an Amity Business School financial management class. It explains that money has greater value when received today compared to in the future due to uncertainties and reinvestment opportunities. It also discusses how timelines can be used to visualize cash flows occurring at different points in time and how compounding and discounting techniques allow comparison of cash flows across time periods by converting them to a common point in time.
Lecture 2. introduction to financial management
Lecture 2. introduction to financial managementKritika Jain The document discusses financial management topics taught in an MBA program at Amity Business School. It defines the financial environment and system, including financial markets, instruments, intermediaries, and the regulatory framework. It then compares the objectives of profit maximization versus wealth maximization. Profit maximization is criticized for being vague, ignoring the time value of money and risk. Wealth maximization, also called value or net present worth maximization, is presented as a better objective as it focuses on maximizing shareholder value through appropriate financial decisions.
Lecture 1. introduction to financial management
Lecture 1. introduction to financial managementKritika Jain The document provides an overview of financial management. It defines financial management as planning and controlling a firm's financial resources, including procuring funds in an economic manner and employing funds optimally to maximize returns. It then outlines the evolution of financial management from the traditional to modern phase. Key aspects of financial management are investment, financing, and dividend decisions. Investment decisions involve selecting profitable investment avenues. Financing decisions relate to determining the optimal capital structure and sources of finance. Dividend decisions balance paying dividends to shareholders versus retaining profits for reinvestment.
Lecture 33 dividend decision
Lecture 33 dividend decisionKritika Jain Here are my analyses of the expected dividend payout ratios for each company described:
- A company with a large proportion of inside ownership, all of whom are high income individual: Medium/high payout ratio. High income insiders prefer current dividends.
- A growth company with an abundance of good investment opportunities: Low payout ratio. Growth companies retain more earnings to fund good investment opportunities.
- A company experiencing ordinary growth that has liquidity and much unused borrowing capacity: Medium/high payout ratio. With liquidity and borrowing capacity, it has flexibility to pay dividends while still investing for growth.
- A company that experiences an unexpected drop in earnings from a trend: Low payout ratio. It
Lecture 32 dividend decision
Lecture 32 dividend decisionKritika Jain This document discusses two theories on the impact of dividend declaration on firm valuation:
1) The irrelevance theory argues that dividend decisions do not impact shareholder wealth or market price since earnings can be retained or distributed as dividends through financing decisions.
2) The Modigliani-Miller approach also claims dividend policy does not affect market share price or firm value, which is determined by earnings capacity. Dividing earnings between retention and dividends does not change the firm's overall value.
The document provides an example to prove that under the MM hypothesis, paying a dividend of Rs. 6 per share for a firm with 5000 shares and expected earnings of Rs. 50,000 investing Rs. 100,000 does
Lecture 31 inventory management
Lecture 31 inventory managementKritika Jain The document discusses inventory management techniques. It describes the purposes of holding inventory as transaction motive, precaution motive, and speculative motive. It also discusses the risks and costs of holding inventory. The objectives of inventory management are to ensure continuous supply and avoid overstocking/understocking while maintaining optimal investment levels. Techniques discussed include determining minimum, maximum, reorder, and danger stock levels. It also discusses economic order quantity and receivables management concepts.
Lecture 29 working capital question
Lecture 29 working capital questionKritika Jain Loop Ltd requires net working capital to produce 100 units. It needs raw materials for 8 weeks of stock, work in progress for 6 weeks, and finished goods stock for 6 weeks. Accounts receivable are 2 weeks and accounts payable are 4 weeks. Estimated net working capital is the total working capital requirement plus a 20% contingency amount.
Lecture 26 capital budgeting
Lecture 26 capital budgetingKritika Jain The document discusses various capital budgeting techniques used to evaluate investment projects, including payback period and net present value (NPV). It provides examples of how to calculate payback period for projects with both uniform and non-uniform cash flows. It also discusses the limitations of payback period as a capital budgeting method. The document then introduces NPV as a discounted cash flow technique and provides the formula for calculating NPV. It states that projects with positive NPV should be accepted while projects with negative NPV should be rejected.
Lecture 24 capital budgeting
Lecture 24 capital budgetingKritika Jain The document discusses the steps involved in capital budgeting decisions and cash flow calculations for capital projects. It provides an example calculation for a company considering investing Rs. 100,000 in new machinery. The summary is:
1) Capital budgeting involves estimating cash flows, cost of capital, and selecting a decision criterion.
2) For a new machinery investment, the initial cash outflow is Rs. 120,000 and annual cash flows are calculated over 5 years based on revenues, expenses, depreciation, and taxes.
3) The example calculates the annual and terminal cash flows after tax for the machinery project.
Lecture 23 capital budgeting
Lecture 23 capital budgetingKritika Jain For taxation purposes in India, depreciation is charged on a "block of assets" which is a group of assets in the same class (buildings, furniture, plant, etc.) that have the same prescribed depreciation rate, rather than on individual assets. There are 12 such blocks for 4 classes of assets specified in the Income Tax Act. Capital gains arise when the sale proceeds of a block of assets exceeds the written down value of that block.
Lecture 22 capital budgeting
Lecture 22 capital budgetingKritika Jain The document outlines the capital budgeting process at Amity Business School, which includes generating investment ideas, estimating cash flows, evaluating cash flows, selecting projects, and monitoring execution. It emphasizes that capital budgeting should be based on cash flows rather than accrual accounting because cash flows are more certain amounts and avoid different interpretations. It provides principles for estimating cash flows, such as only including cash inflows and outflows, ignoring non-cash items like depreciation, calculating after-tax cash flows, and ignoring sunk costs already incurred.
Lecture 21 capital budgeting
Lecture 21 capital budgetingKritika Jain - The document discusses capital budgeting and cash flow analysis for a proposed machinery investment of Rs. 1,20,000 with a 5 year life.
- It calculates the annual cash flows after tax over the 5 years, which range from Rs. 24,100 to Rs. 38,800, factoring in revenue, expenses, depreciation and taxes.
- The terminal cash flow at the end of 5 years is Rs. 48,800, which includes the final annual cash flow plus the expected scrap value of Rs. 10,000 for the machine.
Lecture 20 capital structure
Lecture 20 capital structureKritika Jain The document discusses several theories of capital structure:
1) The traditional approach finds that a firm's value and cost of capital initially decrease with more debt but then increase after a certain point as debt rises.
2) Modigliani and Miller's approach suggests capital structure does not affect firm value in the absence of taxes.
3) Pecking order theory proposes firms prefer internal funds, then debt, and finally equity when raising capital, due to costs and information asymmetries.
4) Static trade-off theory finds an optimal capital structure where the marginal benefit of debt's tax shield equals the marginal costs of bankruptcy.
Lecture 19 capital structure
Lecture 19 capital structureKritika Jain 1. The net income approach suggests that a firm can minimize its weighted average cost of capital and maximize shareholder value by using as much debt financing as possible, as long as the cost of debt is less than the cost of equity and risk is unchanged.
2. The net operating income approach, proposed by Durand, argues that a company's total market value and overall cost of capital remain constant regardless of its debt-equity ratio, so every capital structure is optimal.
3. The document provides examples to illustrate how to calculate a firm's value and capitalization rates under each approach, assuming no corporate taxes.
Ad
Recently uploaded (20)
Kasdorf "Accessibility Essentials: A 2025 NISO Training Series, Session 5, Ac...
Kasdorf "Accessibility Essentials: A 2025 NISO Training Series, Session 5, Ac...National Information Standards Organization (NISO) This presentation was provided by Bill Kasdorf of Kasdorf & Associates LLC and Publishing Technology Partners, during the fifth session of the NISO training series "Accessibility Essentials." Session Five: A Standards Seminar, was held May 1, 2025.
How to Manage Purchase Alternatives in Odoo 18
How to Manage Purchase Alternatives in Odoo 18Celine George Managing purchase alternatives is crucial for ensuring a smooth and cost-effective procurement process. Odoo 18 provides robust tools to handle alternative vendors and products, enabling businesses to maintain flexibility and mitigate supply chain disruptions.
Geography Sem II Unit 1C Correlation of Geography with other school subjects
Geography Sem II Unit 1C Correlation of Geography with other school subjectsProfDrShaikhImran The correlation of school subjects refers to the interconnectedness and mutual reinforcement between different academic disciplines. This concept highlights how knowledge and skills in one subject can support, enhance, or overlap with learning in another. Recognizing these correlations helps in creating a more holistic and meaningful educational experience.

pulse ppt.pptx Types of pulse , characteristics of pulse , Alteration of pulse
pulse ppt.pptx Types of pulse , characteristics of pulse , Alteration of pulsesushreesangita003 what is pulse ?
Purpose
physiology and Regulation of pulse
Characteristics of pulse
factors affecting pulse
Sites of pulse
Alteration of pulse
for BSC Nursing 1st semester
for Gnm Nursing 1st year
Students .
vitalsign
Drive Supporter Growth from Awareness to Advocacy with TechSoup Marketing Ser...
Drive Supporter Growth from Awareness to Advocacy with TechSoup Marketing Ser...TechSoup Learn how to understand and optimize your audience experience with awareness of your impact.
YSPH VMOC Special Report - Measles Outbreak Southwest US 5-3-2025.pptx
YSPH VMOC Special Report - Measles Outbreak Southwest US 5-3-2025.pptxYale School of Public Health - The Virtual Medical Operations Center (VMOC) A measles outbreak originating in West Texas has been linked to confirmed cases in New Mexico, with additional cases reported in Oklahoma and Kansas. The current case count is 817 from Texas, New Mexico, Oklahoma, and Kansas. 97 individuals have required hospitalization, and 3 deaths, 2 children in Texas and one adult in New Mexico. These fatalities mark the first measles-related deaths in the United States since 2015 and the first pediatric measles death since 2003.
The YSPH Virtual Medical Operations Center Briefs (VMOC) were created as a service-learning project by faculty and graduate students at the Yale School of Public Health in response to the 2010 Haiti Earthquake. Each year, the VMOC Briefs are produced by students enrolled in Environmental Health Science Course 581 - Public Health Emergencies: Disaster Planning and Response. These briefs compile diverse information sources – including status reports, maps, news articles, and web content– into a single, easily digestible document that can be widely shared and used interactively. Key features of this report include:
- Comprehensive Overview: Provides situation updates, maps, relevant news, and web resources.
- Accessibility: Designed for easy reading, wide distribution, and interactive use.
- Collaboration: The “unlocked" format enables other responders to share, copy, and adapt seamlessly. The students learn by doing, quickly discovering how and where to find critical information and presenting it in an easily understood manner.
CURRENT CASE COUNT: 817 (As of 05/3/2025)
• Texas: 688 (+20)(62% of these cases are in Gaines County).
• New Mexico: 67 (+1 )(92.4% of the cases are from Eddy County)
• Oklahoma: 16 (+1)
• Kansas: 46 (32% of the cases are from Gray County)
HOSPITALIZATIONS: 97 (+2)
• Texas: 89 (+2) - This is 13.02% of all TX cases.
• New Mexico: 7 - This is 10.6% of all NM cases.
• Kansas: 1 - This is 2.7% of all KS cases.
DEATHS: 3
• Texas: 2 – This is 0.31% of all cases
• New Mexico: 1 – This is 1.54% of all cases
US NATIONAL CASE COUNT: 967 (Confirmed and suspected):
INTERNATIONAL SPREAD (As of 4/2/2025)
• Mexico – 865 (+58)
‒Chihuahua, Mexico: 844 (+58) cases, 3 hospitalizations, 1 fatality
• Canada: 1531 (+270) (This reflects Ontario's Outbreak, which began 11/24)
‒Ontario, Canada – 1243 (+223) cases, 84 hospitalizations.
• Europe: 6,814
GDGLSPGCOER - Git and GitHub Workshop.pptx
GDGLSPGCOER - Git and GitHub Workshop.pptxazeenhodekar This presentation covers the fundamentals of Git and version control in a practical, beginner-friendly way. Learn key commands, the Git data model, commit workflows, and how to collaborate effectively using Git — all explained with visuals, examples, and relatable humor.
Debunking the Myths behind AI - v1, Carl Dalby
Debunking the Myths behind AI - v1, Carl DalbyAssociation for Project Management APM webinar hosted by the South Wales and West of England Network on 1 May 2025.
Speaker: Carl Dalby, Group Head of AI/Digital, NDA
So, what does AI mean for you as a project professional, how can you take advantage of it to improve the success of your project? This webinar was held on 1 May 2025.
There is a lot of misinformation, myth, and misconception surrounding Artificial Intelligence in the press and on social media. Using real world examples and case studies around project and risk management, Carl Dalby looked at what AI is and is not, and how Project Professionals can use AI to help augment their decision making by gaining valuable insights into what their data is actually telling them.
Carl adapted his talk to reflect the very latest thinking in this very fast-moving sector
https://www.apm.org.uk/news/debunking-the-myths-behind-ai-what-it-really-means-for-you-as-a-project-professional/
03#UNTAGGED. Generosity in architecture.
03#UNTAGGED. Generosity in architecture.MCH What makes space feel generous, and how architecture address this generosity in terms of atmosphere, metrics, and the implications of its scale? This edition of #Untagged explores these and other questions in its presentation of the 2024 edition of the Master in Collective Housing. The Master of Architecture in Collective Housing, MCH, is a postgraduate full-time international professional program of advanced architecture design in collective housing presented by Universidad Politécnica of Madrid (UPM) and Swiss Federal Institute of Technology (ETH).
Yearbook MCH 2024. Master in Advanced Studies in Collective Housing UPM - ETH


YSPH VMOC Special Report - Measles Outbreak Southwest US 4-30-2025.pptx
YSPH VMOC Special Report - Measles Outbreak Southwest US 4-30-2025.pptxYale School of Public Health - The Virtual Medical Operations Center (VMOC) A measles outbreak originating in West Texas has been linked to confirmed cases in New Mexico, with additional cases reported in Oklahoma and Kansas. The current case count is 795 from Texas, New Mexico, Oklahoma, and Kansas. 95 individuals have required hospitalization, and 3 deaths, 2 children in Texas and one adult in New Mexico. These fatalities mark the first measles-related deaths in the United States since 2015 and the first pediatric measles death since 2003.
The YSPH Virtual Medical Operations Center Briefs (VMOC) were created as a service-learning project by faculty and graduate students at the Yale School of Public Health in response to the 2010 Haiti Earthquake. Each year, the VMOC Briefs are produced by students enrolled in Environmental Health Science Course 581 - Public Health Emergencies: Disaster Planning and Response. These briefs compile diverse information sources – including status reports, maps, news articles, and web content– into a single, easily digestible document that can be widely shared and used interactively. Key features of this report include:
- Comprehensive Overview: Provides situation updates, maps, relevant news, and web resources.
- Accessibility: Designed for easy reading, wide distribution, and interactive use.
- Collaboration: The “unlocked" format enables other responders to share, copy, and adapt seamlessly. The students learn by doing, quickly discovering how and where to find critical information and presenting it in an easily understood manner.
Metamorphosis: Life's Transformative Journey
Metamorphosis: Life's Transformative JourneyArshad Shaikh *Metamorphosis* is a biological process where an animal undergoes a dramatic transformation from a juvenile or larval stage to a adult stage, often involving significant changes in form and structure. This process is commonly seen in insects, amphibians, and some other animals.
Biophysics Chapter 3 Methods of Studying Macromolecules.pdf
Biophysics Chapter 3 Methods of Studying Macromolecules.pdfPKLI-Institute of Nursing and Allied Health Sciences Lahore , Pakistan. This chapter provides an in-depth overview of the viscosity of macromolecules, an essential concept in biophysics and medical sciences, especially in understanding fluid behavior like blood flow in the human body.
Key concepts covered include:
✅ Definition and Types of Viscosity: Dynamic vs. Kinematic viscosity, cohesion, and adhesion.
⚙️ Methods of Measuring Viscosity:
Rotary Viscometer
Vibrational Viscometer
Falling Object Method
Capillary Viscometer
🌡️ Factors Affecting Viscosity: Temperature, composition, flow rate.
🩺 Clinical Relevance: Impact of blood viscosity in cardiovascular health.
🌊 Fluid Dynamics: Laminar vs. turbulent flow, Reynolds number.
🔬 Extension Techniques:
Chromatography (adsorption, partition, TLC, etc.)
Electrophoresis (protein/DNA separation)
Sedimentation and Centrifugation methods.
K12 Tableau Tuesday - Algebra Equity and Access in Atlanta Public Schools
K12 Tableau Tuesday - Algebra Equity and Access in Atlanta Public Schoolsdogden2 Algebra 1 is often described as a “gateway” class, a pivotal moment that can shape the rest of a student’s K–12 education. Early access is key: successfully completing Algebra 1 in middle school allows students to complete advanced math and science coursework in high school, which research shows lead to higher wages and lower rates of unemployment in adulthood.
Learn how The Atlanta Public Schools is using their data to create a more equitable enrollment in middle school Algebra classes.
APGAR SCORE BY sweety Tamanna Mahapatra MSc Pediatric
APGAR SCORE BY sweety Tamanna Mahapatra MSc PediatricSweetytamannaMohapat Learn about the APGAR SCORE , a simple yet effective method to evaluate a newborn's physical condition immediately after birth ....this presentation covers .....
what is apgar score ?
Components of apgar score.
Scoring system
Indications of apgar score........
apa-style-referencing-visual-guide-2025.pdf
apa-style-referencing-visual-guide-2025.pdfIshika Ghosh Title: A Quick and Illustrated Guide to APA Style Referencing (7th Edition)
This visual and beginner-friendly guide simplifies the APA referencing style (7th edition) for academic writing. Designed especially for commerce students and research beginners, it includes:
✅ Real examples from original research papers
✅ Color-coded diagrams for clarity
✅ Key rules for in-text citation and reference list formatting
✅ Free citation tools like Mendeley & Zotero explained
Whether you're writing a college assignment, dissertation, or academic article, this guide will help you cite your sources correctly, confidently, and consistent.
Created by: Prof. Ishika Ghosh,
Faculty.
📩 For queries or feedback: [email protected]
Presentation of the MIPLM subject matter expert Erdem Kaya
Presentation of the MIPLM subject matter expert Erdem KayaMIPLM Presentation of the MIPLM subject matter expert Erdem Kaya
Kasdorf "Accessibility Essentials: A 2025 NISO Training Series, Session 5, Ac...
Kasdorf "Accessibility Essentials: A 2025 NISO Training Series, Session 5, Ac...National Information Standards Organization (NISO)
YSPH VMOC Special Report - Measles Outbreak Southwest US 5-3-2025.pptx
YSPH VMOC Special Report - Measles Outbreak Southwest US 5-3-2025.pptxYale School of Public Health - The Virtual Medical Operations Center (VMOC)
YSPH VMOC Special Report - Measles Outbreak Southwest US 4-30-2025.pptx
YSPH VMOC Special Report - Measles Outbreak Southwest US 4-30-2025.pptxYale School of Public Health - The Virtual Medical Operations Center (VMOC)
Biophysics Chapter 3 Methods of Studying Macromolecules.pdf
Biophysics Chapter 3 Methods of Studying Macromolecules.pdfPKLI-Institute of Nursing and Allied Health Sciences Lahore , Pakistan.