Pattern Perception and Map Design
4 likes432 views

The document discusses principles of pattern perception and map design. It covers Gestalt's laws of proximity, similarity, connectedness, continuity, symmetry, closure, and relative size. It then discusses representing vector fields through showing direction, magnitude, and orientation. It also discusses the perceptual syntax of diagrams through creating nodes and relationships. Finally, it discusses the visual grammar of maps through using contours, textures, colors, and lines to represent geographic regions, paths, and point entities.


Ad
More Related Content
What's hot (20)
Similar to Pattern Perception and Map Design (20)


Ad
More from Mike Crabb (20)


Ad
Recently uploaded (20)


![Halstead’s_Software_Science_&_Putnam’s_Model[1].pptx](https://cdn.slidesharecdn.com/ss_thumbnails/halsteadssoftwarescienceputnamsmodel1-250502175814-4c85707e-thumbnail.jpg?width=560&fit=bounds)


![Download Chimera Tool Setup V42.47.0924 [Latest Version]](https://cdn.slidesharecdn.com/ss_thumbnails/artificialintelligence4-250505221011-8e660a4e-thumbnail.jpg?width=560&fit=bounds)
Pattern Perception and Map Design
- 1. digital-media@rgu Pattern perception and map design
- 2. what are we looking at? Gestalts Laws Representing vector fields perceptual syntax of diagrams visual grammar of maps
- 3. Introduction
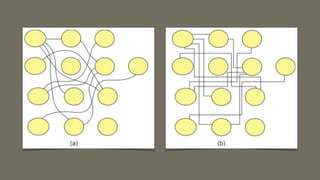
- 8. Proximity
- 9. Proximity
- 10. Place symbols and glyphs representing related information close together
- 11. Similarity
- 12. Similarity
- 13. When designing a grid layout of a data set, consider coding rows and/or columns using low-level visual channel properties, such as colour and texture.
- 14. Connectedness
- 15. To show relationships between entities, consider linking graphical representations of data objects using lines or ribbons of color.
- 16. continuity
- 18. Symmetry
- 19. Symmetry
- 20. Symmetry
- 21. Consider using symmetry to make pattern comparisons easier
- 22. closure and common region
- 23. closure and common region
- 24. closure and common region
- 25. Consider putting related information inside a closed contour. A line is adequate for regions having a simple shape. Colour or texture can be used to define regions that have more complex shapes.
- 26. closure and common region
- 27. To define multiple overlapping regions, consider using a combination of line contour, colour, texture, and Cornsweet contours.
- 29. Use a combination of closure, common region, and layout to ensure that data entities are represented by graphical patterns that will be perceived as figures, not ground.
- 31. Representing Vector Fields: Perceiving Orientation and Direction
- 36. Showing direction with brush strokes
- 38. To represent flow direction in a vector field visualization, use streamlets with heads that are more distinct than tails, based on luminance contrast. A streamlet is a glyph that is elongated along a streamline and which induces a strong response in neurons sensitive to orientations tangential to the flow.
- 40. For vector field visualizations, use more distinct graphical elements to show greater field strength or speed. They can be wider, longer, more contrasting, or faster moving.
- 41. Perceptual syntax of diagrams
- 44. creating nodes
- 45. When developing glyphs, use small, closed shapes to represent data entities, and use the color, shape, and size of those shapes to represent attributes of those entities.
- 49. Use connecting lines, enclosure, grouping, and attachment to represent relationships between entities. The shape, color, and thickness of lines and enclosures can represent the types of relationships.
- 51. As an alternative to arrows to represent directed relationships in diagrams, consider using tapered lines with the broadest end at the source node.
- 52. the visual grammar of maps
- 57. 1694
- 58. 1815
- 59. 1918
- 60. Use closed contours, areas of texture, or areas of color to denote geographic regions. Use color, texture, or boundary style to denote the type of region.
- 61. 1922
- 64. Use lines to represent paths and linear geographic features. Use line color and style to represent the type of linear feature.
- 68. Use small, closed shapes to represent point entities, such as cities, that appear small on a map. Use color, shape, and size to represent attributes of these entities.
- 69. what did we look at? Gestalts Laws Representing vector fields perceptual syntax of diagrams visual grammar of maps