SlideShare a Scribd company logo
The Balanced Scorecard Approach
MBA-I , DMS, NALSAR
What is a Balanced Scorecard?
The Balanced Scorecard is a strategic planning and
management system used to align business activities
to the vision and strategy of the organization by
monitoring performance against strategic goals.
Balanced Scorecard Concept
• Was first published in 1992 by Kaplan and Norton, a
book followed in 1996.
• Traditional performance measurement that only
focus on external accounting data are obsolete.
• The approach is to provide 'balance' to the financial
perspective.
The Balanced Scorecard:
A Good Idea in 1992
“The Balanced Scorecard –
Measures that Drive
Performance”
Harvard Business Review,
1992
Balanced Scorecard in 1992
The Balanced Scorecard:
A Great Idea by 2002
50% usage in Fortune 500
Harvard Business Review “Hall of Fame”
50,000+ BSC on-line members
Balanced Scorecard by 2002
21 translations
17
translations
Balanced Scorecard Hall of Fame Implemented Strategies and
Achieved Breakthrough Results… Fast
Saatchi & Saatchi
+ $2b
ATT Canada
+ $7b
Chemical Bank
• 99% Merged Target
Asset Retention
UPS
Southern Garden
Wells Fargo
Cigna
+ $3b
Brown & Root
• #1 in growth &
profitability
City of Charlotte Duke Children’s
Mobil
• Last to first
• Cash flow +$1.2b
• ROI 6% --> 16%
Hilton Hotels
• Least Cost Producer
3 years
• Customer Satisfaction
• Market Revenue Index
• Revenues 9%
• Net Income
33%
• # Customers
450%
• Best Online Bank
• Customer Satisfaction = 70%
• Public Official Award
• Customer Satisfaction #1
• Cost/Case 33%
3 years
2-5 years 3 years
3-5 years 3 years
3 years 2 years
3 years 3 years
2-5 years
2 years
© 1998 Renaissance Worldwide, Inc. and
Robert S. Kaplan, All rights reserved.
STRATEGY
HUMAN RESOURCES
BUSINESS UNITS EXECUTIVE TEAM
INFORMATION
TECHNOLOGY
BUDGETS AND CAPITAL
INVESTMENTS
The Balanced Scorecard process allows an organization to align and
focus all its resources on its strategy
Question:
How can complex organizations achieve
results like this in such short periods of
time?
Answer:
Alignment!
A Gap Exists Between Mission-Vision-Strategy and Employees’
Everyday Actions
MISSION
Why we exist
VALUES
What’s important to us
VISION
What we want to be
STRATEGY
Our game plan
EMPOWERMENT / PERSONAL OBJECTIVES
What I need to do
TOTAL QUALITY MANAGEMENT
What we must improve
The Balanced Scorecard Links Vision and Strategy to
Employees’ Everyday Actions
BALANCED SCORECARD
Translate, Focus and Align
STRATEGIC INITIATIVES
What are the priorities
MISSION
Why we exist
VALUES
What’s important to us
VISION
What we want to be
STRATEGY
Our game plan
STRATEGIC OUTCOMES
Satisfied
SHAREHOLDERS
Delighted
CUSTOMERS
Efficient and Effective
PROCESSES
Motivated & Prepared
WORKFORCE
EMPOWERMENT / PERSONAL OBJECTIVES
What I need to do
TOTAL QUALITY MANAGEMENT
What we must improve
Why Use a Balanced Scorecard?
• Improve organizational performance by measuring
what matters
• Increase focus on strategy and results
• Align organization strategy with workers on a day-to-
day basis
• Focus on the drivers key to future performance
• Improve communication of the organization’s Vision
and Strategy
• Prioritize Projects / Initiatives
Balanced Scorecard
• Balance betwen
– Financial measures of performance
– Long-range competitive abilities
Balanced Scorecard
• Four aspects of firm performance
– Financial
– Customer
– Internal business
– Innovation and learning
Financial Perspective
• How do we look to stockholders?
– Survive
– Succeed
– Prosper
Customer Perspective
• How do our customers see us?
– New products
– Responsiveness
– Quality
Internal Business Perspective
• At what must we excel currently?
– Manufacturing/service excellence
– New product/service introduction
Innovation and Learning Perspective
• Can we continue to improve and create value?
– Technological leadership
– Time to market
– Employee training and satisfaction
Perspectives are Interrelated
• Innovation pleases customers which are
necessary for good financial results
• Good financial results make financing
improvements possible
Overall Concepts
• Not just a set of measures
– Measures must relate to strategy
• Critical success factors
– Measures are interrelated
• Must understand how the perspectives influence each other
Overall Concepts
• Not a quick process
– Implementation requires
• Thought
• Analysis
• Data-gathering
• Time
Overall Concepts
• Thought
– What is our strategy?
– What is critical to implementing the strategy?
– How can we measure our progress?
Overall Concepts
• Analysis
– What are the linkages between functions?
– What drives the achievement of goals?
– What measures correlate with the drivers?
Overall Concepts
• Data-gathering
– What data is available? What isn’t?
– How should it be gathered? Reported?
Overall Concepts
• Time
– Cannot be done in an afternoon
– Successful implementation may take several months
– Never-ending process
4 Original Business Perspectives
Adapted from The Balanced Scorecard by Kaplan & Norton
 The Balanced
Scorecard model
suggests that we
view the
organization from 4
perspectives.
 Then Develop
metrics, collect data
and analyze it
relative to each of
these perspectives
4 Business Perspectives Questions
• Financial
– What must we do to create sustainable economic value?
• Internal Business Process
– To satisfy our stakeholders, what must be our levels of
productivity, efficiency, and quality?
• Learning and Growth
– How does our employee performance management system,
including feedback to employees, support high performance?
• Customer
– What do our customers require from us and how are we doing
according to those requirements?
Balanced Scorecard Measurements
Key Implementation Success Factors
• Obtaining executive sponsorship and commitment
• Involving a broad base of leaders, managers and
employees in scorecard development
• Choose the right Scorecard Champion
• Beginning interactive (two-way) communication first
• Viewing the scorecard as a long-term journey rather
than a short-term project
• Getting outside help if needed
Balanced Scorecard Example
STRATEGY MAP BALANCED SCORECARD
MEASUREMENT
PROCESS: MANUFACTURING EXCELLENCE
THEME: ROCE > xx%, VOLUME = xx,xxx units
OBJECTIVES TARGET
ACTION PLAN
INITIATIVE BUDGET
FINANCIAL
PERSPECTIVE
Improve
Productivity
OFFER PRODUCTS & SERVCIES
THAT ARE CONSISTENT, TIMELY
and LOW-COST
Long-Term Shareholder
Value ROCE > xx%
Grow
Revenue
CUSTOMER
PERSPECTIVE
•Operating Cost & Efficiency
•Capacity Utilization
•Capability Utilization
•Brand / Image
• Cost/Unit, Efficiency
•% Utilization
• Monthly Monitoring
• Weekly/Monthly
Monitoring
• Monthly Monitoring
• Weekly/Monthly
Monitoring
•Low Cost Manufacturing
•World-Class Quality
Standards
•World-Class Delivery Timing
•Knowledgeable & Skilled
Partner
•High Customer Satisfaction
•Reinforce Brand Image
• Man-hour per Unit
• Defect per Unit
• Sales Delivery
• Direct Pass Rate
• Market Feedback
• Sales Volume
• Weekly Monitoring
• Daily Monitoring
• Daily Monitoring
• Daily Monitoring
• Weekly Monitoring
• Monthly Monitoring
Prod. & Sales Mtg.
Low
Cost
World
Class
ENSURE OPERATIONAL EXCELLENCE WITH
INNOVATION AS WELL BEING SOCIALLY
RESPONSIBLE
INTERNAL
PERSPECTIVE
Customer
Satisfaction
Enhance
Brand
Operational
Excellence
Process
Innovation
Alliances with
SBUs
Socially
Responsible
•Productivity
•Delivery
•Continuous Improvement
•NPI
•Safety & Health
•Environment
• Cycle Time
• Meet Daily Plan
• WIP
• KAIZEN
• ICC
• Timely Introduction
• Industrial Accident
• Commuting Accident
• Toxic Waste Disposal
• ISO 9002
• Hourly Monitoring
• Daily Monitoring
• Daily Monitoring
• Monthly follow-up
• Specific Programmed
• Weekly Follow-up
• Cross Audits
• Defensive Driving
• Facility Readiness
• Certification
STRATEGIC JOB & SYSTEMS
LEARNING & GROWTH
PERSPECTIVE
Skills Info. System
•Develop the Necessary Skills
•Information Systems
Availability
•Strategic Awareness
• R&D & Development
• ALC, Procurement,
Financial
• Alignment
• Training and Skill
Build-up
• Set-up, Test and
Validation
• Communication
Programmed
• Trial Prod.
• Spare Parts Prod
•Warranty Cost t
OPEX
Rs. XX M
CAPEX
Rs. xx M
Balanced Scorecard Strategy Map
The Road to Disaster
• Senior management not committed
– No one else will be either
• Lack of consensus
– Lack of commitment
The Road to Disaster
• Consultants
– Good
• Provide needed expertise
– Bad
• Take over the project
• Consensus, commitment of employees is lost
The Road to Disaster
• Failure to communicate
– Employees don’t understand:
• Strategy
• Their roles
• Importance of the scorecard measures
The Road to Disaster
• Carve it in stone
– It won’t be perfect, ever
• Must evolve
– Delay implementation until perfect
• See above
The Scorecard as a Change Agent
• Four steps
– Translating the vision into action
– Communicating and linking
– Business planning
– Feedback and learning
Translating the Vision
• Strategy must be reduced to a set of
objectives and measures which can be
operationalized
– “We want to be the best” won’t do
Communicating and Linking
• Corporate strategy must be communicated to
all levels
– Lower levels must have objectives linked to
corporate objectives
Business Planning
• Integrate the financial plan with the business
plan
– Use the scorecard to allocate resources to critical
activities
• Avoids the short-term spending mentality
Feedback and Learning
• Monitor short-term results to determine if
progress is being made toward long-term
objectives
– May need to refine measures, activities,
objectives, even strategy
The Principles of a Strategy-Focused
Organization
TRANSLATE STRATEGY
CONTINUAL PROCESS
ORGANIZATION
ALIGNMENT
EVERYONE’S
JOB
EXECUTIVE
LEADERSHIP
• CEO Sponsorship
• Executive Team Engaged
• “New Way of Managing”
• Accountable for Strategy
• A Performance Culture
• Mission / Vision
• Strategy Maps
• Balanced Scorecard
• Targets
• Initiatives
• Linked to Budgeting
• Linked to Ops. Mgmt.
• Management Meetings
• Feedback System
• Learning Process
• Corporate Role
• Corporate - SBU
• SBU - Shared Services
• External Partners
• Strategic Awareness
• Goal Alignment
• Linked Incentives
BALANCED
SCORECARD
Beyond Balanced Score Card
Global Reporting Initiative
• World’s most widely used standards for
sustainability reporting
• Independent body
• Works closely with UNEP
Economic
• Direct economic value generated and distributed, including revenues,
operating costs, employee compensation, donations and other
community investments, retained earnings, and payments to capital
providers and governments.
• Financial implications and other risks and opportunities for the
organization’s activities due to climate change.
• Coverage of the organization’s defined benefit plan obligations
• Significant financial assistance received from government
• Policy, practices, and proportion of spending on locally-based
suppliers at significant locations of operation
• Procedures for local hiring and proportion of senior management
hired from the local community at locations of significant operation
• Development and impact of infrastructure investments and services
provided primarily for public benefit through commercial, in kind, or
pro bono engagement
Environmental
• Materials used by weight or volume.
• Percentage of materials used that are recycled input materials.
• Direct energy consumption by primary energy source.
• Indirect energy consumption by primary source
• Total water withdrawal by source.
• Total direct and indirect greenhouse gas emissions by weight.
• NO, SO, and other significant air emissions by type and weight
• Total water discharge by quality and destination
• Total weight of waste by type and disposal method
• Total number and volume of significant spills
• Initiatives to mitigate environmental impacts of products and services, and
extent of impact mitigation.
• Percentage of products sold and their packaging materials that are reclaimed
by category
• Monetary value of significant fines and total number of non-monetary
sanctions for noncompliance with environmental laws and regulations
Labor Practices & Decent Work
• Employment
– Total workforce by employment type, employment
contract, and region, broken down by gender
– ……
• Labor Management relation
• Occupational Health & Safety
• Training & Education
• Diversity & Equal Opportunity
• Equal Remuneration for Women & Men
Human Rights
• Investment & procurement practices
• Non-discrimination
• Freedom of association & collective bargaining
• Child labor
• Forced and compulsory labor
• Security practices
• Indigenous rights
• Assessment & Remediation
Society
• Local community
– Percentage of operations with implemented local
community engagement, impact assessments, and
development programs
– Operations with significant potential or actual negative
impacts on local communities
• Corruption
• Public policy
• Anti-competitive behavior
• Compliance
Product Responsibility
• Customer Health & Safety
• Product & service labeling
• Marketing communication
• Customer privacy
• Compliance
Dow Jones Sustainability Index
• Economic Dimensions
– Corporate Governance
– Risk and Crisis Management
– Codes of Conduct/Compliance/Anti-Corruption & Bribery
– Industry Specific Criteria
• Environmental Dimensions
– Environmental Reporting
– Industry Specific Criteria
• Social Dimension
– Human Capital Development
– Talent attraction and retention
– Labour practice indicators
– Corporate citizenship / Philanthrophy
– Social Reporting
– Industry specific criteria
BP Sustainability Index
• Environmental Impact
• Emission
• Nuisance (Noise, odour, visual)
• Carbon footprint
• Waste
• Economic Impact
• Taxes
• Dividends
• Reinvestment
• Social investment
• Money to contractors
• Resource Impact
• Oil & Gas
• Water
• Energy
• Raw Materials
• Intellectual capital
• Infrastructure (physical)
• Social Impact
• Jobs
• Health & Safety
• Tackling Poverty and Social Exclusion
• Equip people with skills to fulfill their potential
• Reduce proportion of unfit housing stock
• Reduce both crime and fear of crime
• Social impact of products
Scholarly developments
• Ranganathan, 1998
– Socio-economic, socio-environmental and environmental-economic
• Parris & Kates 2003
– Sustainability of Nature (Earth, Biodiversity, Ecosystems) through
development of People (Child survival, Life Expectancy, Education,
Equity)
– Sustainability of Life Support (Ecosystem services, Resources,
Environment) through development of Economy (Wealth,
Productive Sectors, Consumption)
– Sustainability of Community (Cultures, Groups, Places) through
development of Society (institutions, Social Capital, States,
Regions)
• Hubbard, 2006 : Beyond Triple Bottom Line
• Szekely and Knirsch, 2005
Economic Sustainability Matrix Environmental Sustainability Matrix Social Sustainability Matrix
 Total Income
 Earning before tax
 Net Income
 Earnings per share
 Total expenditure on purchase of
goods, services and materials
 Equivalent monetary value of all
benefit to staff
 Interest on liabilities and dividends
 Change in retained income
 Taxes paid to authorities
 State subsidies and assistance
 Donations to communities, civil
societies and others in cash and in
kind
 Investment in R&D
 Capital Expenditure
 Cash Flow
 Expenditure on Employee Health and
Safety
 Total spending for culture and society
 Total cost of personnel
 Return on capital after tax
 Appropriation of funds to
shareholders (dividends), to
employees (wages, benefits), to the
state (taxes, levies, duties etc), to
creditors (interest) and to the
company (reserves)
 % of employees in Environment
Management
 Energy consumption
 Water consumption
 Emission of greenhouse gases
 Waste per employee per year
 Paper consumption
 Business travel
 Total material consumption
 Waste recycling
 Acceptance of return of used
products
 Fines, sanctions and penalties for
non-compliance
 Emission to water
 Volume of waste water
 Total spending on environmental
protection
 CO2 emission
 Number of services identified with
potential to contribute to sustainability
 Dust Emission
 Total number of employees
 Staff in Training
 Average participation of employees in
education measures
 % proportion of female employees in
management and executive positions
 Average fluctuation and net change in
employment
 Practice of documentation of
industrial accidents and illness
 Lost days/absence due to injuries in
industrial accidents and work-related
deaths
 Average hour of training / further
training per employee
 Number of trainees
 Cost of personnel
 Disabled employees
 Idea management and employee
participation programs
 Percentage of largest 25 suppliers
that fulfill social criteria
 % of part time employees
 Number of employee projects
 Expenditure on training
 Average year of service of employees
in company
Is mere reporting enough?
Economic Sustainability Matrix Environmental Sustainability Matrix Social Sustainability Matrix
 Return on Investment
 Earnings per share
 % of expenditure on purchase of
goods, services and materials on Total
income
 Equivalent monetary value of all benefit
to staff on total income
 Interest on liabilities on total income
 Change in retained income
 Taxes paid to authorities on total
income
 State subsidies and assistance
received on total income
 % of income for Donations to
communities, civil societies and others
in cash and in kind
 % of income as Investment in R&D
 % of income as investment on Capital
Expenditure
 % of income as total spending for
culture and society
 Appropriation of funds to shareholders
(dividends), to employees (wages,
benefits), to the state (taxes, levies,
duties etc), to creditors (interest) and to
the company (reserves) in percentage
of income
 % of employees in Environment Management
 Energy consumption per unit currency of
income
 Water consumption per unit currency of
income
 Emission of greenhouse gases in ppm
 Waste per employee per year
 Paper consumption per employee
 Business travel expenses per unit currency of
income
 Weight of material consumption per unit
currency of income
 % Waste recycling
 % Acceptance of return of used products
 Fines, sanctions and penalties for non-
compliance as % of total income
 Emission to water in ppm per unit currency of
earning
 Volume of waste water as % to total water
consumed
 % of income as total spending on
environmental protection
 CO2 emission in ppm
 Dust Emission in ppm
 Number of services identified with potential
to contribute to sustainability
 % of income as investment in energy efficient
and non-polluting technology
 % of natural raw materials procured with
proper documentation
 % of total income invested for tree plantation,
soil conservation, rainwater harvesting etc
 Total number of employees upon investment
 % of staff in training
 % of employees encouraged /assisted for higher
education and skill development
 % proportion of female employees in
management and executive positions
 % of employees who have same sex orientation
 % of staff of lower caste
 % of staff of minority religion
 % of staff who are ex-military persons
 % of staff who are ex-militants or ex-convicts who
joined mainstream of life
 % of employees from other provinces and from
underdeveloped provinces
 Average fluctuation and net change in
employment
 % Documented industrial accidents including
near miss and illness upon total employee
 Lost man days/absence due to injuries in
industrial accidents and work-related deaths
 Average hour of training per employee
 Total cost of personnel as % of income
 % of employees physically challenged
 % of employee participation ideas implemented
 % of largest 25 suppliers that fulfill social criteria
 % of part time employees
 Number of welfare projects
 % Expenditure on Employee Health and Safety
 % of income spent on training
 Average year of service of employees in
company
 Number of child labor engaged as % of staff
 Reported cases of child labor, forced or
involuntary labor as % of total staff
 Number of cases of harassment to opposite
gender as % of total staff
 % of time wage delayed
 Total number of grievance reported upon total
staff
Economic Sustainability Matrix Stakeholder
Affected
Positive
Direction
Return on Investment Owner ↑
% of expenditure on purchase of goods, services and
materials on Total income
Owner ↓
Equivalent monetary value of all benefit to staff on total
income
Society ↑
Interest on liabilities on total income Owner ↓
Change in retained income Owner ↑
Taxes paid to authorities on total income Society ↑
State subsidies and assistance received on total income Society ↓
% of income for Donations to communities, civil societies
and others in cash and in kind
Society ↑
% of income as Investment in R&D Environment /
Society
↑
% of income as investment on Capital Expenditure Owner / Society ↑
% of income as total spending for culture and society Society ↑
Appropriation of funds to shareholders (dividends), to
employees (wages, benefits), to the state (taxes, levies,
duties etc), to creditors (interest) and to the company
(reserves) in percentage of income
Owner / Society ↑
Environmental Sustainability Matrix Stakeholder Affected Positive
Direction
Energy consumption per unit currency of income Environment / Society ↓
Water consumption per unit currency of income Environment / Society ↓
Waste in unit per employee per year Environment ↓
Paper consumption per employee Environment ↓
Business travel expenses per unit currency of income Society ↓
Weight of material consumption per unit currency of income Environment ↓
% Waste recycling Environment ↑
% Acceptance of return of used products ↑
Fines, sanctions and penalties for non-compliance as % of total income Society ↑
Emission to water in ppm per unit currency of earning Environment ↓
Volume of waste water as % to total water consumed Environment ↓
CO2 emission in ppm Environment ↓
Dust Emission in ppm Environment ↓
% of income as total spending on environmental protection Environment ↑
Number of services identified with potential to contribute to sustainability Environment ↑
% of income as investment in energy efficient and non-polluting technology Environment ↑
% of natural raw materials procured with proper documentation Society / Environment ↑
% of total income invested for tree plantation, soil conservation, rainwater
harvesting etc
Environment ↑
Social Sustainability Matrix Stakeholder Affected Positive
Direction
Total number of employees upon investment Society ↑
% of employees encouraged /assisted for higher education and skill development Society / Shareholder ↑
% proportion of female employees in management and executive positions, Society ↑
% of employees who have same sex orientation, physically challenged, of lower caste,
of minority religion, staff who are ex-military persons, who are ex-militants or ex-
convicts who joined mainstream of life, from other provinces and underdeveloped
provinces
Society ↑
% Documented industrial accidents including near miss and illness upon total
employee
Society / Shareholder ↓
Lost man days/absence due to injuries in industrial accidents and work-related deaths Society / Shareholder ↓
Average hour of training per employee Society ↑
Total cost of personnel as % of income Society ↑
% of employee participation ideas implemented Society / Shareholder ↑
% of part time employees Society ↓
Number of welfare projects Society ↑
% Expenditure on Employee Health and Safety Society ↑
% of income spent on training Society / Shareholder ↑
Average year of service of employees in company Society ↑
Number of child labor engaged as % of staff Society ↓
Reported cases of child labor, forced or involuntary labor as % of total staff Society ↓
Number of cases of harassment to opposite gender as % of total staff Society ↓
% of time wage delayed Society ↓
Total number of grievance reported upon total staff Society ↓
Fund distribution and
statutory payment dynamics
Attitude for local and
responsible procurement
The benefit transfer culture
Attitude for social welfare
The desire to invest in eco-
friendly product dev.
Economic
Performance
Willingness to invest in suitable
infrastructure for employees,
investment for pollution control
and prevention
Acceptance and respect to
ideas and suggestions
Willingness to create a safe
working environment
Diversity and inclusiveness
Policy and Practice of
employment, training &
development and
encouragement for skill
development
Management of welfare
projects
Social
Performance
Bonding and trust within
stakeholders
Awareness for environment protection within
stakeholders
Transition towards environment friendly inputs,
process, waste reduction and recycling
Attitude to consume and produce within limit
The desire to invest in eco-friendly product
development
Environmental
Performance
The pattern of eco-investment within a period of time
Ad

More Related Content

Similar to Performance measurement using Balanced Scorecard (20)

Balanced scorecard
Balanced scorecardBalanced scorecard
Balanced scorecard
Jaswinder Singh
 
Balanced Score Card ppt
Balanced Score Card ppt Balanced Score Card ppt
Balanced Score Card ppt
sspatel232
 
Week 4 Internal Analysis.pptxfffffffffff
Week 4 Internal Analysis.pptxfffffffffffWeek 4 Internal Analysis.pptxfffffffffff
Week 4 Internal Analysis.pptxfffffffffff
muhammadhassanahmad3
 
notes2_management concepts & practices.pptx
notes2_management concepts & practices.pptxnotes2_management concepts & practices.pptx
notes2_management concepts & practices.pptx
DR. AASHISH MEHRA
 
Balanced Scorecard, A Comprehensive Guide
Balanced Scorecard, A Comprehensive Guide Balanced Scorecard, A Comprehensive Guide
Balanced Scorecard, A Comprehensive Guide
Upendra K
 
Marketing Busuness Art 2012
Marketing Busuness Art 2012Marketing Busuness Art 2012
Marketing Busuness Art 2012
Arif Mahmood
 
Balancedscorecardpresentation
BalancedscorecardpresentationBalancedscorecardpresentation
Balancedscorecardpresentation
Rizwan Ahmed
 
Leadwynn profile | Change Management services
Leadwynn profile | Change Management servicesLeadwynn profile | Change Management services
Leadwynn profile | Change Management services
Leadwynn
 
Balanced score card
Balanced score cardBalanced score card
Balanced score card
REVATHI PITCHAI
 
Getting The Best Out Of Your People - webinar
Getting The Best Out Of Your People - webinarGetting The Best Out Of Your People - webinar
Getting The Best Out Of Your People - webinar
G&A Partners
 
Balance scorecard
Balance scorecardBalance scorecard
Balance scorecard
Prashant Verma
 
Measuring Performance: Linking Money To Mission
Measuring Performance: Linking Money To MissionMeasuring Performance: Linking Money To Mission
Measuring Performance: Linking Money To Mission
4Good.org
 
Principles of Balanced Scorecard
Principles of Balanced ScorecardPrinciples of Balanced Scorecard
Principles of Balanced Scorecard
Erfan Moradian
 
Webinar: The Balanced Scorecard What Does It Mean And How To Implement It
Webinar: The Balanced Scorecard What Does It Mean And How To Implement ItWebinar: The Balanced Scorecard What Does It Mean And How To Implement It
Webinar: The Balanced Scorecard What Does It Mean And How To Implement It
Ali Zeeshan
 
Strategic intent
Strategic intentStrategic intent
Strategic intent
Jaswinder Singh
 
HR PREPAREDNESS- TO OPERATE GLOBALLY
HR PREPAREDNESS- TO OPERATE GLOBALLYHR PREPAREDNESS- TO OPERATE GLOBALLY
HR PREPAREDNESS- TO OPERATE GLOBALLY
Md. Shanjidul Bari
 
Constructing a Strategic Plan: Essential Processes and Components
Constructing a Strategic Plan: Essential Processes and ComponentsConstructing a Strategic Plan: Essential Processes and Components
Constructing a Strategic Plan: Essential Processes and Components
ksilk
 
Devloping a Balanced Scorecard
Devloping a Balanced ScorecardDevloping a Balanced Scorecard
Devloping a Balanced Scorecard
Iyanuoluwa Femi-Ola
 
Balanced scorecard
Balanced scorecardBalanced scorecard
Balanced scorecard
Sakthivel R
 
S15 Balanced Scorecards a method to evaluate achievements 180626.pdf
S15 Balanced Scorecards a method to evaluate achievements 180626.pdfS15 Balanced Scorecards a method to evaluate achievements 180626.pdf
S15 Balanced Scorecards a method to evaluate achievements 180626.pdf
Moustafa M Elsayed
 
Balanced Score Card ppt
Balanced Score Card ppt Balanced Score Card ppt
Balanced Score Card ppt
sspatel232
 
Week 4 Internal Analysis.pptxfffffffffff
Week 4 Internal Analysis.pptxfffffffffffWeek 4 Internal Analysis.pptxfffffffffff
Week 4 Internal Analysis.pptxfffffffffff
muhammadhassanahmad3
 
notes2_management concepts & practices.pptx
notes2_management concepts & practices.pptxnotes2_management concepts & practices.pptx
notes2_management concepts & practices.pptx
DR. AASHISH MEHRA
 
Balanced Scorecard, A Comprehensive Guide
Balanced Scorecard, A Comprehensive Guide Balanced Scorecard, A Comprehensive Guide
Balanced Scorecard, A Comprehensive Guide
Upendra K
 
Marketing Busuness Art 2012
Marketing Busuness Art 2012Marketing Busuness Art 2012
Marketing Busuness Art 2012
Arif Mahmood
 
Balancedscorecardpresentation
BalancedscorecardpresentationBalancedscorecardpresentation
Balancedscorecardpresentation
Rizwan Ahmed
 
Leadwynn profile | Change Management services
Leadwynn profile | Change Management servicesLeadwynn profile | Change Management services
Leadwynn profile | Change Management services
Leadwynn
 
Getting The Best Out Of Your People - webinar
Getting The Best Out Of Your People - webinarGetting The Best Out Of Your People - webinar
Getting The Best Out Of Your People - webinar
G&A Partners
 
Measuring Performance: Linking Money To Mission
Measuring Performance: Linking Money To MissionMeasuring Performance: Linking Money To Mission
Measuring Performance: Linking Money To Mission
4Good.org
 
Principles of Balanced Scorecard
Principles of Balanced ScorecardPrinciples of Balanced Scorecard
Principles of Balanced Scorecard
Erfan Moradian
 
Webinar: The Balanced Scorecard What Does It Mean And How To Implement It
Webinar: The Balanced Scorecard What Does It Mean And How To Implement ItWebinar: The Balanced Scorecard What Does It Mean And How To Implement It
Webinar: The Balanced Scorecard What Does It Mean And How To Implement It
Ali Zeeshan
 
HR PREPAREDNESS- TO OPERATE GLOBALLY
HR PREPAREDNESS- TO OPERATE GLOBALLYHR PREPAREDNESS- TO OPERATE GLOBALLY
HR PREPAREDNESS- TO OPERATE GLOBALLY
Md. Shanjidul Bari
 
Constructing a Strategic Plan: Essential Processes and Components
Constructing a Strategic Plan: Essential Processes and ComponentsConstructing a Strategic Plan: Essential Processes and Components
Constructing a Strategic Plan: Essential Processes and Components
ksilk
 
Balanced scorecard
Balanced scorecardBalanced scorecard
Balanced scorecard
Sakthivel R
 
S15 Balanced Scorecards a method to evaluate achievements 180626.pdf
S15 Balanced Scorecards a method to evaluate achievements 180626.pdfS15 Balanced Scorecards a method to evaluate achievements 180626.pdf
S15 Balanced Scorecards a method to evaluate achievements 180626.pdf
Moustafa M Elsayed
 

More from AsishPanda25 (8)

Operations Management Classroom Presentation
Operations Management Classroom PresentationOperations Management Classroom Presentation
Operations Management Classroom Presentation
AsishPanda25
 
Operations Management Slides Series for MBA students
Operations Management Slides Series for MBA studentsOperations Management Slides Series for MBA students
Operations Management Slides Series for MBA students
AsishPanda25
 
Practice Problems for End-Term Examination
Practice Problems for End-Term ExaminationPractice Problems for End-Term Examination
Practice Problems for End-Term Examination
AsishPanda25
 
Operations Management Practice Slides with solution
Operations Management Practice Slides with solutionOperations Management Practice Slides with solution
Operations Management Practice Slides with solution
AsishPanda25
 
Sony Vs Matsushita Case Analysis in classroom
Sony Vs Matsushita Case Analysis in classroomSony Vs Matsushita Case Analysis in classroom
Sony Vs Matsushita Case Analysis in classroom
AsishPanda25
 
Operations Management type of product and servicetx
Operations Management type of product and servicetxOperations Management type of product and servicetx
Operations Management type of product and servicetx
AsishPanda25
 
Operations Management 2024 Bridge Course Session 2 for freshers
Operations Management 2024 Bridge Course Session 2 for freshersOperations Management 2024 Bridge Course Session 2 for freshers
Operations Management 2024 Bridge Course Session 2 for freshers
AsishPanda25
 
Introduction to Operations Management for MBA students
Introduction to Operations Management for MBA studentsIntroduction to Operations Management for MBA students
Introduction to Operations Management for MBA students
AsishPanda25
 
Operations Management Classroom Presentation
Operations Management Classroom PresentationOperations Management Classroom Presentation
Operations Management Classroom Presentation
AsishPanda25
 
Operations Management Slides Series for MBA students
Operations Management Slides Series for MBA studentsOperations Management Slides Series for MBA students
Operations Management Slides Series for MBA students
AsishPanda25
 
Practice Problems for End-Term Examination
Practice Problems for End-Term ExaminationPractice Problems for End-Term Examination
Practice Problems for End-Term Examination
AsishPanda25
 
Operations Management Practice Slides with solution
Operations Management Practice Slides with solutionOperations Management Practice Slides with solution
Operations Management Practice Slides with solution
AsishPanda25
 
Sony Vs Matsushita Case Analysis in classroom
Sony Vs Matsushita Case Analysis in classroomSony Vs Matsushita Case Analysis in classroom
Sony Vs Matsushita Case Analysis in classroom
AsishPanda25
 
Operations Management type of product and servicetx
Operations Management type of product and servicetxOperations Management type of product and servicetx
Operations Management type of product and servicetx
AsishPanda25
 
Operations Management 2024 Bridge Course Session 2 for freshers
Operations Management 2024 Bridge Course Session 2 for freshersOperations Management 2024 Bridge Course Session 2 for freshers
Operations Management 2024 Bridge Course Session 2 for freshers
AsishPanda25
 
Introduction to Operations Management for MBA students
Introduction to Operations Management for MBA studentsIntroduction to Operations Management for MBA students
Introduction to Operations Management for MBA students
AsishPanda25
 
Ad

Recently uploaded (20)

Treis & Friends One sheet - Portfolio IV
Treis & Friends One sheet - Portfolio IVTreis & Friends One sheet - Portfolio IV
Treis & Friends One sheet - Portfolio IV
aparicioregina7
 
2_English_Vocabulary_In_Use_Pre-Intermediate_Cambridge_-_Fourth_Edition (1).pdf
2_English_Vocabulary_In_Use_Pre-Intermediate_Cambridge_-_Fourth_Edition (1).pdf2_English_Vocabulary_In_Use_Pre-Intermediate_Cambridge_-_Fourth_Edition (1).pdf
2_English_Vocabulary_In_Use_Pre-Intermediate_Cambridge_-_Fourth_Edition (1).pdf
ThiNgc22
 
Looking for Reliable BPO Project Providers?"
Looking for Reliable BPO Project Providers?"Looking for Reliable BPO Project Providers?"
Looking for Reliable BPO Project Providers?"
anujascentbpo
 
The Rise of Payroll Outsourcing in the UK: Key Statistics for 2025
The Rise of Payroll Outsourcing in the UK: Key Statistics for 2025The Rise of Payroll Outsourcing in the UK: Key Statistics for 2025
The Rise of Payroll Outsourcing in the UK: Key Statistics for 2025
QX Accounting Services Ltd
 
India Advertising Market Size & Growth | Industry Trends
India Advertising Market Size & Growth | Industry TrendsIndia Advertising Market Size & Growth | Industry Trends
India Advertising Market Size & Growth | Industry Trends
Aman Bansal
 
Influence of Career Development on Retention of Employees in Private Univers...
Influence of Career Development on Retention of  Employees in Private Univers...Influence of Career Development on Retention of  Employees in Private Univers...
Influence of Career Development on Retention of Employees in Private Univers...
publication11
 
AlaskaSilver Corporate Presentation Apr 28 2025.pdf
AlaskaSilver Corporate Presentation Apr 28 2025.pdfAlaskaSilver Corporate Presentation Apr 28 2025.pdf
AlaskaSilver Corporate Presentation Apr 28 2025.pdf
Western Alaska Minerals Corp.
 
NewBase 05 May 2025 Energy News issue - 1785 by Khaled Al Awadi_compressed.pdf
NewBase 05 May 2025  Energy News issue - 1785 by Khaled Al Awadi_compressed.pdfNewBase 05 May 2025  Energy News issue - 1785 by Khaled Al Awadi_compressed.pdf
NewBase 05 May 2025 Energy News issue - 1785 by Khaled Al Awadi_compressed.pdf
Khaled Al Awadi
 
From Sunlight to Savings The Rise of Homegrown Solar Power.pdf
From Sunlight to Savings The Rise of Homegrown Solar Power.pdfFrom Sunlight to Savings The Rise of Homegrown Solar Power.pdf
From Sunlight to Savings The Rise of Homegrown Solar Power.pdf
Insolation Energy
 
Comments on Cloud Stream Part II Mobile Hub V1 Hub Agency.pdf
Comments on Cloud Stream Part II Mobile Hub V1 Hub Agency.pdfComments on Cloud Stream Part II Mobile Hub V1 Hub Agency.pdf
Comments on Cloud Stream Part II Mobile Hub V1 Hub Agency.pdf
Brij Consulting, LLC
 
Affinity.co Lifecycle Marketing Presentation
Affinity.co Lifecycle Marketing PresentationAffinity.co Lifecycle Marketing Presentation
Affinity.co Lifecycle Marketing Presentation
omiller199514
 
Disinformation in Society Report 2025 Key Findings
Disinformation in Society Report 2025 Key FindingsDisinformation in Society Report 2025 Key Findings
Disinformation in Society Report 2025 Key Findings
MariumAbdulhussein
 
intra-mart Accel series 2025 Spring updates-en.ppt
intra-mart Accel series 2025 Spring updates-en.pptintra-mart Accel series 2025 Spring updates-en.ppt
intra-mart Accel series 2025 Spring updates-en.ppt
NTTDATA INTRAMART
 
The Peter Cowley Entrepreneurship Event Master 30th.pdf
The Peter Cowley Entrepreneurship Event Master 30th.pdfThe Peter Cowley Entrepreneurship Event Master 30th.pdf
The Peter Cowley Entrepreneurship Event Master 30th.pdf
Richard Lucas
 
Level Up Your Launch: Utilizing AI for Start-up Success
Level Up Your Launch: Utilizing AI for Start-up SuccessLevel Up Your Launch: Utilizing AI for Start-up Success
Level Up Your Launch: Utilizing AI for Start-up Success
Best Virtual Specialist
 
Accounting_Basics_Complete_Guide_By_CA_Suvidha_Chaplot (1).pdf
Accounting_Basics_Complete_Guide_By_CA_Suvidha_Chaplot (1).pdfAccounting_Basics_Complete_Guide_By_CA_Suvidha_Chaplot (1).pdf
Accounting_Basics_Complete_Guide_By_CA_Suvidha_Chaplot (1).pdf
CA Suvidha Chaplot
 
Avoiding the China Tariffs: Save Costs & Stay Competitive
Avoiding the China Tariffs: Save Costs & Stay CompetitiveAvoiding the China Tariffs: Save Costs & Stay Competitive
Avoiding the China Tariffs: Save Costs & Stay Competitive
NovaLink
 
Freeze-Dried Fruit Powder Market Trends & Growth
Freeze-Dried Fruit Powder Market Trends & GrowthFreeze-Dried Fruit Powder Market Trends & Growth
Freeze-Dried Fruit Powder Market Trends & Growth
chanderdeepseoexpert
 
waterBeta white paper - 250202- two-column.docx
waterBeta white paper - 250202- two-column.docxwaterBeta white paper - 250202- two-column.docx
waterBeta white paper - 250202- two-column.docx
Peter Adriaens
 
Top 5 Mistakes to Avoid When Writing a Job Application
Top 5 Mistakes to Avoid When Writing a Job ApplicationTop 5 Mistakes to Avoid When Writing a Job Application
Top 5 Mistakes to Avoid When Writing a Job Application
Red Tape Busters
 
Treis & Friends One sheet - Portfolio IV
Treis & Friends One sheet - Portfolio IVTreis & Friends One sheet - Portfolio IV
Treis & Friends One sheet - Portfolio IV
aparicioregina7
 
2_English_Vocabulary_In_Use_Pre-Intermediate_Cambridge_-_Fourth_Edition (1).pdf
2_English_Vocabulary_In_Use_Pre-Intermediate_Cambridge_-_Fourth_Edition (1).pdf2_English_Vocabulary_In_Use_Pre-Intermediate_Cambridge_-_Fourth_Edition (1).pdf
2_English_Vocabulary_In_Use_Pre-Intermediate_Cambridge_-_Fourth_Edition (1).pdf
ThiNgc22
 
Looking for Reliable BPO Project Providers?"
Looking for Reliable BPO Project Providers?"Looking for Reliable BPO Project Providers?"
Looking for Reliable BPO Project Providers?"
anujascentbpo
 
The Rise of Payroll Outsourcing in the UK: Key Statistics for 2025
The Rise of Payroll Outsourcing in the UK: Key Statistics for 2025The Rise of Payroll Outsourcing in the UK: Key Statistics for 2025
The Rise of Payroll Outsourcing in the UK: Key Statistics for 2025
QX Accounting Services Ltd
 
India Advertising Market Size & Growth | Industry Trends
India Advertising Market Size & Growth | Industry TrendsIndia Advertising Market Size & Growth | Industry Trends
India Advertising Market Size & Growth | Industry Trends
Aman Bansal
 
Influence of Career Development on Retention of Employees in Private Univers...
Influence of Career Development on Retention of  Employees in Private Univers...Influence of Career Development on Retention of  Employees in Private Univers...
Influence of Career Development on Retention of Employees in Private Univers...
publication11
 
NewBase 05 May 2025 Energy News issue - 1785 by Khaled Al Awadi_compressed.pdf
NewBase 05 May 2025  Energy News issue - 1785 by Khaled Al Awadi_compressed.pdfNewBase 05 May 2025  Energy News issue - 1785 by Khaled Al Awadi_compressed.pdf
NewBase 05 May 2025 Energy News issue - 1785 by Khaled Al Awadi_compressed.pdf
Khaled Al Awadi
 
From Sunlight to Savings The Rise of Homegrown Solar Power.pdf
From Sunlight to Savings The Rise of Homegrown Solar Power.pdfFrom Sunlight to Savings The Rise of Homegrown Solar Power.pdf
From Sunlight to Savings The Rise of Homegrown Solar Power.pdf
Insolation Energy
 
Comments on Cloud Stream Part II Mobile Hub V1 Hub Agency.pdf
Comments on Cloud Stream Part II Mobile Hub V1 Hub Agency.pdfComments on Cloud Stream Part II Mobile Hub V1 Hub Agency.pdf
Comments on Cloud Stream Part II Mobile Hub V1 Hub Agency.pdf
Brij Consulting, LLC
 
Affinity.co Lifecycle Marketing Presentation
Affinity.co Lifecycle Marketing PresentationAffinity.co Lifecycle Marketing Presentation
Affinity.co Lifecycle Marketing Presentation
omiller199514
 
Disinformation in Society Report 2025 Key Findings
Disinformation in Society Report 2025 Key FindingsDisinformation in Society Report 2025 Key Findings
Disinformation in Society Report 2025 Key Findings
MariumAbdulhussein
 
intra-mart Accel series 2025 Spring updates-en.ppt
intra-mart Accel series 2025 Spring updates-en.pptintra-mart Accel series 2025 Spring updates-en.ppt
intra-mart Accel series 2025 Spring updates-en.ppt
NTTDATA INTRAMART
 
The Peter Cowley Entrepreneurship Event Master 30th.pdf
The Peter Cowley Entrepreneurship Event Master 30th.pdfThe Peter Cowley Entrepreneurship Event Master 30th.pdf
The Peter Cowley Entrepreneurship Event Master 30th.pdf
Richard Lucas
 
Level Up Your Launch: Utilizing AI for Start-up Success
Level Up Your Launch: Utilizing AI for Start-up SuccessLevel Up Your Launch: Utilizing AI for Start-up Success
Level Up Your Launch: Utilizing AI for Start-up Success
Best Virtual Specialist
 
Accounting_Basics_Complete_Guide_By_CA_Suvidha_Chaplot (1).pdf
Accounting_Basics_Complete_Guide_By_CA_Suvidha_Chaplot (1).pdfAccounting_Basics_Complete_Guide_By_CA_Suvidha_Chaplot (1).pdf
Accounting_Basics_Complete_Guide_By_CA_Suvidha_Chaplot (1).pdf
CA Suvidha Chaplot
 
Avoiding the China Tariffs: Save Costs & Stay Competitive
Avoiding the China Tariffs: Save Costs & Stay CompetitiveAvoiding the China Tariffs: Save Costs & Stay Competitive
Avoiding the China Tariffs: Save Costs & Stay Competitive
NovaLink
 
Freeze-Dried Fruit Powder Market Trends & Growth
Freeze-Dried Fruit Powder Market Trends & GrowthFreeze-Dried Fruit Powder Market Trends & Growth
Freeze-Dried Fruit Powder Market Trends & Growth
chanderdeepseoexpert
 
waterBeta white paper - 250202- two-column.docx
waterBeta white paper - 250202- two-column.docxwaterBeta white paper - 250202- two-column.docx
waterBeta white paper - 250202- two-column.docx
Peter Adriaens
 
Top 5 Mistakes to Avoid When Writing a Job Application
Top 5 Mistakes to Avoid When Writing a Job ApplicationTop 5 Mistakes to Avoid When Writing a Job Application
Top 5 Mistakes to Avoid When Writing a Job Application
Red Tape Busters
 
Ad

Performance measurement using Balanced Scorecard

  • 1. The Balanced Scorecard Approach MBA-I , DMS, NALSAR
  • 2. What is a Balanced Scorecard? The Balanced Scorecard is a strategic planning and management system used to align business activities to the vision and strategy of the organization by monitoring performance against strategic goals.
  • 3. Balanced Scorecard Concept • Was first published in 1992 by Kaplan and Norton, a book followed in 1996. • Traditional performance measurement that only focus on external accounting data are obsolete. • The approach is to provide 'balance' to the financial perspective.
  • 4. The Balanced Scorecard: A Good Idea in 1992 “The Balanced Scorecard – Measures that Drive Performance” Harvard Business Review, 1992 Balanced Scorecard in 1992
  • 5. The Balanced Scorecard: A Great Idea by 2002 50% usage in Fortune 500 Harvard Business Review “Hall of Fame” 50,000+ BSC on-line members Balanced Scorecard by 2002 21 translations 17 translations
  • 6. Balanced Scorecard Hall of Fame Implemented Strategies and Achieved Breakthrough Results… Fast Saatchi & Saatchi + $2b ATT Canada + $7b Chemical Bank • 99% Merged Target Asset Retention UPS Southern Garden Wells Fargo Cigna + $3b Brown & Root • #1 in growth & profitability City of Charlotte Duke Children’s Mobil • Last to first • Cash flow +$1.2b • ROI 6% --> 16% Hilton Hotels • Least Cost Producer 3 years • Customer Satisfaction • Market Revenue Index • Revenues 9% • Net Income 33% • # Customers 450% • Best Online Bank • Customer Satisfaction = 70% • Public Official Award • Customer Satisfaction #1 • Cost/Case 33% 3 years 2-5 years 3 years 3-5 years 3 years 3 years 2 years 3 years 3 years 2-5 years 2 years
  • 7. © 1998 Renaissance Worldwide, Inc. and Robert S. Kaplan, All rights reserved. STRATEGY HUMAN RESOURCES BUSINESS UNITS EXECUTIVE TEAM INFORMATION TECHNOLOGY BUDGETS AND CAPITAL INVESTMENTS The Balanced Scorecard process allows an organization to align and focus all its resources on its strategy Question: How can complex organizations achieve results like this in such short periods of time? Answer: Alignment!
  • 8. A Gap Exists Between Mission-Vision-Strategy and Employees’ Everyday Actions MISSION Why we exist VALUES What’s important to us VISION What we want to be STRATEGY Our game plan EMPOWERMENT / PERSONAL OBJECTIVES What I need to do TOTAL QUALITY MANAGEMENT What we must improve
  • 9. The Balanced Scorecard Links Vision and Strategy to Employees’ Everyday Actions BALANCED SCORECARD Translate, Focus and Align STRATEGIC INITIATIVES What are the priorities MISSION Why we exist VALUES What’s important to us VISION What we want to be STRATEGY Our game plan STRATEGIC OUTCOMES Satisfied SHAREHOLDERS Delighted CUSTOMERS Efficient and Effective PROCESSES Motivated & Prepared WORKFORCE EMPOWERMENT / PERSONAL OBJECTIVES What I need to do TOTAL QUALITY MANAGEMENT What we must improve
  • 10. Why Use a Balanced Scorecard? • Improve organizational performance by measuring what matters • Increase focus on strategy and results • Align organization strategy with workers on a day-to- day basis • Focus on the drivers key to future performance • Improve communication of the organization’s Vision and Strategy • Prioritize Projects / Initiatives
  • 11. Balanced Scorecard • Balance betwen – Financial measures of performance – Long-range competitive abilities
  • 12. Balanced Scorecard • Four aspects of firm performance – Financial – Customer – Internal business – Innovation and learning
  • 13. Financial Perspective • How do we look to stockholders? – Survive – Succeed – Prosper
  • 14. Customer Perspective • How do our customers see us? – New products – Responsiveness – Quality
  • 15. Internal Business Perspective • At what must we excel currently? – Manufacturing/service excellence – New product/service introduction
  • 16. Innovation and Learning Perspective • Can we continue to improve and create value? – Technological leadership – Time to market – Employee training and satisfaction
  • 17. Perspectives are Interrelated • Innovation pleases customers which are necessary for good financial results • Good financial results make financing improvements possible
  • 18. Overall Concepts • Not just a set of measures – Measures must relate to strategy • Critical success factors – Measures are interrelated • Must understand how the perspectives influence each other
  • 19. Overall Concepts • Not a quick process – Implementation requires • Thought • Analysis • Data-gathering • Time
  • 20. Overall Concepts • Thought – What is our strategy? – What is critical to implementing the strategy? – How can we measure our progress?
  • 21. Overall Concepts • Analysis – What are the linkages between functions? – What drives the achievement of goals? – What measures correlate with the drivers?
  • 22. Overall Concepts • Data-gathering – What data is available? What isn’t? – How should it be gathered? Reported?
  • 23. Overall Concepts • Time – Cannot be done in an afternoon – Successful implementation may take several months – Never-ending process
  • 24. 4 Original Business Perspectives Adapted from The Balanced Scorecard by Kaplan & Norton  The Balanced Scorecard model suggests that we view the organization from 4 perspectives.  Then Develop metrics, collect data and analyze it relative to each of these perspectives
  • 25. 4 Business Perspectives Questions • Financial – What must we do to create sustainable economic value? • Internal Business Process – To satisfy our stakeholders, what must be our levels of productivity, efficiency, and quality? • Learning and Growth – How does our employee performance management system, including feedback to employees, support high performance? • Customer – What do our customers require from us and how are we doing according to those requirements?
  • 27. Key Implementation Success Factors • Obtaining executive sponsorship and commitment • Involving a broad base of leaders, managers and employees in scorecard development • Choose the right Scorecard Champion • Beginning interactive (two-way) communication first • Viewing the scorecard as a long-term journey rather than a short-term project • Getting outside help if needed
  • 28. Balanced Scorecard Example STRATEGY MAP BALANCED SCORECARD MEASUREMENT PROCESS: MANUFACTURING EXCELLENCE THEME: ROCE > xx%, VOLUME = xx,xxx units OBJECTIVES TARGET ACTION PLAN INITIATIVE BUDGET FINANCIAL PERSPECTIVE Improve Productivity OFFER PRODUCTS & SERVCIES THAT ARE CONSISTENT, TIMELY and LOW-COST Long-Term Shareholder Value ROCE > xx% Grow Revenue CUSTOMER PERSPECTIVE •Operating Cost & Efficiency •Capacity Utilization •Capability Utilization •Brand / Image • Cost/Unit, Efficiency •% Utilization • Monthly Monitoring • Weekly/Monthly Monitoring • Monthly Monitoring • Weekly/Monthly Monitoring •Low Cost Manufacturing •World-Class Quality Standards •World-Class Delivery Timing •Knowledgeable & Skilled Partner •High Customer Satisfaction •Reinforce Brand Image • Man-hour per Unit • Defect per Unit • Sales Delivery • Direct Pass Rate • Market Feedback • Sales Volume • Weekly Monitoring • Daily Monitoring • Daily Monitoring • Daily Monitoring • Weekly Monitoring • Monthly Monitoring Prod. & Sales Mtg. Low Cost World Class ENSURE OPERATIONAL EXCELLENCE WITH INNOVATION AS WELL BEING SOCIALLY RESPONSIBLE INTERNAL PERSPECTIVE Customer Satisfaction Enhance Brand Operational Excellence Process Innovation Alliances with SBUs Socially Responsible •Productivity •Delivery •Continuous Improvement •NPI •Safety & Health •Environment • Cycle Time • Meet Daily Plan • WIP • KAIZEN • ICC • Timely Introduction • Industrial Accident • Commuting Accident • Toxic Waste Disposal • ISO 9002 • Hourly Monitoring • Daily Monitoring • Daily Monitoring • Monthly follow-up • Specific Programmed • Weekly Follow-up • Cross Audits • Defensive Driving • Facility Readiness • Certification STRATEGIC JOB & SYSTEMS LEARNING & GROWTH PERSPECTIVE Skills Info. System •Develop the Necessary Skills •Information Systems Availability •Strategic Awareness • R&D & Development • ALC, Procurement, Financial • Alignment • Training and Skill Build-up • Set-up, Test and Validation • Communication Programmed • Trial Prod. • Spare Parts Prod •Warranty Cost t OPEX Rs. XX M CAPEX Rs. xx M
  • 30. The Road to Disaster • Senior management not committed – No one else will be either • Lack of consensus – Lack of commitment
  • 31. The Road to Disaster • Consultants – Good • Provide needed expertise – Bad • Take over the project • Consensus, commitment of employees is lost
  • 32. The Road to Disaster • Failure to communicate – Employees don’t understand: • Strategy • Their roles • Importance of the scorecard measures
  • 33. The Road to Disaster • Carve it in stone – It won’t be perfect, ever • Must evolve – Delay implementation until perfect • See above
  • 34. The Scorecard as a Change Agent • Four steps – Translating the vision into action – Communicating and linking – Business planning – Feedback and learning
  • 35. Translating the Vision • Strategy must be reduced to a set of objectives and measures which can be operationalized – “We want to be the best” won’t do
  • 36. Communicating and Linking • Corporate strategy must be communicated to all levels – Lower levels must have objectives linked to corporate objectives
  • 37. Business Planning • Integrate the financial plan with the business plan – Use the scorecard to allocate resources to critical activities • Avoids the short-term spending mentality
  • 38. Feedback and Learning • Monitor short-term results to determine if progress is being made toward long-term objectives – May need to refine measures, activities, objectives, even strategy
  • 39. The Principles of a Strategy-Focused Organization TRANSLATE STRATEGY CONTINUAL PROCESS ORGANIZATION ALIGNMENT EVERYONE’S JOB EXECUTIVE LEADERSHIP • CEO Sponsorship • Executive Team Engaged • “New Way of Managing” • Accountable for Strategy • A Performance Culture • Mission / Vision • Strategy Maps • Balanced Scorecard • Targets • Initiatives • Linked to Budgeting • Linked to Ops. Mgmt. • Management Meetings • Feedback System • Learning Process • Corporate Role • Corporate - SBU • SBU - Shared Services • External Partners • Strategic Awareness • Goal Alignment • Linked Incentives BALANCED SCORECARD
  • 42. • World’s most widely used standards for sustainability reporting • Independent body • Works closely with UNEP
  • 43. Economic • Direct economic value generated and distributed, including revenues, operating costs, employee compensation, donations and other community investments, retained earnings, and payments to capital providers and governments. • Financial implications and other risks and opportunities for the organization’s activities due to climate change. • Coverage of the organization’s defined benefit plan obligations • Significant financial assistance received from government • Policy, practices, and proportion of spending on locally-based suppliers at significant locations of operation • Procedures for local hiring and proportion of senior management hired from the local community at locations of significant operation • Development and impact of infrastructure investments and services provided primarily for public benefit through commercial, in kind, or pro bono engagement
  • 44. Environmental • Materials used by weight or volume. • Percentage of materials used that are recycled input materials. • Direct energy consumption by primary energy source. • Indirect energy consumption by primary source • Total water withdrawal by source. • Total direct and indirect greenhouse gas emissions by weight. • NO, SO, and other significant air emissions by type and weight • Total water discharge by quality and destination • Total weight of waste by type and disposal method • Total number and volume of significant spills • Initiatives to mitigate environmental impacts of products and services, and extent of impact mitigation. • Percentage of products sold and their packaging materials that are reclaimed by category • Monetary value of significant fines and total number of non-monetary sanctions for noncompliance with environmental laws and regulations
  • 45. Labor Practices & Decent Work • Employment – Total workforce by employment type, employment contract, and region, broken down by gender – …… • Labor Management relation • Occupational Health & Safety • Training & Education • Diversity & Equal Opportunity • Equal Remuneration for Women & Men
  • 46. Human Rights • Investment & procurement practices • Non-discrimination • Freedom of association & collective bargaining • Child labor • Forced and compulsory labor • Security practices • Indigenous rights • Assessment & Remediation
  • 47. Society • Local community – Percentage of operations with implemented local community engagement, impact assessments, and development programs – Operations with significant potential or actual negative impacts on local communities • Corruption • Public policy • Anti-competitive behavior • Compliance
  • 48. Product Responsibility • Customer Health & Safety • Product & service labeling • Marketing communication • Customer privacy • Compliance
  • 50. • Economic Dimensions – Corporate Governance – Risk and Crisis Management – Codes of Conduct/Compliance/Anti-Corruption & Bribery – Industry Specific Criteria • Environmental Dimensions – Environmental Reporting – Industry Specific Criteria • Social Dimension – Human Capital Development – Talent attraction and retention – Labour practice indicators – Corporate citizenship / Philanthrophy – Social Reporting – Industry specific criteria
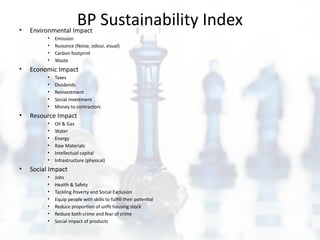
  • 51. BP Sustainability Index • Environmental Impact • Emission • Nuisance (Noise, odour, visual) • Carbon footprint • Waste • Economic Impact • Taxes • Dividends • Reinvestment • Social investment • Money to contractors • Resource Impact • Oil & Gas • Water • Energy • Raw Materials • Intellectual capital • Infrastructure (physical) • Social Impact • Jobs • Health & Safety • Tackling Poverty and Social Exclusion • Equip people with skills to fulfill their potential • Reduce proportion of unfit housing stock • Reduce both crime and fear of crime • Social impact of products
  • 52. Scholarly developments • Ranganathan, 1998 – Socio-economic, socio-environmental and environmental-economic • Parris & Kates 2003 – Sustainability of Nature (Earth, Biodiversity, Ecosystems) through development of People (Child survival, Life Expectancy, Education, Equity) – Sustainability of Life Support (Ecosystem services, Resources, Environment) through development of Economy (Wealth, Productive Sectors, Consumption) – Sustainability of Community (Cultures, Groups, Places) through development of Society (institutions, Social Capital, States, Regions) • Hubbard, 2006 : Beyond Triple Bottom Line • Szekely and Knirsch, 2005
  • 53. Economic Sustainability Matrix Environmental Sustainability Matrix Social Sustainability Matrix  Total Income  Earning before tax  Net Income  Earnings per share  Total expenditure on purchase of goods, services and materials  Equivalent monetary value of all benefit to staff  Interest on liabilities and dividends  Change in retained income  Taxes paid to authorities  State subsidies and assistance  Donations to communities, civil societies and others in cash and in kind  Investment in R&D  Capital Expenditure  Cash Flow  Expenditure on Employee Health and Safety  Total spending for culture and society  Total cost of personnel  Return on capital after tax  Appropriation of funds to shareholders (dividends), to employees (wages, benefits), to the state (taxes, levies, duties etc), to creditors (interest) and to the company (reserves)  % of employees in Environment Management  Energy consumption  Water consumption  Emission of greenhouse gases  Waste per employee per year  Paper consumption  Business travel  Total material consumption  Waste recycling  Acceptance of return of used products  Fines, sanctions and penalties for non-compliance  Emission to water  Volume of waste water  Total spending on environmental protection  CO2 emission  Number of services identified with potential to contribute to sustainability  Dust Emission  Total number of employees  Staff in Training  Average participation of employees in education measures  % proportion of female employees in management and executive positions  Average fluctuation and net change in employment  Practice of documentation of industrial accidents and illness  Lost days/absence due to injuries in industrial accidents and work-related deaths  Average hour of training / further training per employee  Number of trainees  Cost of personnel  Disabled employees  Idea management and employee participation programs  Percentage of largest 25 suppliers that fulfill social criteria  % of part time employees  Number of employee projects  Expenditure on training  Average year of service of employees in company
  • 54. Is mere reporting enough?
  • 55. Economic Sustainability Matrix Environmental Sustainability Matrix Social Sustainability Matrix  Return on Investment  Earnings per share  % of expenditure on purchase of goods, services and materials on Total income  Equivalent monetary value of all benefit to staff on total income  Interest on liabilities on total income  Change in retained income  Taxes paid to authorities on total income  State subsidies and assistance received on total income  % of income for Donations to communities, civil societies and others in cash and in kind  % of income as Investment in R&D  % of income as investment on Capital Expenditure  % of income as total spending for culture and society  Appropriation of funds to shareholders (dividends), to employees (wages, benefits), to the state (taxes, levies, duties etc), to creditors (interest) and to the company (reserves) in percentage of income  % of employees in Environment Management  Energy consumption per unit currency of income  Water consumption per unit currency of income  Emission of greenhouse gases in ppm  Waste per employee per year  Paper consumption per employee  Business travel expenses per unit currency of income  Weight of material consumption per unit currency of income  % Waste recycling  % Acceptance of return of used products  Fines, sanctions and penalties for non- compliance as % of total income  Emission to water in ppm per unit currency of earning  Volume of waste water as % to total water consumed  % of income as total spending on environmental protection  CO2 emission in ppm  Dust Emission in ppm  Number of services identified with potential to contribute to sustainability  % of income as investment in energy efficient and non-polluting technology  % of natural raw materials procured with proper documentation  % of total income invested for tree plantation, soil conservation, rainwater harvesting etc  Total number of employees upon investment  % of staff in training  % of employees encouraged /assisted for higher education and skill development  % proportion of female employees in management and executive positions  % of employees who have same sex orientation  % of staff of lower caste  % of staff of minority religion  % of staff who are ex-military persons  % of staff who are ex-militants or ex-convicts who joined mainstream of life  % of employees from other provinces and from underdeveloped provinces  Average fluctuation and net change in employment  % Documented industrial accidents including near miss and illness upon total employee  Lost man days/absence due to injuries in industrial accidents and work-related deaths  Average hour of training per employee  Total cost of personnel as % of income  % of employees physically challenged  % of employee participation ideas implemented  % of largest 25 suppliers that fulfill social criteria  % of part time employees  Number of welfare projects  % Expenditure on Employee Health and Safety  % of income spent on training  Average year of service of employees in company  Number of child labor engaged as % of staff  Reported cases of child labor, forced or involuntary labor as % of total staff  Number of cases of harassment to opposite gender as % of total staff  % of time wage delayed  Total number of grievance reported upon total staff
  • 56. Economic Sustainability Matrix Stakeholder Affected Positive Direction Return on Investment Owner ↑ % of expenditure on purchase of goods, services and materials on Total income Owner ↓ Equivalent monetary value of all benefit to staff on total income Society ↑ Interest on liabilities on total income Owner ↓ Change in retained income Owner ↑ Taxes paid to authorities on total income Society ↑ State subsidies and assistance received on total income Society ↓ % of income for Donations to communities, civil societies and others in cash and in kind Society ↑ % of income as Investment in R&D Environment / Society ↑ % of income as investment on Capital Expenditure Owner / Society ↑ % of income as total spending for culture and society Society ↑ Appropriation of funds to shareholders (dividends), to employees (wages, benefits), to the state (taxes, levies, duties etc), to creditors (interest) and to the company (reserves) in percentage of income Owner / Society ↑
  • 57. Environmental Sustainability Matrix Stakeholder Affected Positive Direction Energy consumption per unit currency of income Environment / Society ↓ Water consumption per unit currency of income Environment / Society ↓ Waste in unit per employee per year Environment ↓ Paper consumption per employee Environment ↓ Business travel expenses per unit currency of income Society ↓ Weight of material consumption per unit currency of income Environment ↓ % Waste recycling Environment ↑ % Acceptance of return of used products ↑ Fines, sanctions and penalties for non-compliance as % of total income Society ↑ Emission to water in ppm per unit currency of earning Environment ↓ Volume of waste water as % to total water consumed Environment ↓ CO2 emission in ppm Environment ↓ Dust Emission in ppm Environment ↓ % of income as total spending on environmental protection Environment ↑ Number of services identified with potential to contribute to sustainability Environment ↑ % of income as investment in energy efficient and non-polluting technology Environment ↑ % of natural raw materials procured with proper documentation Society / Environment ↑ % of total income invested for tree plantation, soil conservation, rainwater harvesting etc Environment ↑
  • 58. Social Sustainability Matrix Stakeholder Affected Positive Direction Total number of employees upon investment Society ↑ % of employees encouraged /assisted for higher education and skill development Society / Shareholder ↑ % proportion of female employees in management and executive positions, Society ↑ % of employees who have same sex orientation, physically challenged, of lower caste, of minority religion, staff who are ex-military persons, who are ex-militants or ex- convicts who joined mainstream of life, from other provinces and underdeveloped provinces Society ↑ % Documented industrial accidents including near miss and illness upon total employee Society / Shareholder ↓ Lost man days/absence due to injuries in industrial accidents and work-related deaths Society / Shareholder ↓ Average hour of training per employee Society ↑ Total cost of personnel as % of income Society ↑ % of employee participation ideas implemented Society / Shareholder ↑ % of part time employees Society ↓ Number of welfare projects Society ↑ % Expenditure on Employee Health and Safety Society ↑ % of income spent on training Society / Shareholder ↑ Average year of service of employees in company Society ↑ Number of child labor engaged as % of staff Society ↓ Reported cases of child labor, forced or involuntary labor as % of total staff Society ↓ Number of cases of harassment to opposite gender as % of total staff Society ↓ % of time wage delayed Society ↓ Total number of grievance reported upon total staff Society ↓
  • 59. Fund distribution and statutory payment dynamics Attitude for local and responsible procurement The benefit transfer culture Attitude for social welfare The desire to invest in eco- friendly product dev. Economic Performance Willingness to invest in suitable infrastructure for employees, investment for pollution control and prevention
  • 60. Acceptance and respect to ideas and suggestions Willingness to create a safe working environment Diversity and inclusiveness Policy and Practice of employment, training & development and encouragement for skill development Management of welfare projects Social Performance Bonding and trust within stakeholders
  • 61. Awareness for environment protection within stakeholders Transition towards environment friendly inputs, process, waste reduction and recycling Attitude to consume and produce within limit The desire to invest in eco-friendly product development Environmental Performance The pattern of eco-investment within a period of time