SlideShare a Scribd company logo
Copyright © 2016, Creative Arts & Technologies and others. All rights reserved.
Performance Monitoring
for the Cloud
Werner Keil
JSR 363 Maintenance Lead
@wernerkeil
October 18, 2017
© 2017 Creative Arts & Technologies and others. All rights reserved.#Monitoring #Performance
Agenda
1. Introduction
2. Performance Co-Pilot
3. Dropwizard Metrics
4. MicroProfile Metrics
5. Prometheus
6. StatsD
7. Demo
© 2017 Creative Arts & Technologies and others. All rights reserved.#Monitoring #Performance
Who am I?
Werner Keil
• Consultant – Coach
• Creative Cosmopolitan
• Open Source Evangelist
• Software Architect
• Spec Lead – JSR363
• Individual JCP Executive Committee Member
[www.linkedin.com/in/catmedia]
Twitter @wernerkeil
© 2017 Creative Arts & Technologies and others. All rights reserved.#Monitoring #Performance
What is Monitoring?
Monitoring applications is observing, analyzing and
manipulating the execution of these applications, which gives
information about threads, CPU usage, memory usage, as well
as other information like methods and classes being used.
A particular case is the monitoring of distributed
applications, aka the Cloud where an the performance
analysis of nodes and communication between them pose
additional challenges.
© 2017 Creative Arts & Technologies and others. All rights reserved.#Monitoring #Performance
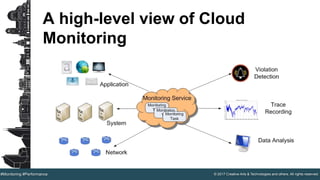
A high-level view of Cloud
Monitoring
© 2017 Creative Arts & Technologies and others. All rights reserved.#Monitoring #Performance
Challenges at System Level
• Efficient Scalability
– Supporting tens of thousands of monitoring tasks
– Cost effective: minimize resource usage
• Monitoring QoS
– Multi-tenancy environment
– Minimize resource contention between monitoring tasks
• Implication of Multi-Tenancy
– Monitoring tasks: adding, removing
– Resource contention between monitoring tasks
© 2017 Creative Arts & Technologies and others. All rights reserved.#Monitoring #Performance
Performance vs Number of Hosts
Number of hosts Performance (values per second)
100 100
1000 1000
10000 10000
60 items per host, update frequency once per minute
Number of hosts Performance (values per second)
100 1000
1000 10000
10000 100000
600 items per host, update frequency once per minute
© 2017 Creative Arts & Technologies and others. All rights reserved.#Monitoring #Performance
Monitoring Tips
• Regularly apply “Little’s Law” to all data... generic
(queueing theory) form:
Q = λ R
• Length = Arrival Rate x Response Time
– e.g. 10 MB = 2 MB/sec x 5 sec
• Utilization = Arrival Rate x Service Time
– e.g. 20% = 0.2 = 100 msec/sec x 2 sec
© 2017 Creative Arts & Technologies and others. All rights reserved.#Monitoring #Performance
Types of Monitoring
Monitoring Logs
• Logstash
• Redis
• Elasticsearch
• Kibana Dashboard
Monitoring Performance
• Collectd
• Statsd
• PCP
• Graphite
• Database (eg: PSQL)
• Grafana Dashboard
© 2017 Creative Arts & Technologies and others. All rights reserved.#Monitoring #Performance
Monitoring Logs – Kibana
Dashboard
© 2017 Creative Arts & Technologies and others. All rights reserved.#Monitoring #Performance
Monitoring Performance
How is this traditionally done?
• rsyslog/syslog-ng/journald
• top/iostat/vmstat/ps
• Mixture of scripting languages (bash/perl/python)
• Specific tools vary per platform
• Proper analysis requires more context
© 2017 Creative Arts & Technologies and others. All rights reserved.#Monitoring #Performance
Performance Co-Pilot
PCP
http://www.pcp.io
GitHub
https://github.com/performancecopilot
© 2017 Creative Arts & Technologies and others. All rights reserved.#Monitoring #Performance
What is PCP?
• Open source toolkit
• System-level analysis
• Live and historical
• Extensible (monitors, collectors)
• Distributed
• Unix-like component design
• Cross platform
• Ubiquitous units of measurement
© 2017 Creative Arts & Technologies and others. All rights reserved.#Monitoring #Performance
PCP Basics
Agents and Daemons
At the core we have two basic
components:
1. Performance Metric
Domain Agents
• Agents
2. Performance Metric
Collection Daemon
• PMCD
© 2017 Creative Arts & Technologies and others. All rights reserved.#Monitoring #Performance
PCP Architecture
© 2017 Creative Arts & Technologies and others. All rights reserved.#Monitoring #Performance
PCP Metrics
• pminfo --desc -tT --fetch disk.dev.read
disk.dev.read [per-disk read operations]
Data Type: 32-bit unsigned int InDom: 60.1
Semantics: counter Units: count
Help: Cumulative count of disk reads since
boot time
Values:
inst [0 or "sda"] value 3382299
inst [1 or "sdb"] value 178421
16
© 2017 Creative Arts & Technologies and others. All rights reserved.#Monitoring #Performance
PCP Agents
Webserver
(apache/nginx)
DBMS
Network
Kernel
PMCD
© 2017 Creative Arts & Technologies and others. All rights reserved.#Monitoring #Performance
PCP Clients
Agents
PMCD
pmie
pmstat
pmval
pminfo
pmchart
© 2017 Creative Arts & Technologies and others. All rights reserved.#Monitoring #Performance
PCP Remote Clients
Agents
PMCD
Clients
Remote
PMCD
© 2017 Creative Arts & Technologies and others. All rights reserved.#Monitoring #Performance
PCP Data Model
• Metrics come from one source (host / archive)
• Source can be queried at any interval by any monitor tool
• Hierarchical metric names
e.g. disk.dev.read and aconex.response_time.avg
• Metrics are singular or set-valued (“instance domain”)
• Metadata associated with every metric
• Data type (int32, uint64, double, ...)
• Data semantics (units, scale, ...)
• Instance domain
© 2017 Creative Arts & Technologies and others. All rights reserved.#Monitoring #Performance
Performance Timeline
• Where does the time go?
• Where’s it going now?
• Where will it go?
© 2017 Creative Arts & Technologies and others. All rights reserved.#Monitoring #Performance
Performance Timeline – Toolkit
• Archives
• Live Monitoring
• Modelling and statistical
prediction
© 2017 Creative Arts & Technologies and others. All rights reserved.#Monitoring #Performance
Performance Timeline – PCP
Toolkit
• Yesterday, last week, last month, ...
• All starts with pmlogger
• Arbitrary metrics, intervals
• One instance produces one PCP archive for one host
• An archive consists of 3 files
• Metadata, temporal index, data volume(s)
• pmlogger_daily, pmlogger_check
• Ensure the data keeps flowing
• pmlogsummary, pmwtf, pmdumptext
• pmlogextract, pmlogreduce
© 2017 Creative Arts & Technologies and others. All rights reserved.#Monitoring #Performance
Custom Instrumentation
(Applications)
© 2017 Creative Arts & Technologies and others. All rights reserved.#Monitoring #Performance
PCP – Parfait
Parfait has 4 main parts (for now)
• Monitoring
• DXM
• Timing
• Requests
© 2017 Creative Arts & Technologies and others. All rights reserved.#Monitoring #Performance
Parfait – Monitoring
• This is the ‘original’ PCP bridge metrics (heavily modified)
• Simple Java objects (MonitoredValues) which wrap a value (e.g.
AtomicLong, String)
• MonitoredValues register themselves with a registry (container)
• When values changes, observers notice and output accordingly
• PCP
• JMX
• Other (Custom/Extended)
• Very simple to use
• ‘Default registry’ (legacy concept)
© 2017 Creative Arts & Technologies and others. All rights reserved.#Monitoring #Performance
Parfait – Timing
• Logs the resources consumed by a request (an individual user action)
• Relies on a single request being thread-bound (and threads being used
exclusively)
• Basically needs a Map<Thread, Value>
• Take the value for a Thread at the start, and at the end
• Delta is the ‘cost’ of that request
© 2017 Creative Arts & Technologies and others. All rights reserved.#Monitoring #Performance
Parfait – Timing Example
[2010-09-22 15:02:13,466 INFO ][ait.timing.Log4jSink][http-8080-Processor3
gedq93kl][192.168.7.132][20][] Top taskssummaryfeatures:tasks
taskssummaryfeatures:tasks Elapsed time: own 380.146316 ms, total
380.14688 ms Total CPU: own 150.0 ms, total 150.0 ms User CPU: own 140.0 ms,
total 140.0 ms System CPU: own 10.0 ms, total 10.0 ms Blocked count: own 40,
total 40 Blocked time: own 22 ms, total 22 ms Wait count: own 2, total 2
Wait time: own 8 ms, total 8 ms Database execution time: own 57 ms, total 57
ms Database execution count: own 11, total 11Database logical read count: own
0, total 0 Database physical read count: own 0, total 0 Database CPU time:
own 0 ms, total 0 ms Database received bytes: own 26188 By, total 26188 By
Database sent bytes: own 24868 By, total 24868 By Error Pages: own 0, total
0 Bobo execution time: own 40.742124 ms, total 40.742124 ms Bobo execution
count: own 2, total 2 Bytes transferred via bobo search: own 0 By, total 0 By
Super search entity count: own 0, total 0 Super search count: own 0, total 0
Bytes transferred via super search: own 0 By, total 0 By Elapsed time
during super search: own 0 ms, total 0 ms
© 2017 Creative Arts & Technologies and others. All rights reserved.#Monitoring #Performance
Parfait – Requests
• As well as snapshotting requests after completion, for many metrics we
can see meaningful ‘in-progress’ values
• Simple JMX bean which ‘walks’ in-progress requests
• Tie in with ThreadContext (MDC abstraction)
• Include UserID
• ThreadID
© 2017 Creative Arts & Technologies and others. All rights reserved.#Monitoring #Performance
PCP – Speed
Golang implementation of the PCP
instrumentation API
There are 3 main components
in the library
• Client
• Registry
• Metric
© 2017 Creative Arts & Technologies and others. All rights reserved.#Monitoring #Performance
PCP – Speed Metric
• SingletonMetric
• This type defines a metric with no instance domain and only one
value. It requires type, semantics and unit for construction, and
optionally takes a couple of description strings.
A simple construction
metric, err := speed.NewPCPSingletonMetric(
42, // initial value
"simple.counter", // name
speed.Int32Type, // type
speed.CounterSemantics, // semantics
speed.OneUnit, // unit
"A Simple Metric", // short description
"This is a simple counter metric to demonstrate the speed API", // long desc
)
© 2017 Creative Arts & Technologies and others. All rights reserved.#Monitoring #Performance
PCP for
Containers
© 2017 Creative Arts & Technologies and others. All rights reserved.#Monitoring #Performance
PCP for Containers – Cgroup
Accounting
• [subsys].stat files below /sys/fs/cgroup
• individual cgroup or summed over children
• blkio
• IOPs/bytes, service/wait time – aggregate/per-dev
• Split up by read/write, sync/async
• cpuacct
• Processor use per-cgroup - aggregate/per-CPU
• memory
• mapped anon pages, page cache, writeback, swap, active/inactive LRU
state
© 2017 Creative Arts & Technologies and others. All rights reserved.#Monitoring #Performance
PCP for Containers –
Namespaces
• Example: cat /proc/net/dev
• Contents differ inside vs outside a container
• Processes (e.g. cat) in containers run in different network, ipc, process,
uts, mount namespaces
• Namespaces are inherited across fork/clone
• Processes within a container share common view
© 2017 Creative Arts & Technologies and others. All rights reserved.#Monitoring #Performance
PCP Container Analysis – Goals
• Allow targeting of individual containers
• e.g. /proc/net/dev
• pminfo --fetch network
• vs
• pminfo –fetch –container=crank network
• Zero installation inside containers required
• Simplify your life (dev_t auto-mapping)
• Data reduction (proc.*, cgroup.*)
© 2017 Creative Arts & Technologies and others. All rights reserved.#Monitoring #Performance
PCP Container Analysis –
Mechanisms
• pminfo -f –host=acme.com –container=crank network
• Wire protocol extension
• Inform interested PCP collector agents
• Resolving container names, mapping names to cgroups, PIDs, etc.
• setns(2)
• Runs on the board, plenty of work remains
• New monitor tools with container awareness
© 2017 Creative Arts & Technologies and others. All rights reserved.#Monitoring #Performance
What is Metrics?
• Code instrumentation
• Meters
• Gauges
• Counters
• Histograms
• Web app instrumentation
• Web app health check
© 2017 Creative Arts & Technologies and others. All rights reserved.#Monitoring #Performance
Metrics Reporters
• Reporters
• Console
• CSV
• Slf4j
• JMX
• Advanced reporters
• Graphite
• Ganglia
© 2017 Creative Arts & Technologies and others. All rights reserved.#Monitoring #Performance
Metrics 3rd Party Libraries
• AspectJ
• InfluxDB
• StatsD
• Cassandra
• Spring
© 2017 Creative Arts & Technologies and others. All rights reserved.#Monitoring #Performance
Metrics Basics
• MetricsRegistry
• A collection of all the metrics for your application
• Usually one instance per JVM
• Use more in multi WAR deployment
• Names
• Each metric has a unique name
• Registry has helper methods for creating names
MetricRegistry.name(Queue.class, "items", "total")
//com.example.queue.items.total
MetricRegistry.name(Queue.class, "size", "byte")
//com.example.queue.size.byte
© 2017 Creative Arts & Technologies and others. All rights reserved.#Monitoring #Performance
Metrics Elements
• Gauges
• The simplest metric type: it just returns a value
final Map<String, String> keys = new HashMap<>();
registry.register(MetricRegistry.name("gauge", "keys"), new
Gauge<Integer>() {
@Override
public Integer getValue() {
return keys.keySet().size();
}
});
© 2017 Creative Arts & Technologies and others. All rights reserved.#Monitoring #Performance
Metrics Elements (2)
• Counters
• Incrementing and decrementing 64.bit integer
final Counter counter= registry.counter(MetricRegistry.name("counter",
"inserted"));
counter.inc();
© 2017 Creative Arts & Technologies and others. All rights reserved.#Monitoring #Performance
Metrics Elements (3)
• Histograms
• Measures the distribution of values in a stream of data
final Histogram resultCounts = registry.histogram(name(ProductDAO.class,
"result-counts");
resultCounts.update(results.size());
• Meters
• Measures the rate at which a set of events occur
final Meter meter = registry.meter(MetricRegistry.name("meter", "inserted"));
meter.mark();
© 2017 Creative Arts & Technologies and others. All rights reserved.#Monitoring #Performance
Metrics Elements (4)
• Timers
• A histogram of the duration of a type of event and a meter of the rate
of its occurrence
Timer timer = registry.timer(MetricRegistry.name("timer", "inserted"));
Context context = timer.time();
//timed ops
context.stop();
© 2017 Creative Arts & Technologies and others. All rights reserved.#Monitoring #Performance
Metrics – Graphite Reporter
final Graphite graphite = new Graphite(new
InetSocketAddress("graphite.example.com", 2003));
final GraphiteReporter reporter = GraphiteReporter.forRegistry(registry)
.prefixedWith("web1.example.com")
.convertRatesTo(TimeUnit.SECONDS)
.convertDurationsTo(TimeUnit.MILLISECONDS)
.filter(MetricFilter.ALL)
.build(graphite);
reporter.start(1, TimeUnit.MINUTES);
Metrics can be prefixed
Useful to divide environment metrics: prod, test
© 2017 Creative Arts & Technologies and others. All rights reserved.#Monitoring #Performance
Metrics – Grafana Application
Overview
What is Eclipse MicroProfile?
● Eclipse MicroProfile is an open-source community
specification for Enterprise Java microservices
● A community of individuals, organizations, and vendors
collaborating within an open source (Eclipse) project to
bring microservices to the Enterprise Java community
47
Specifications 1.2
48
MicroProfile 1.2
= New
= No change from last release
JAX-RS 2.0JSON-P 1.0CDI 1.2
Config 1.1
Fault
Tolerance
1.0
JWT
Propagation
1.0
Health
Check 1.0
Metrics 1.0
© 2017 Creative Arts & Technologies and others. All rights reserved.#Monitoring #Performance
Prometheus
© 2017 Creative Arts & Technologies and others. All rights reserved.#Monitoring #Performance
What is Prometheus?
Prometheus is an open-source systems monitoring
and alerting toolkit originally
built at SoundCloud. It is now a standalone open
source project and maintained
independently of any company.
© 2017 Creative Arts & Technologies and others. All rights reserved.#Monitoring #Performance
Prometheus Components
• The main Prometheus server which scrapes and stores time series data
• Client libraries for instrumenting application code
• A push gateway for supporting short-lived jobs
• Special-purpose exporters (for HAProxy, StatsD, Graphite, etc.)
• An alertmanager
• Various support tools
• WhiteBox Monitoring instead of probing (aka BlackBox Monitoring)
© 2017 Creative Arts & Technologies and others. All rights reserved.#Monitoring #Performance
What is StatsD?
A network daemon that runs on the Node.js platform
and listens for statistics, like counters and timers, sent
over UDP or TCP and sends aggregates to one or more
pluggable backend services (e.g., Graphite).
StatsD was inspired (heavily) by the project (of the
same name) at Flickr.
@YourTwitterHandle#DVXFR14{session hashtag} © 2016 Creative Arts & Technologies and others. All rights reserved.#Monitoring #Performance Images: Nu Image / Millennium Films
© 2017 Creative Arts & Technologies and others. All rights reserved.#Monitoring #Performance
Links
Performance Co-Pilot
http://www.pcp.io
Dropwizard Metrics
http://metrics.dropwizard.io
Eclipse MicroProfile
http://microprofile.io
Prometheus
http://prometheus.io
StatsD
https://github.com/etsy/statsd/wiki
@YourTwitterHandle#DVXFR14{session hashtag} © 2016 Creative Arts & Technologies and others. All rights reserved.#Monitoring #Performance
Ad

Recommended

MongoDB for Time Series Data: Schema Design
MongoDB
 
MongoDB for Time Series Data Part 1: Setting the Stage for Sensor Management
MongoDB
 
Store stream data on Data Lake
Marcos Rebelo
 
Building a data driven search application with LucidWorks SiLK
Lucidworks (Archived)
 
NetflixOSS Meetup season 3 episode 1
Ruslan Meshenberg
 
Planet-scale Data Ingestion Pipeline: Bigdam
SATOSHI TAGOMORI
 
Introducing log analysis to your organization
Sematext Group, Inc.
 
How Thermo Fisher is Reducing Data Analysis Times from Days to Minutes with M...
MongoDB
 
Lambda Architecture Using SQL
SATOSHI TAGOMORI
 
MongoDB and the Internet of Things
MongoDB
 
MongoDB World 2018: Building a New Transactional Model
MongoDB
 
Perfect Norikra 2nd Season
SATOSHI TAGOMORI
 
RedisConf18 - Implementing a New Data Structure for Redis
Redis Labs
 
History of Event Collector in Treasure Data
Mitsunori Komatsu
 
Sizing Your MongoDB Cluster
MongoDB
 
Osiot14 buildout
Osiot14 buildout
Michael Koster
 
Big Data Warehousing Meetup: Developing a super-charged NoSQL data mart using...
Caserta
 
It's a Dangerous World
MongoDB
 
MongoDB as a Data Warehouse: Time Series and Device History Data (Medtronic)
MongoDB
 
Improved Applications with IPv6: an overview
Cisco DevNet
 
Open source monitoring systems
Forthscale
 
Norikra Recent Updates
SATOSHI TAGOMORI
 
RedisConf18 - Writing modular & encapsulated Redis code
Redis Labs
 
Technologies, Data Analytics Service and Enterprise Business
SATOSHI TAGOMORI
 
Meetup070416 Presentations
Ana Rebelo
 
HDFS Selective Wire Encryption
Konstantin V. Shvachko
 
Iot Toolkit and the Smart Object API - Architecture for Interoperability
Michael Koster
 
MongoDB for Time Series Data: Setting the Stage for Sensor Management
MongoDB
 
Monitoring and Scaling Redis at DataDog - Ilan Rabinovitch, DataDog
Redis Labs
 
How to create custom dashboards in Elastic Search / Kibana with Performance V...
PerformanceVision (previously SecurActive)
 

More Related Content

What's hot (20)

Lambda Architecture Using SQL
SATOSHI TAGOMORI
 
MongoDB and the Internet of Things
MongoDB
 
MongoDB World 2018: Building a New Transactional Model
MongoDB
 
Perfect Norikra 2nd Season
SATOSHI TAGOMORI
 
RedisConf18 - Implementing a New Data Structure for Redis
Redis Labs
 
History of Event Collector in Treasure Data
Mitsunori Komatsu
 
Sizing Your MongoDB Cluster
MongoDB
 
Osiot14 buildout
Osiot14 buildout
Michael Koster
 
Big Data Warehousing Meetup: Developing a super-charged NoSQL data mart using...
Caserta
 
It's a Dangerous World
MongoDB
 
MongoDB as a Data Warehouse: Time Series and Device History Data (Medtronic)
MongoDB
 
Improved Applications with IPv6: an overview
Cisco DevNet
 
Open source monitoring systems
Forthscale
 
Norikra Recent Updates
SATOSHI TAGOMORI
 
RedisConf18 - Writing modular & encapsulated Redis code
Redis Labs
 
Technologies, Data Analytics Service and Enterprise Business
SATOSHI TAGOMORI
 
Meetup070416 Presentations
Ana Rebelo
 
HDFS Selective Wire Encryption
Konstantin V. Shvachko
 
Iot Toolkit and the Smart Object API - Architecture for Interoperability
Michael Koster
 
MongoDB for Time Series Data: Setting the Stage for Sensor Management
MongoDB
 
Lambda Architecture Using SQL
SATOSHI TAGOMORI
 
MongoDB and the Internet of Things
MongoDB
 
MongoDB World 2018: Building a New Transactional Model
MongoDB
 
Perfect Norikra 2nd Season
SATOSHI TAGOMORI
 
RedisConf18 - Implementing a New Data Structure for Redis
Redis Labs
 
History of Event Collector in Treasure Data
Mitsunori Komatsu
 
Sizing Your MongoDB Cluster
MongoDB
 
Big Data Warehousing Meetup: Developing a super-charged NoSQL data mart using...
Caserta
 
It's a Dangerous World
MongoDB
 
MongoDB as a Data Warehouse: Time Series and Device History Data (Medtronic)
MongoDB
 
Improved Applications with IPv6: an overview
Cisco DevNet
 
Open source monitoring systems
Forthscale
 
RedisConf18 - Writing modular & encapsulated Redis code
Redis Labs
 
Technologies, Data Analytics Service and Enterprise Business
SATOSHI TAGOMORI
 
Meetup070416 Presentations
Ana Rebelo
 
Iot Toolkit and the Smart Object API - Architecture for Interoperability
Michael Koster
 
MongoDB for Time Series Data: Setting the Stage for Sensor Management
MongoDB
 

Similar to Performance Monitoring for the Cloud - Java2Days 2017 (20)

Monitoring and Scaling Redis at DataDog - Ilan Rabinovitch, DataDog
Redis Labs
 
How to create custom dashboards in Elastic Search / Kibana with Performance V...
PerformanceVision (previously SecurActive)
 
Cloud Security Monitoring and Spark Analytics
amesar0
 
Rakuten’s Journey with Splunk - Evolution of Splunk as a Service
Rakuten Group, Inc.
 
The Art of Container Monitoring
Derek Chen
 
Add observability to your django application - PyCon FR 2019
Bleemeo
 
Typesafe spark- Zalando meetup
Stavros Kontopoulos
 
DDS tutorial with connector
Javier Povedano
 
Spark + AI Summit 2019: Apache Spark Listeners: A Crash Course in Fast, Easy ...
Landon Robinson
 
Case Study: Elasticsearch Ingest Using StreamSets at Cisco Intercloud
Rick Bilodeau
 
Case Study: Elasticsearch Ingest Using StreamSets @ Cisco Intercloud
Streamsets Inc.
 
Capacity Planning
Capacity Planning
MongoDB
 
Conceptos básicos. Seminario web 6: Despliegue de producción
MongoDB
 
Azure tales: a real world CQRS and ES Deep Dive - Andrea Saltarello
ITCamp
 
Cytoscape: Now and Future
Keiichiro Ono
 
The Autobahn Has No Speed Limit - Your XPages Shouldn't Either!
Teamstudio
 
Apache Spark Listeners: A Crash Course in Fast, Easy Monitoring
Databricks
 
Monitorama 2015 Netflix Instance Analysis
Brendan Gregg
 
2020 07-30 elastic agent + ingest management
Daliya Spasova
 
From 1000/day to 1000/sec: The Evolution of Incapsula's BIG DATA System [Surg...
Imperva Incapsula
 
Monitoring and Scaling Redis at DataDog - Ilan Rabinovitch, DataDog
Redis Labs
 
How to create custom dashboards in Elastic Search / Kibana with Performance V...
PerformanceVision (previously SecurActive)
 
Cloud Security Monitoring and Spark Analytics
amesar0
 
Rakuten’s Journey with Splunk - Evolution of Splunk as a Service
Rakuten Group, Inc.
 
The Art of Container Monitoring
Derek Chen
 
Add observability to your django application - PyCon FR 2019
Bleemeo
 
DDS tutorial with connector
Javier Povedano
 
Spark + AI Summit 2019: Apache Spark Listeners: A Crash Course in Fast, Easy ...
Landon Robinson
 
Case Study: Elasticsearch Ingest Using StreamSets at Cisco Intercloud
Rick Bilodeau
 
Case Study: Elasticsearch Ingest Using StreamSets @ Cisco Intercloud
Streamsets Inc.
 
Capacity Planning
Capacity Planning
MongoDB
 
Conceptos básicos. Seminario web 6: Despliegue de producción
MongoDB
 
Azure tales: a real world CQRS and ES Deep Dive - Andrea Saltarello
ITCamp
 
Cytoscape: Now and Future
Keiichiro Ono
 
The Autobahn Has No Speed Limit - Your XPages Shouldn't Either!
Teamstudio
 
Apache Spark Listeners: A Crash Course in Fast, Easy Monitoring
Databricks
 
Monitorama 2015 Netflix Instance Analysis
Brendan Gregg
 
2020 07-30 elastic agent + ingest management
Daliya Spasova
 
From 1000/day to 1000/sec: The Evolution of Incapsula's BIG DATA System [Surg...
Imperva Incapsula
 
Ad

More from Werner Keil (20)

Securing eHealth, eGovernment and eBanking with Java - DWX '21
Werner Keil
 
OpenDDR and Jakarta MVC - JavaLand 2021
Werner Keil
 
How JSR 385 could have Saved the Mars Climate Orbiter - Zurich IoT Day 2021
Werner Keil
 
OpenDDR and Jakarta MVC - Java2Days 2020 Virtual
Werner Keil
 
NoSQL Endgame - Java2Days 2020 Virtual
Werner Keil
 
JCON 2020: Mobile Java Web Applications with MVC and OpenDDR
Werner Keil
 
How JSR 385 could have Saved the Mars Climate Orbiter - JFokus 2020
Werner Keil
 
Money, Money, Money, can be funny with JSR 354 (Devoxx BE)
Werner Keil
 
Money, Money, Money, can be funny with JSR 354 (DWX 2019)
Werner Keil
 
NoSQL: The first New Jakarta EE Specification (DWX 2019)
Werner Keil
 
How JSR 385 could have Saved the Mars Climate Orbiter - Adopt-a-JSR Day
Werner Keil
 
JNoSQL: The Definitive Solution for Java and NoSQL Databases
Werner Keil
 
Eclipse JNoSQL: The Definitive Solution for Java and NoSQL Databases
Werner Keil
 
Physikal - Using Kotlin for Clean Energy - KUG Munich
Werner Keil
 
Physikal - JSR 363 and Kotlin for Clean Energy - Java2Days 2017
Werner Keil
 
Eclipse Science F2F 2016 - JSR 363
Werner Keil
 
Java2Days - Security for JavaEE and the Cloud
Werner Keil
 
Apache DeviceMap - Web-Dev-BBQ Stuttgart
Werner Keil
 
The First IoT JSR: Units of Measurement - JUG Berlin-Brandenburg
Werner Keil
 
JSR 354: Money and Currency API - Short Overview
Werner Keil
 
Ad

Recently uploaded (20)

9-1-1 Addressing: End-to-End Automation Using FME
Safe Software
 
Coordinated Disclosure for ML - What's Different and What's the Same.pdf
Priyanka Aash
 
cnc-processing-centers-centateq-p-110-en.pdf
AmirStern2
 
ReSTIR [DI]: Spatiotemporal reservoir resampling for real-time ray tracing ...
revolcs10
 
Connecting Data and Intelligence: The Role of FME in Machine Learning
Safe Software
 
Techniques for Automatic Device Identification and Network Assignment.pdf
Priyanka Aash
 
2025_06_18 - OpenMetadata Community Meeting.pdf
OpenMetadata
 
Security Tips for Enterprise Azure Solutions
Michele Leroux Bustamante
 
AI VIDEO MAGAZINE - June 2025 - r/aivideo
1pcity Studios, Inc
 
PyCon SG 25 - Firecracker Made Easy with Python.pdf
Muhammad Yuga Nugraha
 
EIS-Webinar-Engineering-Retail-Infrastructure-06-16-2025.pdf
Earley Information Science
 
Using the SQLExecutor for Data Quality Management: aka One man's love for the...
Safe Software
 
UserCon Belgium: Honey, VMware increased my bill
stijn40
 
Enhance GitHub Copilot using MCP - Enterprise version.pdf
Nilesh Gule
 
Salesforce Summer '25 Release Frenchgathering.pptx.pdf
yosra Saidani
 
" How to survive with 1 billion vectors and not sell a kidney: our low-cost c...
Fwdays
 
Quantum AI Discoveries: Fractal Patterns Consciousness and Cyclical Universes
Saikat Basu
 
WebdriverIO & JavaScript: The Perfect Duo for Web Automation
digitaljignect
 
Securing AI - There Is No Try, Only Do!.pdf
Priyanka Aash
 
Raman Bhaumik - Passionate Tech Enthusiast
Raman Bhaumik
 

Performance Monitoring for the Cloud - Java2Days 2017

  • 1. Copyright © 2016, Creative Arts & Technologies and others. All rights reserved. Performance Monitoring for the Cloud Werner Keil JSR 363 Maintenance Lead @wernerkeil October 18, 2017
  • 2. © 2017 Creative Arts & Technologies and others. All rights reserved.#Monitoring #Performance Agenda 1. Introduction 2. Performance Co-Pilot 3. Dropwizard Metrics 4. MicroProfile Metrics 5. Prometheus 6. StatsD 7. Demo
  • 3. © 2017 Creative Arts & Technologies and others. All rights reserved.#Monitoring #Performance Who am I? Werner Keil • Consultant – Coach • Creative Cosmopolitan • Open Source Evangelist • Software Architect • Spec Lead – JSR363 • Individual JCP Executive Committee Member [www.linkedin.com/in/catmedia] Twitter @wernerkeil
  • 4. © 2017 Creative Arts & Technologies and others. All rights reserved.#Monitoring #Performance What is Monitoring? Monitoring applications is observing, analyzing and manipulating the execution of these applications, which gives information about threads, CPU usage, memory usage, as well as other information like methods and classes being used. A particular case is the monitoring of distributed applications, aka the Cloud where an the performance analysis of nodes and communication between them pose additional challenges.
  • 5. © 2017 Creative Arts & Technologies and others. All rights reserved.#Monitoring #Performance A high-level view of Cloud Monitoring
  • 6. © 2017 Creative Arts & Technologies and others. All rights reserved.#Monitoring #Performance Challenges at System Level • Efficient Scalability – Supporting tens of thousands of monitoring tasks – Cost effective: minimize resource usage • Monitoring QoS – Multi-tenancy environment – Minimize resource contention between monitoring tasks • Implication of Multi-Tenancy – Monitoring tasks: adding, removing – Resource contention between monitoring tasks
  • 7. © 2017 Creative Arts & Technologies and others. All rights reserved.#Monitoring #Performance Performance vs Number of Hosts Number of hosts Performance (values per second) 100 100 1000 1000 10000 10000 60 items per host, update frequency once per minute Number of hosts Performance (values per second) 100 1000 1000 10000 10000 100000 600 items per host, update frequency once per minute
  • 8. © 2017 Creative Arts & Technologies and others. All rights reserved.#Monitoring #Performance Monitoring Tips • Regularly apply “Little’s Law” to all data... generic (queueing theory) form: Q = λ R • Length = Arrival Rate x Response Time – e.g. 10 MB = 2 MB/sec x 5 sec • Utilization = Arrival Rate x Service Time – e.g. 20% = 0.2 = 100 msec/sec x 2 sec
  • 9. © 2017 Creative Arts & Technologies and others. All rights reserved.#Monitoring #Performance Types of Monitoring Monitoring Logs • Logstash • Redis • Elasticsearch • Kibana Dashboard Monitoring Performance • Collectd • Statsd • PCP • Graphite • Database (eg: PSQL) • Grafana Dashboard
  • 10. © 2017 Creative Arts & Technologies and others. All rights reserved.#Monitoring #Performance Monitoring Logs – Kibana Dashboard
  • 11. © 2017 Creative Arts & Technologies and others. All rights reserved.#Monitoring #Performance Monitoring Performance How is this traditionally done? • rsyslog/syslog-ng/journald • top/iostat/vmstat/ps • Mixture of scripting languages (bash/perl/python) • Specific tools vary per platform • Proper analysis requires more context
  • 12. © 2017 Creative Arts & Technologies and others. All rights reserved.#Monitoring #Performance Performance Co-Pilot PCP http://www.pcp.io GitHub https://github.com/performancecopilot
  • 13. © 2017 Creative Arts & Technologies and others. All rights reserved.#Monitoring #Performance What is PCP? • Open source toolkit • System-level analysis • Live and historical • Extensible (monitors, collectors) • Distributed • Unix-like component design • Cross platform • Ubiquitous units of measurement
  • 14. © 2017 Creative Arts & Technologies and others. All rights reserved.#Monitoring #Performance PCP Basics Agents and Daemons At the core we have two basic components: 1. Performance Metric Domain Agents • Agents 2. Performance Metric Collection Daemon • PMCD
  • 15. © 2017 Creative Arts & Technologies and others. All rights reserved.#Monitoring #Performance PCP Architecture
  • 16. © 2017 Creative Arts & Technologies and others. All rights reserved.#Monitoring #Performance PCP Metrics • pminfo --desc -tT --fetch disk.dev.read disk.dev.read [per-disk read operations] Data Type: 32-bit unsigned int InDom: 60.1 Semantics: counter Units: count Help: Cumulative count of disk reads since boot time Values: inst [0 or "sda"] value 3382299 inst [1 or "sdb"] value 178421 16
  • 17. © 2017 Creative Arts & Technologies and others. All rights reserved.#Monitoring #Performance PCP Agents Webserver (apache/nginx) DBMS Network Kernel PMCD
  • 18. © 2017 Creative Arts & Technologies and others. All rights reserved.#Monitoring #Performance PCP Clients Agents PMCD pmie pmstat pmval pminfo pmchart
  • 19. © 2017 Creative Arts & Technologies and others. All rights reserved.#Monitoring #Performance PCP Remote Clients Agents PMCD Clients Remote PMCD
  • 20. © 2017 Creative Arts & Technologies and others. All rights reserved.#Monitoring #Performance PCP Data Model • Metrics come from one source (host / archive) • Source can be queried at any interval by any monitor tool • Hierarchical metric names e.g. disk.dev.read and aconex.response_time.avg • Metrics are singular or set-valued (“instance domain”) • Metadata associated with every metric • Data type (int32, uint64, double, ...) • Data semantics (units, scale, ...) • Instance domain
  • 21. © 2017 Creative Arts & Technologies and others. All rights reserved.#Monitoring #Performance Performance Timeline • Where does the time go? • Where’s it going now? • Where will it go?
  • 22. © 2017 Creative Arts & Technologies and others. All rights reserved.#Monitoring #Performance Performance Timeline – Toolkit • Archives • Live Monitoring • Modelling and statistical prediction
  • 23. © 2017 Creative Arts & Technologies and others. All rights reserved.#Monitoring #Performance Performance Timeline – PCP Toolkit • Yesterday, last week, last month, ... • All starts with pmlogger • Arbitrary metrics, intervals • One instance produces one PCP archive for one host • An archive consists of 3 files • Metadata, temporal index, data volume(s) • pmlogger_daily, pmlogger_check • Ensure the data keeps flowing • pmlogsummary, pmwtf, pmdumptext • pmlogextract, pmlogreduce
  • 24. © 2017 Creative Arts & Technologies and others. All rights reserved.#Monitoring #Performance Custom Instrumentation (Applications)
  • 25. © 2017 Creative Arts & Technologies and others. All rights reserved.#Monitoring #Performance PCP – Parfait Parfait has 4 main parts (for now) • Monitoring • DXM • Timing • Requests
  • 26. © 2017 Creative Arts & Technologies and others. All rights reserved.#Monitoring #Performance Parfait – Monitoring • This is the ‘original’ PCP bridge metrics (heavily modified) • Simple Java objects (MonitoredValues) which wrap a value (e.g. AtomicLong, String) • MonitoredValues register themselves with a registry (container) • When values changes, observers notice and output accordingly • PCP • JMX • Other (Custom/Extended) • Very simple to use • ‘Default registry’ (legacy concept)
  • 27. © 2017 Creative Arts & Technologies and others. All rights reserved.#Monitoring #Performance Parfait – Timing • Logs the resources consumed by a request (an individual user action) • Relies on a single request being thread-bound (and threads being used exclusively) • Basically needs a Map<Thread, Value> • Take the value for a Thread at the start, and at the end • Delta is the ‘cost’ of that request
  • 28. © 2017 Creative Arts & Technologies and others. All rights reserved.#Monitoring #Performance Parfait – Timing Example [2010-09-22 15:02:13,466 INFO ][ait.timing.Log4jSink][http-8080-Processor3 gedq93kl][192.168.7.132][20][] Top taskssummaryfeatures:tasks taskssummaryfeatures:tasks Elapsed time: own 380.146316 ms, total 380.14688 ms Total CPU: own 150.0 ms, total 150.0 ms User CPU: own 140.0 ms, total 140.0 ms System CPU: own 10.0 ms, total 10.0 ms Blocked count: own 40, total 40 Blocked time: own 22 ms, total 22 ms Wait count: own 2, total 2 Wait time: own 8 ms, total 8 ms Database execution time: own 57 ms, total 57 ms Database execution count: own 11, total 11Database logical read count: own 0, total 0 Database physical read count: own 0, total 0 Database CPU time: own 0 ms, total 0 ms Database received bytes: own 26188 By, total 26188 By Database sent bytes: own 24868 By, total 24868 By Error Pages: own 0, total 0 Bobo execution time: own 40.742124 ms, total 40.742124 ms Bobo execution count: own 2, total 2 Bytes transferred via bobo search: own 0 By, total 0 By Super search entity count: own 0, total 0 Super search count: own 0, total 0 Bytes transferred via super search: own 0 By, total 0 By Elapsed time during super search: own 0 ms, total 0 ms
  • 29. © 2017 Creative Arts & Technologies and others. All rights reserved.#Monitoring #Performance Parfait – Requests • As well as snapshotting requests after completion, for many metrics we can see meaningful ‘in-progress’ values • Simple JMX bean which ‘walks’ in-progress requests • Tie in with ThreadContext (MDC abstraction) • Include UserID • ThreadID
  • 30. © 2017 Creative Arts & Technologies and others. All rights reserved.#Monitoring #Performance PCP – Speed Golang implementation of the PCP instrumentation API There are 3 main components in the library • Client • Registry • Metric
  • 31. © 2017 Creative Arts & Technologies and others. All rights reserved.#Monitoring #Performance PCP – Speed Metric • SingletonMetric • This type defines a metric with no instance domain and only one value. It requires type, semantics and unit for construction, and optionally takes a couple of description strings. A simple construction metric, err := speed.NewPCPSingletonMetric( 42, // initial value "simple.counter", // name speed.Int32Type, // type speed.CounterSemantics, // semantics speed.OneUnit, // unit "A Simple Metric", // short description "This is a simple counter metric to demonstrate the speed API", // long desc )
  • 32. © 2017 Creative Arts & Technologies and others. All rights reserved.#Monitoring #Performance PCP for Containers
  • 33. © 2017 Creative Arts & Technologies and others. All rights reserved.#Monitoring #Performance PCP for Containers – Cgroup Accounting • [subsys].stat files below /sys/fs/cgroup • individual cgroup or summed over children • blkio • IOPs/bytes, service/wait time – aggregate/per-dev • Split up by read/write, sync/async • cpuacct • Processor use per-cgroup - aggregate/per-CPU • memory • mapped anon pages, page cache, writeback, swap, active/inactive LRU state
  • 34. © 2017 Creative Arts & Technologies and others. All rights reserved.#Monitoring #Performance PCP for Containers – Namespaces • Example: cat /proc/net/dev • Contents differ inside vs outside a container • Processes (e.g. cat) in containers run in different network, ipc, process, uts, mount namespaces • Namespaces are inherited across fork/clone • Processes within a container share common view
  • 35. © 2017 Creative Arts & Technologies and others. All rights reserved.#Monitoring #Performance PCP Container Analysis – Goals • Allow targeting of individual containers • e.g. /proc/net/dev • pminfo --fetch network • vs • pminfo –fetch –container=crank network • Zero installation inside containers required • Simplify your life (dev_t auto-mapping) • Data reduction (proc.*, cgroup.*)
  • 36. © 2017 Creative Arts & Technologies and others. All rights reserved.#Monitoring #Performance PCP Container Analysis – Mechanisms • pminfo -f –host=acme.com –container=crank network • Wire protocol extension • Inform interested PCP collector agents • Resolving container names, mapping names to cgroups, PIDs, etc. • setns(2) • Runs on the board, plenty of work remains • New monitor tools with container awareness
  • 37. © 2017 Creative Arts & Technologies and others. All rights reserved.#Monitoring #Performance What is Metrics? • Code instrumentation • Meters • Gauges • Counters • Histograms • Web app instrumentation • Web app health check
  • 38. © 2017 Creative Arts & Technologies and others. All rights reserved.#Monitoring #Performance Metrics Reporters • Reporters • Console • CSV • Slf4j • JMX • Advanced reporters • Graphite • Ganglia
  • 39. © 2017 Creative Arts & Technologies and others. All rights reserved.#Monitoring #Performance Metrics 3rd Party Libraries • AspectJ • InfluxDB • StatsD • Cassandra • Spring
  • 40. © 2017 Creative Arts & Technologies and others. All rights reserved.#Monitoring #Performance Metrics Basics • MetricsRegistry • A collection of all the metrics for your application • Usually one instance per JVM • Use more in multi WAR deployment • Names • Each metric has a unique name • Registry has helper methods for creating names MetricRegistry.name(Queue.class, "items", "total") //com.example.queue.items.total MetricRegistry.name(Queue.class, "size", "byte") //com.example.queue.size.byte
  • 41. © 2017 Creative Arts & Technologies and others. All rights reserved.#Monitoring #Performance Metrics Elements • Gauges • The simplest metric type: it just returns a value final Map<String, String> keys = new HashMap<>(); registry.register(MetricRegistry.name("gauge", "keys"), new Gauge<Integer>() { @Override public Integer getValue() { return keys.keySet().size(); } });
  • 42. © 2017 Creative Arts & Technologies and others. All rights reserved.#Monitoring #Performance Metrics Elements (2) • Counters • Incrementing and decrementing 64.bit integer final Counter counter= registry.counter(MetricRegistry.name("counter", "inserted")); counter.inc();
  • 43. © 2017 Creative Arts & Technologies and others. All rights reserved.#Monitoring #Performance Metrics Elements (3) • Histograms • Measures the distribution of values in a stream of data final Histogram resultCounts = registry.histogram(name(ProductDAO.class, "result-counts"); resultCounts.update(results.size()); • Meters • Measures the rate at which a set of events occur final Meter meter = registry.meter(MetricRegistry.name("meter", "inserted")); meter.mark();
  • 44. © 2017 Creative Arts & Technologies and others. All rights reserved.#Monitoring #Performance Metrics Elements (4) • Timers • A histogram of the duration of a type of event and a meter of the rate of its occurrence Timer timer = registry.timer(MetricRegistry.name("timer", "inserted")); Context context = timer.time(); //timed ops context.stop();
  • 45. © 2017 Creative Arts & Technologies and others. All rights reserved.#Monitoring #Performance Metrics – Graphite Reporter final Graphite graphite = new Graphite(new InetSocketAddress("graphite.example.com", 2003)); final GraphiteReporter reporter = GraphiteReporter.forRegistry(registry) .prefixedWith("web1.example.com") .convertRatesTo(TimeUnit.SECONDS) .convertDurationsTo(TimeUnit.MILLISECONDS) .filter(MetricFilter.ALL) .build(graphite); reporter.start(1, TimeUnit.MINUTES); Metrics can be prefixed Useful to divide environment metrics: prod, test
  • 46. © 2017 Creative Arts & Technologies and others. All rights reserved.#Monitoring #Performance Metrics – Grafana Application Overview
  • 47. What is Eclipse MicroProfile? ● Eclipse MicroProfile is an open-source community specification for Enterprise Java microservices ● A community of individuals, organizations, and vendors collaborating within an open source (Eclipse) project to bring microservices to the Enterprise Java community 47
  • 48. Specifications 1.2 48 MicroProfile 1.2 = New = No change from last release JAX-RS 2.0JSON-P 1.0CDI 1.2 Config 1.1 Fault Tolerance 1.0 JWT Propagation 1.0 Health Check 1.0 Metrics 1.0
  • 49. © 2017 Creative Arts & Technologies and others. All rights reserved.#Monitoring #Performance Prometheus
  • 50. © 2017 Creative Arts & Technologies and others. All rights reserved.#Monitoring #Performance What is Prometheus? Prometheus is an open-source systems monitoring and alerting toolkit originally built at SoundCloud. It is now a standalone open source project and maintained independently of any company.
  • 51. © 2017 Creative Arts & Technologies and others. All rights reserved.#Monitoring #Performance Prometheus Components • The main Prometheus server which scrapes and stores time series data • Client libraries for instrumenting application code • A push gateway for supporting short-lived jobs • Special-purpose exporters (for HAProxy, StatsD, Graphite, etc.) • An alertmanager • Various support tools • WhiteBox Monitoring instead of probing (aka BlackBox Monitoring)
  • 52. © 2017 Creative Arts & Technologies and others. All rights reserved.#Monitoring #Performance What is StatsD? A network daemon that runs on the Node.js platform and listens for statistics, like counters and timers, sent over UDP or TCP and sends aggregates to one or more pluggable backend services (e.g., Graphite). StatsD was inspired (heavily) by the project (of the same name) at Flickr.
  • 53. @YourTwitterHandle#DVXFR14{session hashtag} © 2016 Creative Arts & Technologies and others. All rights reserved.#Monitoring #Performance Images: Nu Image / Millennium Films
  • 54. © 2017 Creative Arts & Technologies and others. All rights reserved.#Monitoring #Performance Links Performance Co-Pilot http://www.pcp.io Dropwizard Metrics http://metrics.dropwizard.io Eclipse MicroProfile http://microprofile.io Prometheus http://prometheus.io StatsD https://github.com/etsy/statsd/wiki
  • 55. @YourTwitterHandle#DVXFR14{session hashtag} © 2016 Creative Arts & Technologies and others. All rights reserved.#Monitoring #Performance

Editor's Notes

  • #49: Config 1.1 introduces minor (documentation) changes to Config 1.0