Redis is an in-memory key-value store that is often used as a database, cache, and message broker. It supports various data structures like strings, hashes, lists, sets, and sorted sets. While data is stored in memory for fast access, Redis can also persist data to disk. It is widely used by companies like GitHub, Craigslist, and Engine Yard to power applications with high performance needs.
Building Event Streaming Architectures on Scylla and KafkaScyllaDB
This document discusses building event streaming architectures using Scylla and Confluent Kafka. It provides an overview of Scylla and how it can be used with Kafka at Numberly. It then discusses change data capture (CDC) in Scylla and how to stream data from Scylla to Kafka using Kafka Connect and the Scylla source connector. The Kafka Connect framework and connectors allow capturing changes from Scylla tables in Kafka topics to power downstream applications and tasks.
Introduction to memcached, a caching service designed for optimizing performance and scaling in the web stack, seen from perspective of MySQL/PHP users. Given for 2nd year students of professional bachelor in ICT at Kaho St. Lieven, Gent.
Modeling Data and Queries for Wide Column NoSQLScyllaDB
Discover how to model data for wide column databases such as ScyllaDB and Apache Cassandra. Contrast the differerence from traditional RDBMS data modeling, going from a normalized “schema first” design to a denormalized “query first” design. Plus how to use advanced features like secondary indexes and materialized views to use the same base table to get the answers you need.
Getting up to speed with MirrorMaker 2 | Mickael Maison, IBM and Ryanne Dolan...HostedbyConfluent
More and more Enterprises are relying on Apache Kafka to run their businesses. Cluster administrators need the ability to mirror data between clusters to provide high availability and disaster recovery.
MirrorMaker 2, released recently as part of Kafka 2.4.0, allows you to mirror multiple clusters and create many replication topologies. Learn all about this awesome new tool and how to reliably and easily mirror clusters.
We will first describe how MirrorMaker 2 works, including how it addresses all the shortcomings of MirrorMaker 1. We will also cover how to decide between its many deployment modes. Finally, we will share our experience running it in production as well as our tips and tricks to get a smooth ride.
Evening out the uneven: dealing with skew in FlinkFlink Forward
Flink Forward San Francisco 2022.
When running Flink jobs, skew is a common problem that results in wasted resources and limited scalability. In the past years, we have helped our customers and users solve various skew-related issues in their Flink jobs or clusters. In this talk, we will present the different types of skew that users often run into: data skew, key skew, event time skew, state skew, and scheduling skew, and discuss solutions for each of them. We hope this will serve as a guideline to help you reduce skew in your Flink environment.
by
Jun Qin & Karl Friedrich
Performance Tuning RocksDB for Kafka Streams’ State Storesconfluent
Performance Tuning RocksDB for Kafka Streams’ State Stores, Bruno Cadonna, Contributor to Apache Kafka & Software Developer at Confluent and Dhruba Borthakur, CTO & Co-founder Rockset
Meetup link: https://www.meetup.com/Berlin-Apache-Kafka-Meetup-by-Confluent/events/273823025/
Clickhouse Capacity Planning for OLAP Workloads, Mik Kocikowski of CloudFlareAltinity Ltd
Presented on December ClickHouse Meetup. Dec 3, 2019
Concrete findings and "best practices" from building a cluster sized for 150 analytic queries per second on 100TB of http logs. Topics covered: hardware, clients (http vs native), partitioning, indexing, SELECT vs INSERT performance, replication, sharding, quotas, and benchmarking.
HTTP Analytics for 6M requests per second using ClickHouse, by Alexander Boc...Altinity Ltd
This document summarizes Cloudflare's use of ClickHouse to analyze over 6 million HTTP requests per second. Some key points:
- Cloudflare previously used PostgreSQL, Citus, and Flink but these did not scale sufficiently.
- ClickHouse was chosen as it is fast, scalable, fault tolerant, and Cloudflare had existing expertise in it.
- Cloudflare designed ClickHouse schemas to aggregate HTTP data into totals, breakdowns by category, and unique counts into two tables using different engines.
- Tuning ClickHouse index granularity improved query latency by 50% and throughput by 3x.
- The new ClickHouse pipeline is more scalable, fault tolerant
Kafka Streams State Stores Being Persistentconfluent
This document discusses Kafka Streams state stores. It provides examples of using different types of windowing (tumbling, hopping, sliding, session) with state stores. It also covers configuring state store logging, caching, and retention policies. The document demonstrates how to define windowed state stores in Kafka Streams applications and discusses concepts like grace periods.
Deep Dive into Spark SQL with Advanced Performance Tuning with Xiao Li & Wenc...Databricks
Spark SQL is a highly scalable and efficient relational processing engine with ease-to-use APIs and mid-query fault tolerance. It is a core module of Apache Spark. Spark SQL can process, integrate and analyze the data from diverse data sources (e.g., Hive, Cassandra, Kafka and Oracle) and file formats (e.g., Parquet, ORC, CSV, and JSON). This talk will dive into the technical details of SparkSQL spanning the entire lifecycle of a query execution. The audience will get a deeper understanding of Spark SQL and understand how to tune Spark SQL performance.
No matter how resilient your database infrastructure is, backups are still needed to defend against catastrophic failures. Be it the unlikely hardware failure of all data centers, or the more likely and all-too-human user error. Acknowledging the importance of good backup procedures, the Scylla Manager now natively supports backup and restore operations. In this talk, we will learn more about how that works and the guarantees provided, as well as how to set it up to guarantee maximum resiliency to your cluster.
Flink Forward San Francisco 2019: Moving from Lambda and Kappa Architectures ...Flink Forward
Moving from Lambda and Kappa Architectures to Kappa+ at Uber
Kappa+ is a new approach developed at Uber to overcome the limitations of the Lambda and Kappa architectures. Whether your realtime infrastructure processes data at Uber scale (well over a trillion messages daily) or only a fraction of that, chances are you will need to reprocess old data at some point.
There can be many reasons for this. Perhaps a bug fix in the realtime code needs to be retroactively applied (aka backfill), or there is a need to train realtime machine learning models on last few months of data before bringing the models online. Kafka's data retention is limited in practice and generally insufficient for such needs. So data must be processed from archives. Aside from addressing such situations, enabling efficient stream processing on archived as well as realtime data also broadens the applicability of stream processing.
This talk introduces the Kappa+ architecture which enables the reuse of streaming realtime logic (stateful and stateless) to efficiently process any amounts of historic data without requiring it to be in Kafka. We shall discuss the complexities involved in such kind of processing and the specific techniques employed in Kappa+ to tackle them.
Storm is a distributed and fault-tolerant realtime computation system. It was created at BackType/Twitter to analyze tweets, links, and users on Twitter in realtime. Storm provides scalability, reliability, and ease of programming. It uses components like Zookeeper, ØMQ, and Thrift. A Storm topology defines the flow of data between spouts that read data and bolts that process data. Storm guarantees processing of all data through its reliability APIs and guarantees no data loss even during failures.
Grafana Mimir and VictoriaMetrics_ Performance Tests.pptxRomanKhavronenko
VictoriaMetrics and Grafana Mimir are time series databases with support of mostly the same protocols and APIs. However, they have different architectures and components, which makes the comparison more complicated. In the talk, we'll go through the details of the benchmark where I compared both solutions. We'll see how VictoriaMetrics and Mimir are dealing with identical workloads and how efficient they’re with using the allocated resources.
The talk will cover design and architectural details, weak and strong points, trade-offs, and maintenance complexity of both solutions.
Kafka is an open-source distributed commit log service that provides high-throughput messaging functionality. It is designed to handle large volumes of data and different use cases like online and offline processing more efficiently than alternatives like RabbitMQ. Kafka works by partitioning topics into segments spread across clusters of machines, and replicates across these partitions for fault tolerance. It can be used as a central data hub or pipeline for collecting, transforming, and streaming data between systems and applications.
This document discusses using ClickHouse for experimentation and metrics at Spotify. It describes how Spotify built an experimentation platform using ClickHouse to provide teams interactive queries on granular metrics data with low latency. Key aspects include ingesting data from Google Cloud Storage to ClickHouse daily, defining metrics through a centralized catalog, and visualizing metrics and running queries using Superset connected to ClickHouse. The platform aims to reduce load on notebooks and BigQuery by serving common queries directly from ClickHouse.
1. Log structured merge trees store data in multiple levels with different storage speeds and costs, requiring data to periodically merge across levels.
2. This structure allows fast writes by storing new data in faster levels before merging to slower levels, and efficient reads by querying multiple levels and merging results.
3. The merging process involves loading, sorting, and rewriting levels to consolidate and propagate deletions and updates between levels.
A brief introduction to Apache Kafka and describe its usage as a platform for streaming data. It will introduce some of the newer components of Kafka that will help make this possible, including Kafka Connect, a framework for capturing continuous data streams, and Kafka Streams, a lightweight stream processing library.
Alexander Sapin from Yandex presents reasoning, design considerations, and implementation of ClickHouse Keeper. It replaces ZooKeeper in ClickHouse clusters, thereby simplifying operation enormously.
How Scylla Make Adding and Removing Nodes Faster and SaferScyllaDB
When a new node is added or removed, Scylla has to transfer part of the existing data from some nodes to their neighbors. When a node fails, Scylla has to repopulate its data with data from the surviving replicas. Those operations are collectively referred to as "streaming" operations, since they simply stream data from one node to another, without using this opportunity to also fix discrepancies in the data. This is in contrast with the repair operation, that looks into all existing replicas and reconcile their contents. Scylla is moving towards unifying those two operations. In this talk we will discuss why this is considered beneficial, and what other possibilities this opens to users.
ksqlDB is a stream processing SQL engine, which allows stream processing on top of Apache Kafka. ksqlDB is based on Kafka Stream and provides capabilities for consuming messages from Kafka, analysing these messages in near-realtime with a SQL like language and produce results again to a Kafka topic. By that, no single line of Java code has to be written and you can reuse your SQL knowhow. This lowers the bar for starting with stream processing significantly.
ksqlDB offers powerful capabilities of stream processing, such as joins, aggregations, time windows and support for event time. In this talk I will present how KSQL integrates with the Kafka ecosystem and demonstrate how easy it is to implement a solution using ksqlDB for most part. This will be done in a live demo on a fictitious IoT sample.
Apache Spark Data Source V2 with Wenchen Fan and Gengliang WangDatabricks
As a general computing engine, Spark can process data from various data management/storage systems, including HDFS, Hive, Cassandra and Kafka. For flexibility and high throughput, Spark defines the Data Source API, which is an abstraction of the storage layer. The Data Source API has two requirements.
1) Generality: support reading/writing most data management/storage systems.
2) Flexibility: customize and optimize the read and write paths for different systems based on their capabilities.
Data Source API V2 is one of the most important features coming with Spark 2.3. This talk will dive into the design and implementation of Data Source API V2, with comparison to the Data Source API V1. We also demonstrate how to implement a file-based data source using the Data Source API V2 for showing its generality and flexibility.
Streaming Event Time Partitioning with Apache Flink and Apache Iceberg - Juli...Flink Forward
Netflix’s playback data records every user interaction with video on the service, from trailers on the home page to full-length movies. This is a critical dataset with high volume that is used broadly across Netflix, powering product experiences, AB test metrics, and offline insights. In processing playback data, we depend heavily on event-time partitioning to handle a long tail of late arriving events. In this talk, I’ll provide an overview of our recent implementation of generic event-time partitioning on high volume streams using Apache Flink and Apache Iceberg (Incubating). Built as configurable Flink components that leverage Iceberg as a new output table format, we are now able to write playback data and other large scale datasets directly from a stream into a table partitioned on event time, replacing the common pattern of relying on a post-processing batch job that “puts the data in the right place”. We’ll talk through what it took to apply this to our playback data in practice, as well as challenges we hit along the way and tradeoffs with a streaming approach to event-time partitioning.
Squirreling Away $640 Billion: How Stripe Leverages Flink for Change Data Cap...Flink Forward
Flink Forward San Francisco 2022.
Being in the payments space, Stripe requires strict correctness and freshness guarantees. We rely on Flink as the natural solution for delivering on this in support of our Change Data Capture (CDC) infrastructure. We heavily rely on CDC as a tool for capturing data change streams from our databases without critically impacting database reliability, scalability, and maintainability. Data derived from these streams is used broadly across the business and powers many of our critical financial reporting systems totalling over $640 Billion in payment volume annually. We use many components of Flink’s flexible DataStream API to perform aggregations and abstract away the complexities of stream processing from our downstreams. In this talk, we’ll walk through our experience from the very beginning to what we have in production today. We’ll share stories around the technical details and trade-offs we encountered along the way.
by
Jeff Chao
Introducing the Apache Flink Kubernetes OperatorFlink Forward
Flink Forward San Francisco 2022.
The Apache Flink Kubernetes Operator provides a consistent approach to manage Flink applications automatically, without any human interaction, by extending the Kubernetes API. Given the increasing adoption of Kubernetes based Flink deployments the community has been working on a Kubernetes native solution as part of Flink that can benefit from the rich experience of community members and ultimately make Flink easier to adopt. In this talk we give a technical introduction to the Flink Kubernetes Operator and demonstrate the core features and use-cases through in-depth examples."
by
Thomas Weise
Talk for PerconaLive 2016 by Brendan Gregg. Video: https://www.youtube.com/watch?v=CbmEDXq7es0 . "Systems performance provides a different perspective for analysis and tuning, and can help you find performance wins for your databases, applications, and the kernel. However, most of us are not performance or kernel engineers, and have limited time to study this topic. This talk summarizes six important areas of Linux systems performance in 50 minutes: observability tools, methodologies, benchmarking, profiling, tracing, and tuning. Included are recipes for Linux performance analysis and tuning (using vmstat, mpstat, iostat, etc), overviews of complex areas including profiling (perf_events), static tracing (tracepoints), and dynamic tracing (kprobes, uprobes), and much advice about what is and isn't important to learn. This talk is aimed at everyone: DBAs, developers, operations, etc, and in any environment running Linux, bare-metal or the cloud."
Organizations continue to adopt Solr because of its ability to scale to meet even the most demanding workflows. Recently, LucidWorks has been leading the effort to identify, measure, and expand the limits of Solr. As part of this effort, we've learned a few things along the way that should prove useful for any organization wanting to scale Solr. Attendees will come away with a better understanding of how sharding and replication impact performance. Also, no benchmark is useful without being repeatable; Tim will also cover how to perform similar tests using the Solr-Scale-Toolkit in Amazon EC2.
This document provides an overview of performance analysis tools for Linux systems. It describes Brendan Gregg's background and work analyzing performance at Netflix. It then discusses different types of tools, including observability tools to monitor systems, benchmarking tools to test performance, and tuning tools to optimize systems. A number of command line monitoring tools are outlined, such as vmstat, iostat, mpstat, and netstat, as well as more advanced tools like strace and tcpdump.
Performance Analysis: new tools and concepts from the cloudBrendan Gregg
Talk delivered at SCaLE10x, Los Angeles 2012.
Cloud Computing introduces new challenges for performance
analysis, for both customers and operators of the cloud. Apart from
monitoring a scaling environment, issues within a system can be
complicated when tenants are competing for the same resources, and are
invisible to each other. Other factors include rapidly changing
production code and wildly unpredictable traffic surges. For
performance analysis in the Joyent public cloud, we use a variety of
tools including Dynamic Tracing, which allows us to create custom
tools and metrics and to explore new concepts. In this presentation
I'll discuss a collection of these tools and the metrics that they
measure. While these are DTrace-based, the focus of the talk is on
which metrics are proving useful for analyzing real cloud issues.
Talk for YOW! by Brendan Gregg. "Systems performance studies the performance of computing systems, including all physical components and the full software stack to help you find performance wins for your application and kernel. However, most of us are not performance or kernel engineers, and have limited time to study this topic. This talk summarizes the topic for everyone, touring six important areas: observability tools, methodologies, benchmarking, profiling, tracing, and tuning. Included are recipes for Linux performance analysis and tuning (using vmstat, mpstat, iostat, etc), overviews of complex areas including profiling (perf_events) and tracing (ftrace, bcc/BPF, and bpftrace/BPF), advice about what is and isn't important to learn, and case studies to see how it is applied. This talk is aimed at everyone: developers, operations, sysadmins, etc, and in any environment running Linux, bare metal or the cloud.
"
This document provides information on monitoring Linux system resources and performance. It discusses tools like vmstat, sar, iostat for monitoring CPU usage, memory usage, I/O usage, and other metrics. It also covers Linux processes, memory management, and block device monitoring.
Talk for QConSF 2015: "Broken benchmarks, misleading metrics, and terrible tools. This talk will help you navigate the treacherous waters of system performance tools, touring common problems with system metrics, monitoring, statistics, visualizations, measurement overhead, and benchmarks. This will likely involve some unlearning, as you discover tools you have been using for years, are in fact, misleading, dangerous, or broken.
The speaker, Brendan Gregg, has given many popular talks on operating system performance tools. This is an anti-version of these talks, to focus on broken tools and metrics instead of the working ones. Metrics can be misleading, and counters can be counter-intuitive! This talk will include advice and methodologies for verifying new performance tools, understanding how they work, and using them successfully."
iland Internet Solutions: Leveraging Cassandra for real-time multi-datacenter...DataStax Academy
iland has built a global data warehouse across multiple data centers, collecting and aggregating data from core cloud services including compute, storage and network as well as chargeback and compliance. iland's warehouse brings actionable intelligence that customers can use to manipulate resources, analyze trends, define alerts and share information.
In this session, we would like to present the lessons learned around Cassandra, both at the development and operations level, but also the technology and architecture we put in action on top of Cassandra such as Redis, syslog-ng, RabbitMQ, Java EE, etc.
Finally, we would like to share insights on how we are currently extending our platform with Spark and Kafka and what our motivations are.
Leveraging Cassandra for real-time multi-datacenter public cloud analyticsJulien Anguenot
iland has built a global data warehouse across multiple data centers, collecting and aggregating data from core cloud services including compute, storage and network as well as chargeback and compliance. iland's warehouse brings actionable intelligence that customers can use to manipulate resources, analyze trends, define alerts and share information.
In this session, we would like to present the lessons learned around Cassandra, both at the development and operations level, but also the technology and architecture we put in action on top of Cassandra such as Redis, syslog-ng, RabbitMQ, Java EE, etc.
Finally, we would like to share insights on how we are currently extending our platform with Spark and Kafka and what our motivations are.
Video and slides synchronized, mp3 and slide download available at URL http://bit.ly/1N4GN6z.
Brendan Gregg focuses on broken tools and metrics instead of the working ones. Metrics can be misleading, and counters can be counter-intuitive. Gregg includes advice and methodologies for verifying new performance tools, understanding how they work, and using them successfully. Filmed at qconsf.com.
Brendan Gregg is a senior performance architect at Netflix, where he does large scale computer performance design, analysis, and tuning. He is the author of multiple technical books including Systems Performance published by Prentice Hall, and received the USENIX LISA Award for Outstanding Achievement in System Administration.
CONFidence 2015: DTrace + OSX = Fun - Andrzej Dyjak PROIDEA
This document summarizes a presentation about using DTrace on OS X. It introduces DTrace as a dynamic tracing tool for user and kernel space. It discusses the D programming language used for writing DTrace scripts, including data types, variables, operators, and actions. Example one-liners and scripts are provided to demonstrate syscall tracking, memory allocation snooping, and hit tracing. The presentation outlines some past security work using DTrace and similar dynamic tracing tools. It concludes with proposing future work like more kernel and USDT tracing as well as Python bindings for DTrace.
From USENIX LISA 2010, San Jose.
Visualizations that include heat maps can be an effective way to present performance data: I/O latency, resource utilization, and more. Patterns can emerge that would be difficult to notice from columns of numbers or line graphs, which are revealing previously unknown behavior. These visualizations are used in a product as a replacement for traditional metrics such as %CPU and are allowing end users to identify more issues much more easily (and some issues are becoming nearly impossible to identify with tools such as vmstat(1)). This talk covers what has been learned, crazy heat map discoveries, and thoughts for future applications beyond performance analysis.
The document discusses diagnosing and mitigating MySQL performance issues. It describes using various operating system monitoring tools like vmstat, iostat, and top to analyze CPU, memory, disk, and network utilization. It also discusses using MySQL-specific tools like the MySQL command line, mysqladmin, mysqlbinlog, and external tools to diagnose issues like high load, I/O wait, or slow queries by examining metrics like queries, connections, storage engine statistics, and InnoDB logs and data written. The agenda covers identifying system and MySQL-specific bottlenecks by verifying OS metrics and running diagnostics on the database, storage engines, configuration, and queries.
This document provides an overview of Node.js application performance analysis and optimization as well as distributed system design. It discusses analyzing and optimizing CPU, memory, file I/O and network I/O usage. It also covers profiling Node.js applications using tools like Linux profiling tools, Node.js libraries, and V8 profiling tools. Lastly it discusses designing distributed systems using single machine and cluster approaches.
Oracle Database In-Memory Option in ActionTanel Poder
The document discusses Oracle Database In-Memory option and how it improves performance of data retrieval and processing queries. It provides examples of running a simple aggregation query with and without various performance features like In-Memory, vector processing and bloom filters enabled. Enabling these features reduces query elapsed time from 17 seconds to just 3 seconds by minimizing disk I/O and leveraging CPU optimizations like SIMD vector processing.
In Memory Database In Action by Tanel Poder and Kerry OsborneEnkitec
The document discusses Oracle Database In-Memory option and how it improves performance of data retrieval and processing queries. It provides examples of running a simple aggregation query with and without various performance features like In-Memory, vector processing and bloom filters enabled. Enabling these features reduces query elapsed time from 17 seconds to just 3 seconds by minimizing disk I/O and leveraging CPU optimizations like SIMD vector processing.
Analyzing OS X Systems Performance with the USE MethodBrendan Gregg
Talk for MacIT 2014. This talk is about systems performance on OS X, and introduces the USE Method to check for common performance bottlenecks and errors. This methodology can be used by beginners and experts alike, and begins by constructing a checklist of the questions we’d like to ask of the system, before reaching for tools to answer them. The focus is resources: CPUs, GPUs, memory capacity, network interfaces, storage devices, controllers, interconnects, as well as some software resources such as mutex locks. These areas are investigated by a wide variety of tools, including vm_stat, iostat, netstat, top, latency, the DTrace scripts in /usr/bin (which were written by Brendan), custom DTrace scripts, Instruments, and more. This is a tour of the tools needed to solve our performance needs, rather than understanding tools just because they exist. This talk will make you aware of many areas of OS X that you can investigate, which will be especially useful for the time when you need to get to the bottom of a performance issue.
The document summarizes Maycon Vitali's presentation on hacking embedded devices. It includes an agenda covering extracting firmware from devices using tools like BusPirate and flashrom, decompressing firmware to view file systems and binaries, emulating binaries using QEMU, reverse engineering code to find vulnerabilities, and details four vulnerabilities discovered in Ubiquiti networking devices designated as CVEs. The presentation aims to demonstrate common weaknesses in embedded device security and how tools can be used to analyze and hack these ubiquitous connected systems.
Performance Scenario: Diagnosing and resolving sudden slow down on two node RACKristofferson A
This document summarizes the steps taken to diagnose and resolve a sudden slow down issue affecting applications running on a two node Real Application Clusters (RAC) environment. The troubleshooting process involved systematically measuring performance at the operating system, database, and session levels. Key findings included high wait times and fragmentation issues on the network interconnect, which were resolved by replacing the network switch. Measuring performance using tools like ASH, AWR, and OS monitoring was essential to systematically diagnose the problem.
Broken benchmarks, misleading metrics, and terrible tools. This talk will help you navigate the treacherous waters of Linux performance tools, touring common problems with system tools, metrics, statistics, visualizations, measurement overhead, and benchmarks. You might discover that tools you have been using for years, are in fact, misleading, dangerous, or broken.
The speaker, Brendan Gregg, has given many talks on tools that work, including giving the Linux PerformanceTools talk originally at SCALE. This is an anti-version of that talk, to focus on broken tools and metrics instead of the working ones. Metrics can be misleading, and counters can be counter-intuitive! This talk will include advice for verifying new performance tools, understanding how they work, and using them successfully.
Designing Low-Latency Systems with Rust and ScyllaDB: An Architectural Deep DiveScyllaDB
Want to learn practical tips for designing systems that can scale efficiently without compromising speed?
Join us for a workshop where we’ll address these challenges head-on and explore how to architect low-latency systems using Rust. During this free interactive workshop oriented for developers, engineers, and architects, we’ll cover how Rust’s unique language features and the Tokio async runtime enable high-performance application development.
As you explore key principles of designing low-latency systems with Rust, you will learn how to:
- Create and compile a real-world app with Rust
- Connect the application to ScyllaDB (NoSQL data store)
- Negotiate tradeoffs related to data modeling and querying
- Manage and monitor the database for consistently low latencies
Powering a Billion Dreams: Scaling Meesho’s E-commerce Revolution with Scylla...ScyllaDB
With over a billion Indians set to shop online, Meesho is redefining e-commerce by making it accessible, affordable, and inclusive at an unprecedented scale. But scaling for Bharat isn’t just about growth—it’s about building a tech backbone that can handle massive traffic surges, dynamic pricing, real-time recommendations, and seamless user experiences. In this session, we’ll take you behind the scenes of Meesho’s journey in democratizing e-commerce while operating at Monster Scale. Discover how ScyllaDB plays a crucial role in handling millions of transactions, optimizing catalog ranking, and ensuring ultra-low-latency operations. We’ll deep dive into our real-world use cases, performance optimizations, and the key architectural decisions that have helped us scale effortlessly.
Navigating common mistakes and critical success factors
Is your team considering or starting a database migration? Learn from the frontline experience gained guiding hundreds of high-stakes migration projects – from startups to Google and Twitter. Join us as Miles Ward and Tim Koopmans have a candid chat about what tends to go wrong and how to steer things right.
We will explore:
- What really pushes teams to the database migration tipping point
- How to scope and manage the complexity of a migration
- Proven migration strategies and antipatterns
- Where complications commonly arise and ways to prevent them
Expect plenty of war stories, along with pragmatic ways to make your own migration as “blissfully boring” as possible.
Achieving Extreme Scale with ScyllaDB: Tips & TradeoffsScyllaDB
Explore critical strategies – and antipatterns – for achieving low latency at extreme scale
If you’re getting started with ScyllaDB, you’re probably intrigued by its potential to achieve predictable low latency at extreme scale. But how do you ensure that you’re maximizing that potential for your team’s specific workloads and technical requirements?
This webinar offers practical advice for navigating the various decision points you’ll face as you evaluate ScyllaDB for your project and move into production. We’ll cover the most critical considerations, tradeoffs, and recommendations related to:
- Infrastructure selection
- ScyllaDB configuration
- Client-side setup
- Data modeling
Join us for an inside look at the lessons learned across thousands of real-world distributed database projects.
Securely Serving Millions of Boot Artifacts a Day by João Pedro Lima & Matt ...ScyllaDB
Cloudflare’s boot infrastructure dynamically generates and signs boot artifacts for nodes worldwide, ensuring secure, scalable, and customizable deployments. This talk dives into its architecture, scaling decisions, and how it enables seamless testing while maintaining a strong chain of trust.
How Agoda Scaled 50x Throughput with ScyllaDB by Worakarn IsarathamScyllaDB
Learn about Agoda's performance tuning strategies for ScyllaDB. Worakarn shares how they optimized disk performance, fine-tuned compaction strategies, and adjusted SSTable settings to match their workload for peak efficiency.
How Yieldmo Cut Database Costs and Cloud Dependencies Fast by Todd ColemanScyllaDB
Yieldmo processes hundreds of billions of ad requests daily with subsecond latency. Initially using DynamoDB for its simplicity and stability, they faced rising costs, suboptimal latencies, and cloud provider lock-in. This session explores their journey to ScyllaDB’s DynamoDB-compatible API.
There’s a common adage that it takes 10 years to develop a file system. As ScyllaDB reaches that 10 year milestone in 2025, it’s the perfect time to reflect on the last decade of ScyllaDB development – both hits and misses. It’s especially appropriate given that our project just reached a critical mass with certain scalability and elasticity goals that we dreamed up years ago. This talk will cover how we arrived at ScyllaDB X Cloud achieving our initial vision, and share where we’re heading next.
Reduce Your Cloud Spend with ScyllaDB by Tzach LivyatanScyllaDB
This talk will explore why ScyllaDB Cloud is a cost-effective alternative to DynamoDB, highlighting efficient design implementations like shared compute, local NVMe storage, and storage compression. It will also discuss new X Cloud features, better plans and pricing, and a direct cost comparison between ScyllaDB and DynamoDB
Migrating 50TB Data From a Home-Grown Database to ScyllaDB, Fast by Terence LiuScyllaDB
Terence share how Clearview AI's infra needs evolved and why they chose ScyllaDB after first-principles research. From fast ingestion to production queries, the talk explores their journey with Rust, embedded DB readers, and the ScyllaDB Rust driver—plus config tips for bulk ingestion and achieving data parity.
Vector Search with ScyllaDB by Szymon WasikScyllaDB
Vector search is an essential element of contemporary machine learning pipelines and AI tools. This talk will share preliminary results on the forthcoming vector storage and search features in ScyllaDB. By leveraging Scylla's scalability and USearch library's performance, we have designed a system with exceptional query latency and throughput. The talk will cover vector search use cases, our roadmap, and a comparison of our initial implementation with other vector databases.
Workload Prioritization: How to Balance Multiple Workloads in a Cluster by Fe...ScyllaDB
Workload Prioritization is a ScyllaDB exclusive feature for controlling how different workloads compete for system resources. It's used to prioritize urgent application requests that require immediate response times versus others that can tolerate slighter delays (e.g., large scans). Join this session for a demo of how applying workload prioritization reduces infrastructure costs while ensuring predictable performance at scale.
Two Leading Approaches to Data Virtualization, and Which Scales Better? by Da...ScyllaDB
Should you move code to data or data to code? Conventional wisdom favors the former, but cloud trends push the latter. This session by the creator of PACELC explores the shift, its risks, and the ongoing debate in data virtualization between push- and pull-based processing.
Scaling a Beast: Lessons from 400x Growth in a High-Stakes Financial System b...ScyllaDB
Scaling from 66M to 25B+ records in a core financial system is tough—every number must be right, and data must be fresh. In this session, Dmytro shares real-world strategies to balance accuracy with real-time performance and avoid scaling pitfalls. It's purely practical, no-BS insights for engineers.
Object Storage in ScyllaDB by Ran Regev, ScyllaDBScyllaDB
In this talk we take a look at how Object Storage is used by Scylla. We focus on current usage, namely - for backup, and we look at the shift in implementation from an external tool to native Scylla. We take a close look at the complexity of backup and restore mostly in the face of topology changes and token assignments. We also take a glimpse to the future and see how Scylla is going to use Object Storage as its native storage. We explore a few possible applications of it and understand the tradeoffs.
Lessons Learned from Building a Serverless Notifications System by Srushith R...ScyllaDB
Reaching your audience isn’t just about email. Learn how we built a scalable, cost-efficient notifications system using AWS serverless—handling SMS, WhatsApp, and more. From architecture to throttling challenges, this talk dives into key decisions for high-scale messaging.
A Dist Sys Programmer's Journey into AI by Piotr SarnaScyllaDB
This talk explores the culture shock of transitioning from distributed databases to AI. While AI operates at massive scale, distributed storage and compute remain essential. Discover key differences, unexpected parallels, and how database expertise applies in the AI world.
High Availability: Lessons Learned by Paul PreuveneersScyllaDB
How does ScyllaDB keep your data safe, and your mission critical applications running smoothly, even in the face of disaster? In this talk we’ll discuss what we have learned about High Availability, how it is implemented within ScyllaDB and what that means for your business. You’ll learn about ScyllaDB cloud architecture design, consistency, replication and even load balancing and much more.
How Natura Uses ScyllaDB and ScyllaDB Connector to Create a Real-time Data Pi...ScyllaDB
Natura, a top global cosmetics brand with 3M+ beauty consultants in Latin America, processes massive data for orders, campaigns, and analytics. In this talk, Rodrigo Luchini & Marcus Monteiro share how Natura leverages ScyllaDB’s CDC Source Connector for real-time sales insights.
Persistence Pipelines in a Processing Graph: Mutable Big Data at Salesforce b...ScyllaDB
This is a case study on managing mutable big data: Exploring the evolution of the persistence layer in a processing graph, tackling design challenges, and refining key operational principles along the way.
DevOpsDays Atlanta 2025 - Building 10x Development Organizations.pptxJustin Reock
Building 10x Organizations with Modern Productivity Metrics
10x developers may be a myth, but 10x organizations are very real, as proven by the influential study performed in the 1980s, ‘The Coding War Games.’
Right now, here in early 2025, we seem to be experiencing YAPP (Yet Another Productivity Philosophy), and that philosophy is converging on developer experience. It seems that with every new method we invent for the delivery of products, whether physical or virtual, we reinvent productivity philosophies to go alongside them.
But which of these approaches actually work? DORA? SPACE? DevEx? What should we invest in and create urgency behind today, so that we don’t find ourselves having the same discussion again in a decade?
#StandardsGoals for 2025: Standards & certification roundup - Tech Forum 2025BookNet Canada
Book industry standards are evolving rapidly. In the first part of this session, we’ll share an overview of key developments from 2024 and the early months of 2025. Then, BookNet’s resident standards expert, Tom Richardson, and CEO, Lauren Stewart, have a forward-looking conversation about what’s next.
Link to recording, transcript, and accompanying resource: https://bnctechforum.ca/sessions/standardsgoals-for-2025-standards-certification-roundup/
Presented by BookNet Canada on May 6, 2025 with support from the Department of Canadian Heritage.
HCL Nomad Web – Best Practices and Managing Multiuser Environmentspanagenda
Webinar Recording: https://www.panagenda.com/webinars/hcl-nomad-web-best-practices-and-managing-multiuser-environments/
HCL Nomad Web is heralded as the next generation of the HCL Notes client, offering numerous advantages such as eliminating the need for packaging, distribution, and installation. Nomad Web client upgrades will be installed “automatically” in the background. This significantly reduces the administrative footprint compared to traditional HCL Notes clients. However, troubleshooting issues in Nomad Web present unique challenges compared to the Notes client.
Join Christoph and Marc as they demonstrate how to simplify the troubleshooting process in HCL Nomad Web, ensuring a smoother and more efficient user experience.
In this webinar, we will explore effective strategies for diagnosing and resolving common problems in HCL Nomad Web, including
- Accessing the console
- Locating and interpreting log files
- Accessing the data folder within the browser’s cache (using OPFS)
- Understand the difference between single- and multi-user scenarios
- Utilizing Client Clocking
Semantic Cultivators : The Critical Future Role to Enable AIartmondano
By 2026, AI agents will consume 10x more enterprise data than humans, but with none of the contextual understanding that prevents catastrophic misinterpretations.
Complete Guide to Advanced Logistics Management Software in Riyadh.pdfSoftware Company
Explore the benefits and features of advanced logistics management software for businesses in Riyadh. This guide delves into the latest technologies, from real-time tracking and route optimization to warehouse management and inventory control, helping businesses streamline their logistics operations and reduce costs. Learn how implementing the right software solution can enhance efficiency, improve customer satisfaction, and provide a competitive edge in the growing logistics sector of Riyadh.
Quantum Computing Quick Research Guide by Arthur MorganArthur Morgan
This is a Quick Research Guide (QRG).
QRGs include the following:
- A brief, high-level overview of the QRG topic.
- A milestone timeline for the QRG topic.
- Links to various free online resource materials to provide a deeper dive into the QRG topic.
- Conclusion and a recommendation for at least two books available in the SJPL system on the QRG topic.
QRGs planned for the series:
- Artificial Intelligence QRG
- Quantum Computing QRG
- Big Data Analytics QRG
- Spacecraft Guidance, Navigation & Control QRG (coming 2026)
- UK Home Computing & The Birth of ARM QRG (coming 2027)
Any questions or comments?
- Please contact Arthur Morgan at [email protected].
100% human made.
TrsLabs - Fintech Product & Business ConsultingTrs Labs
Hybrid Growth Mandate Model with TrsLabs
Strategic Investments, Inorganic Growth, Business Model Pivoting are critical activities that business don't do/change everyday. In cases like this, it may benefit your business to choose a temporary external consultant.
An unbiased plan driven by clearcut deliverables, market dynamics and without the influence of your internal office equations empower business leaders to make right choices.
Getting things done within a budget within a timeframe is key to Growing Business - No matter whether you are a start-up or a big company
Talk to us & Unlock the competitive advantage
Procurement Insights Cost To Value Guide.pptxJon Hansen
Procurement Insights integrated Historic Procurement Industry Archives, serves as a powerful complement — not a competitor — to other procurement industry firms. It fills critical gaps in depth, agility, and contextual insight that most traditional analyst and association models overlook.
Learn more about this value- driven proprietary service offering here.
Generative Artificial Intelligence (GenAI) in BusinessDr. Tathagat Varma
My talk for the Indian School of Business (ISB) Emerging Leaders Program Cohort 9. In this talk, I discussed key issues around adoption of GenAI in business - benefits, opportunities and limitations. I also discussed how my research on Theory of Cognitive Chasms helps address some of these issues
The Evolution of Meme Coins A New Era for Digital Currency ppt.pdfAbi john
Analyze the growth of meme coins from mere online jokes to potential assets in the digital economy. Explore the community, culture, and utility as they elevate themselves to a new era in cryptocurrency.
Big Data Analytics Quick Research Guide by Arthur MorganArthur Morgan
This is a Quick Research Guide (QRG).
QRGs include the following:
- A brief, high-level overview of the QRG topic.
- A milestone timeline for the QRG topic.
- Links to various free online resource materials to provide a deeper dive into the QRG topic.
- Conclusion and a recommendation for at least two books available in the SJPL system on the QRG topic.
QRGs planned for the series:
- Artificial Intelligence QRG
- Quantum Computing QRG
- Big Data Analytics QRG
- Spacecraft Guidance, Navigation & Control QRG (coming 2026)
- UK Home Computing & The Birth of ARM QRG (coming 2027)
Any questions or comments?
- Please contact Arthur Morgan at [email protected].
100% human made.
TrustArc Webinar: Consumer Expectations vs Corporate Realities on Data Broker...TrustArc
Most consumers believe they’re making informed decisions about their personal data—adjusting privacy settings, blocking trackers, and opting out where they can. However, our new research reveals that while awareness is high, taking meaningful action is still lacking. On the corporate side, many organizations report strong policies for managing third-party data and consumer consent yet fall short when it comes to consistency, accountability and transparency.
This session will explore the research findings from TrustArc’s Privacy Pulse Survey, examining consumer attitudes toward personal data collection and practical suggestions for corporate practices around purchasing third-party data.
Attendees will learn:
- Consumer awareness around data brokers and what consumers are doing to limit data collection
- How businesses assess third-party vendors and their consent management operations
- Where business preparedness needs improvement
- What these trends mean for the future of privacy governance and public trust
This discussion is essential for privacy, risk, and compliance professionals who want to ground their strategies in current data and prepare for what’s next in the privacy landscape.
Andrew Marnell: Transforming Business Strategy Through Data-Driven InsightsAndrew Marnell
With expertise in data architecture, performance tracking, and revenue forecasting, Andrew Marnell plays a vital role in aligning business strategies with data insights. Andrew Marnell’s ability to lead cross-functional teams ensures businesses achieve sustainable growth and operational excellence.
2. Our Agenda for today
• Basics of Monitoring Scylla
• Monitoring Infrastructure
• Understanding Scylla metrics
3. Linux tools
• Linux tools are familiar, widely available, no setup needed
▪iostat, top, sar, netstat, etc.
•Good for tier-1 analysis and overviews
▪but often don’t tell the whole story,
▪and are limited to a node only.
4. The top example
• Scylla uses a polling architecture
▪Scylla running at < 100 % CPU -> definitely underloaded.
▪Scylla running at = 100 % CPU -> impossible to determine.
CPU in use CPU idle
request
poll
period
5. The top example
• Scylla uses a polling architecture
▪Scylla running at < 100 % CPU -> definitely underloaded.
▪Scylla running at = 100 % CPU -> impossible to determine.
CPU in use
poll
period
poll
period
poll
period
9. Not all issues are database issues
• Client can introduce latencies as well
▪most notably, cassandra-stress will do.
▪JHiccup - client instrumentation for client-side hiccups.
10. Our Agenda for today
• Basics of Monitoring Scylla
• Monitoring Infrastructure
• Understanding Scylla metrics
13. How to use those metrics?
• your own infrastructure
▪Whatever works for collectd, works for Scylla
• scyllatop
• prometheus + grafana
14. scyllatop
• easy to use, top-like interface.
• very high resolution
• good for ad-hoc probing
▪not very good for cluster-wide view or time progression
15. List of metrics available
• RESTful API:
$ curl http://scylla-server:10000/collectd | json_reformat
[
…
{
"enable": true,
"id": {
"plugin_instance": "#cpu",
"type_instance": "load",
"type": "gauge",
"plugin": "reactor"
}
},
• scyllatop -l:
▪ includes host metrics
# scylla running with --smp 1
$ scyllatop -l | wc -l
145
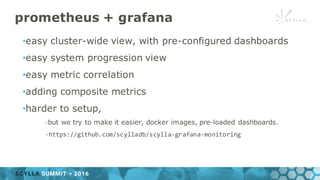
16. prometheus + grafana
•easy cluster-wide view, with pre-configured dashboards
•easy system progression view
•easy metric correlation
•adding composite metrics
•harder to setup,
-but we try to make it easier, docker images, pre-loaded dashboards.
-https://github.com/scylladb/scylla-grafana-monitoring
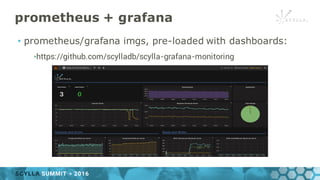
19. Our Agenda for today
• Basics of Monitoring Scylla
• Monitoring Infrastructure
• Understanding Scylla metrics
20. Naming of metrics
Collectd naming scheme:
{host}/{plugin}-{plugin instance}/{type}-{type instance}
• plugin - name of the component
• plugin instance - instance of the component
• type - type of metric’s value
• type instance - name of the metric of given component
22. Naming of metrics
• plugin instances usually correspond to shard numbers.
▪ Example --smp 3:
node1/reactor-0/gauge-load
node1/reactor-1/gauge-load
node1/reactor-2/gauge-load
23. • GAUGE - value as is
▪ collectd types: gauge, bytes, pending_operations, ...
▪ reactor-*/gauge-load, lsa-*/bytes-total_space, ...
• DERIVE - change over time
▪ collectd types: total_operations, derive, ...
▪ database-*/total_operations-total_reads
Data source types
24. Naming of metrics
When exported to prometheus:
collectd_{plugin}_{type} { {plugin}={plugin instance},type={type instance},instance={host} }
E.g.:
collectd_reactor_gauge{reactor=”0”,type=”load”,instance=”node1”}
28. Best reflected by reactor-*/gauge-load
• percentage of time Scylla was executing tasks
▪ excludes busy polling, execution of on-idle tasks, sleeping
▪ Updated every second and reflects past 5 seconds.
• 100 means the server is CPU-bound
CPU Utilization
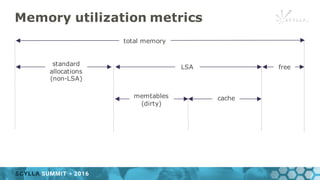
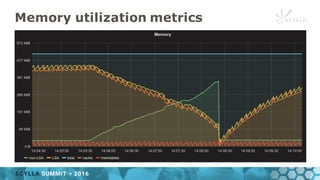
30. Memory utilization metrics
total memory
standard
allocations
(non-LSA)
LSA free
memtables
(dirty)
cache
lsa-*/bytes-non_lsa_used_space
memory-*/memory-total_memory
lsa-*/bytes-total_space
memory-*/bytes-dirty cache-*/bytes-total
31. Memory utilization metrics
• Useful for detecting:
▪cache getting shrunk down due to pressure from std allocations
▪requests blocking
-only 50 % of memory is allowed to be dirty.
-Requests will block if we can’t clean fast enough.