SlideShare a Scribd company logo
Prepared by Volkan OBAN
Plot3D package in R and examples,etc.
Reference: http://www.sthda.com/english/wiki/impressive-package-for-3d-and-4d-graph-r-
software-and-data-visualization
text3D: plot 3-dimensionnal texts
The function text3D() is used as follow:
text3D(x, y, z, labels, ...)
The USArrests data sets will be used in the example below:
data(USArrests)
with(USArrests, text3D(Murder, Assault, Rape,
labels = rownames(USArrests), colvar = UrbanPop,
col = gg.col(100), theta = 60, phi = 20,
xlab = "Murder", ylab = "Assault", zlab = "Rape",
main = "USA arrests", cex = 0.6,
bty = "g", ticktype = "detailed", d = 2,
clab = c("Urban","Pop"), adj = 0.5, font = 2))
Plot3D Package and Example in R.-Data visualizat,on
# Plot texts
with(USArrests, text3D(Murder, Assault, Rape, labels = rownames(USArrests),
colvar = UrbanPop, col = gg.col(100), theta = 60, phi = 20, xlab = "Murder",
ylab = "Assault", zlab = "Rape", main = "USA arrests", cex = 0.6, bty = "g",
ticktype = "detailed", d = 2, clab = c("Urban","Pop"), adj = 0.5, font = 2)) #
Add points with(USArrests, scatter3D(Murder, Assault, Rape - 1, colvar =
UrbanPop, col = gg.col(100), type = "h", pch = ".", add = TRUE))
plotdev(xlim = c(0, 10), ylim = c(40, 150), zlim = c(7, 25))
Histogram3D
data(VADeaths)
# hist3D and ribbon3D with greyish background, rotated, rescaled,...
hist3D(z = VADeaths, scale = FALSE, expand = 0.01, bty = "g", phi = 20, col =
"#0072B2", border = "black", shade = 0.2, ltheta = 90, space = 0.3, ticktype
= "detailed", d = 2)
hist3D (x = 1:5, y = 1:4, z = VADeaths, bty = "g", phi = 20, theta = -60,
xlab = "", ylab = "", zlab = "", main = "VADeaths", col = "#0072B2", border =
"black", shade = 0.8, ticktype = "detailed", space = 0.15, d = 2, cex.axis =
1e-9)
# Use text3D to label x axis
text3D(x = 1:5, y = rep(0.5, 5), z = rep(3, 5), labels =
rownames(VADeaths), add = TRUE, adj = 0)
# Use text3D to label yaxis
text3D(x = rep(1, 4), y = 1:4, z = rep(0, 4), labels = colnames(VADeaths),
add = TRUE, adj = 1)
Plot3D Package and Example in R.-Data visualizat,on
hist3D_fancy(iris$Sepal.Length, iris$Petal.Width,
+ colvar=as.numeric(iris$Species))
Example:
x0 <- c(0, 0, 0, 0)
> y0 <- c(0, 0, 0, 0)
> z0 <- c(0, 0, 0, 0)
> x1 <- c(0.89, -0.46, 0.99, 0.96)
> y1 <- c(0.36, 0.88, 0.02, 0.06)
> z1 <- c(-0.28, 0.09, 0.05, 0.24)
> cols <- c("#1B9E77", "#D95F02", "#7570B3", "#E7298A")
> arrows3D(x0, y0, z0, x1, y1, z1, colvar = x1^2, col = cols,
+ lwd = 2, d = 3, clab = c("Quality", "score"),
+ main = "Arrows 3D", bty ="g", ticktype = "detailed")
> # Add starting point of arrow
> points3D(x0, y0, z0, add = TRUE, col="darkred",
+ colkey = FALSE, pch = 19, cex = 1)
> # Add labels to the arrows
> text3D(x1, y1, z1, c("Sepal.L", "Sepal.W", "Petal.L", "Petal.W"),
+ colvar = x1^2, col = cols, add=TRUE, colkey = FALSE)
EXAMPLE:
data(iris)
x <- iris$Sepal.Length
y <- iris$Petal.Length
z <- iris$Sepal.Width
scatter3D(x, y, z, pch = 18, bty = "u", colkey = FALSE,
+ main ="bty= 'u'", col.panel ="steelblue", expand =0.4,
+ col.grid = "darkblue")
Plot3D Package and Example in R.-Data visualizat,on
> scatter3D(x, y, z, bty = "g", pch = 18, col = gg.col(100))
> # ramp.col: custom palettes
> scatter3D(x, y, z, bty = "g", pch = 18,
+ col = ramp.col(c("blue", "yellow", "red")) )
> scatter3D(x, y, z, phi = 0, bty = "g",
+ pch = 20, cex = 2, ticktype = "detailed")
scatter3D(x, y, z, phi = 0, bty = "g", type = "l", ticktype = "detailed", lwd =
4)
scatter3D(x, y, z, phi = 0, bty = "g", type = "h",
+ ticktype = "detailed", pch = 19, cex = 0.5)
> x <- mtcars$wt
> y <- mtcars$disp
> z <- mtcars$mpg
> # Compute the linear regression (z = ax + by + d)
> fit <- lm(z ~ x + y)
> # predict values on regular xy grid
> grid.lines = 26
> x.pred <- seq(min(x), max(x), length.out = grid.lines)
> y.pred <- seq(min(y), max(y), length.out = grid.lines)
> xy <- expand.grid( x = x.pred, y = y.pred)
> z.pred <- matrix(predict(fit, newdata = xy),
+ nrow = grid.lines, ncol = grid.lines)
> # fitted points for droplines to surface
> fitpoints <- predict(fit)
> # scatter plot with regression plane
> scatter3D(x, y, z, pch = 18, cex = 2,
+ theta = 20, phi = 20, ticktype = "detailed",
+ xlab = "wt", ylab = "disp", zlab = "mpg",
+ surf = list(x = x.pred, y = y.pred, z = z.pred,
+ facets = NA, fit = fitpoints), main = "mtcars")

More Related Content

Similar to Plot3D Package and Example in R.-Data visualizat,on (20)

PPTX
Interactive and 3 d scatterplot
Sachin Adnaik
 
PPTX
Interactive and 3 d scatterplot
Sachin Adnaik
 
DOCX
Surface3d in R and rgl package.
Dr. Volkan OBAN
 
PDF
Data visualization-2.1
RenukaRajmohan
 
PDF
Data Visualization with ggplot2.pdf
CarlosTrujillo199971
 
DOCX
Some Examples in R- [Data Visualization--R graphics]
Dr. Volkan OBAN
 
PDF
VISIALIZACION DE DATA.pdf
Ivan Bautista Fuentes
 
PDF
Graphics in R
Kamal Gupta Roy
 
PDF
Download full ebook of Datacamp Ggplot2 Cheatsheet Itebooks instant download pdf
miatalafeer
 
PDF
M4_DAR_part1. module part 4 analystics with r
LalithauLali
 
PDF
Data mining for the masses, Chapter 4, Using R instead of Rapidminer
Ulrik Hørlyk Hjort
 
DOCX
Advanced Data Visualization in R- Somes Examples.
Dr. Volkan OBAN
 
PPTX
K10765 Matlab 3D Mesh Plots
Shraddhey Bhandari
 
PPT
R graphics
DHIVYADEVAKI
 
ODP
Geospatial Data in R
Barry Rowlingson
 
PDF
data-visualization.pdf
Juan José Rivas
 
PDF
R getting spatial
FAO
 
PDF
10. R getting spatial
ExternalEvents
 
PDF
Manual "The meuse data set"
MauricioTics2016
 
PDF
Data Exploration and Visualization with R
Yanchang Zhao
 
Interactive and 3 d scatterplot
Sachin Adnaik
 
Interactive and 3 d scatterplot
Sachin Adnaik
 
Surface3d in R and rgl package.
Dr. Volkan OBAN
 
Data visualization-2.1
RenukaRajmohan
 
Data Visualization with ggplot2.pdf
CarlosTrujillo199971
 
Some Examples in R- [Data Visualization--R graphics]
Dr. Volkan OBAN
 
VISIALIZACION DE DATA.pdf
Ivan Bautista Fuentes
 
Graphics in R
Kamal Gupta Roy
 
Download full ebook of Datacamp Ggplot2 Cheatsheet Itebooks instant download pdf
miatalafeer
 
M4_DAR_part1. module part 4 analystics with r
LalithauLali
 
Data mining for the masses, Chapter 4, Using R instead of Rapidminer
Ulrik Hørlyk Hjort
 
Advanced Data Visualization in R- Somes Examples.
Dr. Volkan OBAN
 
K10765 Matlab 3D Mesh Plots
Shraddhey Bhandari
 
R graphics
DHIVYADEVAKI
 
Geospatial Data in R
Barry Rowlingson
 
data-visualization.pdf
Juan José Rivas
 
R getting spatial
FAO
 
10. R getting spatial
ExternalEvents
 
Manual "The meuse data set"
MauricioTics2016
 
Data Exploration and Visualization with R
Yanchang Zhao
 

More from Dr. Volkan OBAN (20)

PDF
Conference Paper:IMAGE PROCESSING AND OBJECT DETECTION APPLICATION: INSURANCE...
Dr. Volkan OBAN
 
PDF
Covid19py Python Package - Example
Dr. Volkan OBAN
 
PDF
Object detection with Python
Dr. Volkan OBAN
 
PDF
Python - Rastgele Orman(Random Forest) Parametreleri
Dr. Volkan OBAN
 
DOCX
Linear Programming wi̇th R - Examples
Dr. Volkan OBAN
 
DOCX
"optrees" package in R and examples.(optrees:finds optimal trees in weighted ...
Dr. Volkan OBAN
 
DOCX
k-means Clustering in Python
Dr. Volkan OBAN
 
DOCX
Naive Bayes Example using R
Dr. Volkan OBAN
 
DOCX
R forecasting Example
Dr. Volkan OBAN
 
DOCX
k-means Clustering and Custergram with R
Dr. Volkan OBAN
 
PDF
Data Science and its Relationship to Big Data and Data-Driven Decision Making
Dr. Volkan OBAN
 
DOCX
Data Visualization with R.ggplot2 and its extensions examples.
Dr. Volkan OBAN
 
PDF
Scikit-learn Cheatsheet-Python
Dr. Volkan OBAN
 
PDF
Python Pandas for Data Science cheatsheet
Dr. Volkan OBAN
 
PDF
Pandas,scipy,numpy cheatsheet
Dr. Volkan OBAN
 
PPTX
ReporteRs package in R. forming powerpoint documents-an example
Dr. Volkan OBAN
 
DOCX
R Machine Learning packages( generally used)
Dr. Volkan OBAN
 
DOCX
Mosaic plot in R.
Dr. Volkan OBAN
 
DOCX
imager package in R and examples..
Dr. Volkan OBAN
 
PDF
R-Data table Cheat Sheet
Dr. Volkan OBAN
 
Conference Paper:IMAGE PROCESSING AND OBJECT DETECTION APPLICATION: INSURANCE...
Dr. Volkan OBAN
 
Covid19py Python Package - Example
Dr. Volkan OBAN
 
Object detection with Python
Dr. Volkan OBAN
 
Python - Rastgele Orman(Random Forest) Parametreleri
Dr. Volkan OBAN
 
Linear Programming wi̇th R - Examples
Dr. Volkan OBAN
 
"optrees" package in R and examples.(optrees:finds optimal trees in weighted ...
Dr. Volkan OBAN
 
k-means Clustering in Python
Dr. Volkan OBAN
 
Naive Bayes Example using R
Dr. Volkan OBAN
 
R forecasting Example
Dr. Volkan OBAN
 
k-means Clustering and Custergram with R
Dr. Volkan OBAN
 
Data Science and its Relationship to Big Data and Data-Driven Decision Making
Dr. Volkan OBAN
 
Data Visualization with R.ggplot2 and its extensions examples.
Dr. Volkan OBAN
 
Scikit-learn Cheatsheet-Python
Dr. Volkan OBAN
 
Python Pandas for Data Science cheatsheet
Dr. Volkan OBAN
 
Pandas,scipy,numpy cheatsheet
Dr. Volkan OBAN
 
ReporteRs package in R. forming powerpoint documents-an example
Dr. Volkan OBAN
 
R Machine Learning packages( generally used)
Dr. Volkan OBAN
 
Mosaic plot in R.
Dr. Volkan OBAN
 
imager package in R and examples..
Dr. Volkan OBAN
 
R-Data table Cheat Sheet
Dr. Volkan OBAN
 
Ad

Recently uploaded (20)

PDF
apidays Helsinki & North 2025 - REST in Peace? Hunting the Dominant Design fo...
apidays
 
PPTX
apidays Helsinki & North 2025 - From Chaos to Clarity: Designing (AI-Ready) A...
apidays
 
PPTX
Listify-Intelligent-Voice-to-Catalog-Agent.pptx
nareshkottees
 
PDF
apidays Helsinki & North 2025 - API-Powered Journeys: Mobility in an API-Driv...
apidays
 
PPTX
ER_Model_with_Diagrams_Presentation.pptx
dharaadhvaryu1992
 
PPTX
apidays Helsinki & North 2025 - Running a Successful API Program: Best Practi...
apidays
 
PPTX
apidays Singapore 2025 - From Data to Insights: Building AI-Powered Data APIs...
apidays
 
PDF
Avatar for apidays apidays PRO June 07, 2025 0 5 apidays Helsinki & North 2...
apidays
 
PPTX
apidays Singapore 2025 - The Quest for the Greenest LLM , Jean Philippe Ehre...
apidays
 
PPTX
apidays Helsinki & North 2025 - APIs at Scale: Designing for Alignment, Trust...
apidays
 
PPTX
ER_Model_Relationship_in_DBMS_Presentation.pptx
dharaadhvaryu1992
 
PPTX
Module-5-Measures-of-Central-Tendency-Grouped-Data-1.pptx
lacsonjhoma0407
 
PPTX
Advanced_NLP_with_Transformers_PPT_final 50.pptx
Shiwani Gupta
 
PDF
OOPs with Java_unit2.pdf. sarthak bookkk
Sarthak964187
 
PDF
Simplifying Document Processing with Docling for AI Applications.pdf
Tamanna
 
PPTX
apidays Munich 2025 - Building an AWS Serverless Application with Terraform, ...
apidays
 
PDF
apidays Helsinki & North 2025 - How (not) to run a Graphql Stewardship Group,...
apidays
 
PDF
The European Business Wallet: Why It Matters and How It Powers the EUDI Ecosy...
Lal Chandran
 
PDF
apidays Helsinki & North 2025 - APIs in the healthcare sector: hospitals inte...
apidays
 
PDF
Development and validation of the Japanese version of the Organizational Matt...
Yoga Tokuyoshi
 
apidays Helsinki & North 2025 - REST in Peace? Hunting the Dominant Design fo...
apidays
 
apidays Helsinki & North 2025 - From Chaos to Clarity: Designing (AI-Ready) A...
apidays
 
Listify-Intelligent-Voice-to-Catalog-Agent.pptx
nareshkottees
 
apidays Helsinki & North 2025 - API-Powered Journeys: Mobility in an API-Driv...
apidays
 
ER_Model_with_Diagrams_Presentation.pptx
dharaadhvaryu1992
 
apidays Helsinki & North 2025 - Running a Successful API Program: Best Practi...
apidays
 
apidays Singapore 2025 - From Data to Insights: Building AI-Powered Data APIs...
apidays
 
Avatar for apidays apidays PRO June 07, 2025 0 5 apidays Helsinki & North 2...
apidays
 
apidays Singapore 2025 - The Quest for the Greenest LLM , Jean Philippe Ehre...
apidays
 
apidays Helsinki & North 2025 - APIs at Scale: Designing for Alignment, Trust...
apidays
 
ER_Model_Relationship_in_DBMS_Presentation.pptx
dharaadhvaryu1992
 
Module-5-Measures-of-Central-Tendency-Grouped-Data-1.pptx
lacsonjhoma0407
 
Advanced_NLP_with_Transformers_PPT_final 50.pptx
Shiwani Gupta
 
OOPs with Java_unit2.pdf. sarthak bookkk
Sarthak964187
 
Simplifying Document Processing with Docling for AI Applications.pdf
Tamanna
 
apidays Munich 2025 - Building an AWS Serverless Application with Terraform, ...
apidays
 
apidays Helsinki & North 2025 - How (not) to run a Graphql Stewardship Group,...
apidays
 
The European Business Wallet: Why It Matters and How It Powers the EUDI Ecosy...
Lal Chandran
 
apidays Helsinki & North 2025 - APIs in the healthcare sector: hospitals inte...
apidays
 
Development and validation of the Japanese version of the Organizational Matt...
Yoga Tokuyoshi
 
Ad

Plot3D Package and Example in R.-Data visualizat,on

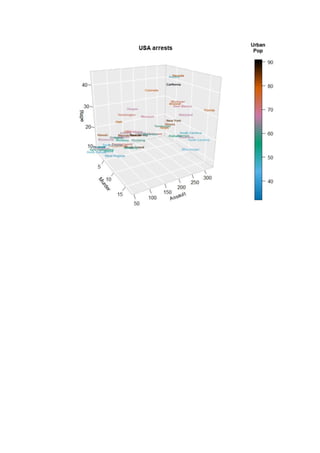
  • 1. Prepared by Volkan OBAN Plot3D package in R and examples,etc. Reference: http://www.sthda.com/english/wiki/impressive-package-for-3d-and-4d-graph-r- software-and-data-visualization text3D: plot 3-dimensionnal texts The function text3D() is used as follow: text3D(x, y, z, labels, ...) The USArrests data sets will be used in the example below: data(USArrests) with(USArrests, text3D(Murder, Assault, Rape, labels = rownames(USArrests), colvar = UrbanPop, col = gg.col(100), theta = 60, phi = 20, xlab = "Murder", ylab = "Assault", zlab = "Rape", main = "USA arrests", cex = 0.6, bty = "g", ticktype = "detailed", d = 2, clab = c("Urban","Pop"), adj = 0.5, font = 2))
  • 3. # Plot texts with(USArrests, text3D(Murder, Assault, Rape, labels = rownames(USArrests), colvar = UrbanPop, col = gg.col(100), theta = 60, phi = 20, xlab = "Murder", ylab = "Assault", zlab = "Rape", main = "USA arrests", cex = 0.6, bty = "g", ticktype = "detailed", d = 2, clab = c("Urban","Pop"), adj = 0.5, font = 2)) # Add points with(USArrests, scatter3D(Murder, Assault, Rape - 1, colvar = UrbanPop, col = gg.col(100), type = "h", pch = ".", add = TRUE)) plotdev(xlim = c(0, 10), ylim = c(40, 150), zlim = c(7, 25))
  • 4. Histogram3D data(VADeaths) # hist3D and ribbon3D with greyish background, rotated, rescaled,... hist3D(z = VADeaths, scale = FALSE, expand = 0.01, bty = "g", phi = 20, col = "#0072B2", border = "black", shade = 0.2, ltheta = 90, space = 0.3, ticktype = "detailed", d = 2)
  • 5. hist3D (x = 1:5, y = 1:4, z = VADeaths, bty = "g", phi = 20, theta = -60, xlab = "", ylab = "", zlab = "", main = "VADeaths", col = "#0072B2", border = "black", shade = 0.8, ticktype = "detailed", space = 0.15, d = 2, cex.axis = 1e-9) # Use text3D to label x axis text3D(x = 1:5, y = rep(0.5, 5), z = rep(3, 5), labels = rownames(VADeaths), add = TRUE, adj = 0) # Use text3D to label yaxis text3D(x = rep(1, 4), y = 1:4, z = rep(0, 4), labels = colnames(VADeaths), add = TRUE, adj = 1)
  • 9. Example: x0 <- c(0, 0, 0, 0) > y0 <- c(0, 0, 0, 0) > z0 <- c(0, 0, 0, 0) > x1 <- c(0.89, -0.46, 0.99, 0.96) > y1 <- c(0.36, 0.88, 0.02, 0.06) > z1 <- c(-0.28, 0.09, 0.05, 0.24) > cols <- c("#1B9E77", "#D95F02", "#7570B3", "#E7298A") > arrows3D(x0, y0, z0, x1, y1, z1, colvar = x1^2, col = cols, + lwd = 2, d = 3, clab = c("Quality", "score"), + main = "Arrows 3D", bty ="g", ticktype = "detailed") > # Add starting point of arrow > points3D(x0, y0, z0, add = TRUE, col="darkred", + colkey = FALSE, pch = 19, cex = 1) > # Add labels to the arrows > text3D(x1, y1, z1, c("Sepal.L", "Sepal.W", "Petal.L", "Petal.W"), + colvar = x1^2, col = cols, add=TRUE, colkey = FALSE)
  • 10. EXAMPLE: data(iris) x <- iris$Sepal.Length y <- iris$Petal.Length z <- iris$Sepal.Width scatter3D(x, y, z, pch = 18, bty = "u", colkey = FALSE, + main ="bty= 'u'", col.panel ="steelblue", expand =0.4, + col.grid = "darkblue")
  • 12. > scatter3D(x, y, z, bty = "g", pch = 18, col = gg.col(100)) > # ramp.col: custom palettes > scatter3D(x, y, z, bty = "g", pch = 18, + col = ramp.col(c("blue", "yellow", "red")) )
  • 13. > scatter3D(x, y, z, phi = 0, bty = "g", + pch = 20, cex = 2, ticktype = "detailed")
  • 14. scatter3D(x, y, z, phi = 0, bty = "g", type = "l", ticktype = "detailed", lwd = 4)
  • 15. scatter3D(x, y, z, phi = 0, bty = "g", type = "h", + ticktype = "detailed", pch = 19, cex = 0.5)
  • 16. > x <- mtcars$wt > y <- mtcars$disp > z <- mtcars$mpg > # Compute the linear regression (z = ax + by + d) > fit <- lm(z ~ x + y) > # predict values on regular xy grid > grid.lines = 26 > x.pred <- seq(min(x), max(x), length.out = grid.lines) > y.pred <- seq(min(y), max(y), length.out = grid.lines) > xy <- expand.grid( x = x.pred, y = y.pred) > z.pred <- matrix(predict(fit, newdata = xy), + nrow = grid.lines, ncol = grid.lines) > # fitted points for droplines to surface > fitpoints <- predict(fit) > # scatter plot with regression plane > scatter3D(x, y, z, pch = 18, cex = 2, + theta = 20, phi = 20, ticktype = "detailed", + xlab = "wt", ylab = "disp", zlab = "mpg", + surf = list(x = x.pred, y = y.pred, z = z.pred, + facets = NA, fit = fitpoints), main = "mtcars")