PostgreSQL Performance Problems: Monitoring and Alerting
Download as PPTX, PDF0 likes192 views

The document discusses PostgreSQL performance problems, focusing on monitoring and alerting tools to identify and resolve issues related to performance tuning. It highlights standard statistics views within PostgreSQL, as well as the use of extensions like pg_stat_statements for tracking query performance. Additionally, it covers various open-source and third-party monitoring solutions to assist in maintaining database efficiency.


PostgreSQL Performance Problems: Monitoring and Alerting
- 1. PostgreSQL Performance Problems: Monitoring and Alerting
- 2. Grant Fritchey DevOps Advocate Microsoft Data Platform MVP AWS Community Builder About me [email protected] scarydba.com @gfritchey linkedin.com/in/grant-fritchey
- 3. Ryan Booz PostgreSQL & DevOps Advocate @ryanbooz About me /in/ryanbooz www.softwareandbooz.com youtube.com/@ryanbooz
- 4. Introduction
- 5. • Understand common performance problems and how to spot them • Develop knowledge about the tools within PostgreSQL that show performance issues • Learn about open source and 3rd party monitoring solutions Goals
- 6. Most Common Database Problems • Performance • Scalability • Security • Multiple platforms • Data integration & integrity • Compliance
- 7. Today’s Focus, Performance Tuning
- 9. Actual Performance Tuning Identify Poorly Performing Queries Examine Code and Execution Plans Implement Potential Solution Validate Improvement Deploy To Production
- 10. Questions?
- 11. Standard Tools For Performance Metrics
- 13. Statistics Views • There are many. Each release tends to add more, or more detail • Most standard views ship with multiple versions: • "all" view – contains a row for all objects of that type • "sys" view – contains a row only for system objects of that type • "user" view – contains a row only for user objects of that type
- 14. Standard Go-to Statistics Views General • pg_stat_database • pg_stat_(all/sys/user)_tables • pg_stat_(all/sys/user)_indexes • pg_stat_io (PostgreSQL 16+) For replication • pg_stat_replication • pg_stat_replication_slots • pg_stat_subscription • pg_stat_bgwriter • pg_stat_archiver • pg_stat_wal
- 15. pg_stat_database • High-level statistics about each database • Transaction counts • Blocks used from cache or disk • Tuples (rows) inserted, updated, deleted, etc. • Deadlocks • Session stats • And more!
- 16. pg_stat_*_tables • Some similarity to database statistics, but at the table level • Tuple inserts, updates, deletes, hot updates, live, dead, etc. • Time of last: • table scan • seq scan • vacuum/autovacuum • analyze/autoanalyzer • And more!
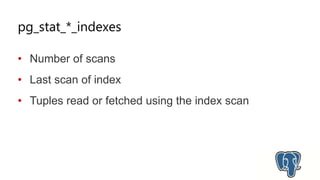
- 18. pg_stat_*_indexes • Number of scans • Last scan of index • Tuples read or fetched using the index scan
- 19. pg_stat_io • New in PostgreSQL 16 • Part of the 'contrib' modules • I/O related statistics based on backend type, object type, and context • Helpful for tuning • 'shared_buffers' (page cache) • Checkpointer inefficiency • Issues with background jobs
- 20. What is pg_stat_statements? • An extension included with PostgreSQL 8.4+ • It is part of the contrib module but not enabled by default • Must be loaded via ‘shared_preload_libraries’ in postgresql.conf • Tracks aggregated statistics of all queries in the cluster • Installing the extension in the database creates the necessary views to query the data
- 21. • Every dbid, userid, and queryid • Stats are grouped based on query structure and final ID as determined by an internal hash calculation How does it store aggregates?
- 22. How does it identify queries? SELECT id, name FROM table1 WHERE id = 1000; SELECT id, name FROM table1 WHERE id = $1; SELECT id, name FROM table1 WHERE id IN (1000,2000,3000); SELECT id, name FROM table1 WHERE id IN ($1,$2,$3);
- 23. pg_stat_statement statistics • Execution Time (total/min/max/mean/stddev) • Planning Time (total/min/max/mean/stddev) • Calls (total) • Rows (total) • Buffers (shared/local/temp) • read/hit/dirtied/written • read/write time • WAL
- 24. 39 Columns of data (as of PG16)
- 25. Name |Value -------------------+----------------------- userid |16422 dbid |16434 queryid |-6155333619461995114 query |SELECT id, name FROM... plans |0 total_plan_time |0.0 min_plan_time |0.0 max_plan_time |0.0 mean_plan_time |0.0 stddev_plan_time |0.0 calls |151 total_exec_time |8.489053 min_exec_time |0.013751 max_exec_time |1.356096 mean_exec_time |0.056218894039735096 stddev_exec_time |0.11851139585068957 rows |151 shared_blks_hit |450 shared_blks_read |3
- 26. All statistics are cumulative from the last restart* *or reset by a superuser
- 27. Caveats • PostgreSQL 13 • modified column names to include planning statistics • PostgreSQL 14 • Must set “compute_query_id”=true in postgresql.conf • Includes informational view for allocation and “last reset” information
- 28. pg_stat_*_indexes • Number of scans • Last scan of index • Tuples read or fetched using the index scan
- 29. pg_stat_io • New in PostgreSQL 16 • Part of the 'contrib' modules • I/O related statistics based on backend type, object type, and context • Helpful for tuning • 'shared_buffers' (page cache) • Checkpointer inefficiency • Issues with background jobs
- 30. pg_stat_kcache • Open-source extension that provides statistics about real reads and writes done at the filesystem layer • Requires pg_stat_statements to be installed • Must be added to the 'shared_preload_libraries' configuration parameter • Query-level filesystem statistics • *Not often available in hosted environments
- 31. • AWS/Azure/GCP have some limited tooling to track/display some of this data Postgres Tools for Data Collection
- 33. Common Tools • pgAdmin and other IDEs • Numerous open-source, Grafana-based tools • pgWatch • pgDash • pg_stat_monitor • auto_explain • Some recent Python-based solutions, but they aren't dynamic
- 34. Pros/cons • Native tools, where available, are used by many, well documented, and usually easy to get started with (at least SQL Server) • However, they can only go as far as the tool allows, and they rarely have exactly the right documentation to understand how to act upon the data • Not all of these tools help you bring correlation between the graphs and issues. • Things are (at least slightly) desperate.
- 35. • Statistics determine plan choice • Customizable per server, table, and column • Asynchronous process maintains statistics • Manually update with ANALYZE Cost-based Optimizer
- 36. • Histogram of column values • Defaults to 100 buckets • Helpful views: • pg_catalog.pg_stats • pg_catalog.pg_stat_user_tables Statistics
- 37. • EXPLAIN = Estimated plan • EXPLAIN ANALYZE = Actual plan • EXPLAIN (ANALYZE,BUFFERS) • Query plan with disk IO • EXPLAIN (ANALYZE,BUFFERS,VERBOSE) • Additional details on columns, schemas, etc. EXPLAIN in Practice
- 38. • Inverted tree representation • There is no built-in visual execution plan • EXPLAIN provides textual plan • pgAdmin does attempt some visualizations • Websites for visualizations and suggestions • https://www.pgmustard.com/ • https://explain.depesz.com/ EXPLAIN
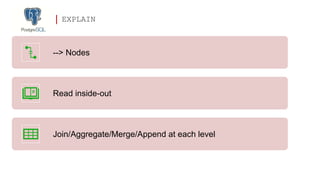
- 39. --> Nodes Read inside-out Join/Aggregate/Merge/Append at each level EXPLAIN
- 40. EXPLAIN (ANALYZE, BUFFERS) SELECT customer_name, count(*), date_part('year',order_date)::int order_year FROM sales.orders o INNER JOIN sales.customers c ON o.customer_id=c.customer_id WHERE c.customer_id=100 GROUP BY customer_name,order_year ORDER BY order_year DESC; GroupAggregate (cost=1827.91..1830.76 rows=102 width=35) (actual time=11.956..13.754 rows=4 loops=1) Group Key: ((date_part('year'::text, (o.order_date)::timestamp without time zone))::integer), c.customer_name Buffers: shared hit=903 -> Sort (cost=1827.91..1828.18 rows=107 width=27) (actual time=11.700..12.686 rows=107 loops=1) Sort Key: ((date_part('year'::text, (o.order_date)::timestamp without time zone))::integer) DESC, c.customer_name Sort Method: quicksort Memory: 33kB Buffers: shared hit=903 -> Nested Loop (cost=0.28..1824.30 rows=107 width=27) (actual time=0.113..10.649 rows=107 loops=1) Buffers: shared hit=903 -> Index Scan using pk_sales_customers on customers c (cost=0.28..2.49 rows=1 width=27) Index Cond: (customer_id = 100) Buffers: shared hit=3 -> Seq Scan on orders o (cost=0.00..1819.94 rows=107 width=8) (actual time=0.053..8.413 rows=107 loops=1) Filter: (customer_id = 100) Rows Removed by Filter: 73488 Buffers: shared hit=900 Planning Time: 0.267 ms Execution Time: 13.934 ms
- 41. GroupAggregate (cost=1827.91..1830.76 rows=102 width=35) (actual time=11.956..13.754 rows=4 loops=1) Group Key: ((date_part('year'::text, (o.order_date)::timestamp without time zone))::integer), c.customer_name Buffers: shared hit=903 -> Sort (cost=1827.91..1828.18 rows=107 width=27) (actual time=11.700..12.686 rows=107 loops=1) Sort Key: ((date_part('year'::text, (o.order_date)::timestamp without time zone))::integer) DESC, c.customer_name Sort Method: quicksort Memory: 33kB Buffers: shared hit=903 -> Nested Loop (cost=0.28..1824.30 rows=107 width=27) (actual time=0.113..10.649 rows=107 loops=1) Buffers: shared hit=903 -> Index Scan using pk_sales_customers on customers c (cost=0.28..2.49 rows=1 width=27) Index Cond: (customer_id = 100) Buffers: shared hit=3 -> Seq Scan on orders o (cost=0.00..1819.94 rows=107 width=8) (actual time=0.053..8.413 rows=107 loops=1) Filter: (customer_id = 100) Rows Removed by Filter: 73488 Buffers: shared hit=900 Planning Time: 0.267 ms Execution Time: 13.934 ms
- 42. • Sequence scan (seq scan) • Index scan • Index-only scan Primary Scan nodes
- 43. • Nested Loop • Hash Join • Merge Join Primary join nodes Explain Glossary: https://www.pgmustard.com/docs/explain
- 44. Questions?
- 45. 3rd Party & Open Source Tools
- 46. Open Source Monitoring Solutions Nagios Core PgHero pgCluu pgWatch pgAdmin
- 47. Paid Monitoring Solutions DataDog Better Stack pgDash pgAnalyze Redgate SQL Monitor
- 48. Wrap-up
- 49. • Understand the common performance problems and how to spot them • Develop knowledge about the tools within PostgreSQL that show performance issues • Learn about open source and 3rd party monitoring solutions Goals
- 50. Grant Fritchey DevOps Advocate Microsoft Data Platform MVP AWS Community Builder About me [email protected] scarydba.com @gfritchey linkedin.com/in/grant-fritchey
- 51. Ryan Booz PostgreSQL & DevOps Advocate @ryanbooz About me /in/ryanbooz www.softwareandbooz.com youtube.com/@ryanbooz
- 52. Questions?
Editor's Notes
- #5: sunrise-1371391077dmN.jpg (1920×1280) (publicdomainpictures.net)
- #6: 12.jpg (852×480) (picdn.net)
- #7: Study Identifies Top Five Most Challenging Database Management Issues (datavail.com) 5 Common Database Management Challenges & How to Solve Them (hackread.com) Blog: 9 Common Database Management Challenges and How to Fix Them | Tudip Top 10 Big Data Challenges and How to Address Them (techtarget.com) dumpster+fire.jpg (400×281) (bp.blogspot.com)
- #11: Big question mark | in Ipswich | Benjamin Reay | Flickr
- #32: www.maxpixel.net | 522: Connection timed out
- #45: Big question mark | in Ipswich | Benjamin Reay | Flickr
- #46: tools.jpg (1200×675) (areweconnected.com)
- #47: circuit board - Bing images
- #48: Nagios is a log tool with a PostgreSQL add-on. pgWatch, pgHero, pgAdmin, pgCluu are database tools
- #49: DataDog and Better Stack are log monitor tools that add additional metrics. The other three are all focused database tools, but of the three, only SQL Monitor works on more than just PostgreSQL
- #50: moon-lunar-sky-night.jpg (910×683) (wallpaperflare.com)
- #51: 12.jpg (852×480) (picdn.net)
- #54: Big question mark | in Ipswich | Benjamin Reay | Flickr