Power BI is a business analytics service that enables you to see all of your data through a single pane of glass. Live Power BI dashboards and reports...
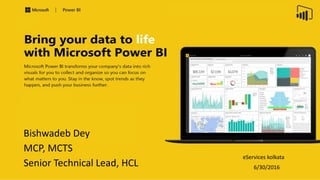
Introduction to Power BI to make smart decisionsVIVEK GURURANI
Power BI: Business intelligence like never before!
Power BI is a tool that allows accounting and finance managers and professionals to have relevant information at the right time to make strategic decisions in a flexible, centralized, and secure way. Transform your business with predictive analytics, data visualization, and information in real-time, thanks to Power BI.
Presentation Agenda:
1. Introduction to Power BI
2. Why would your business need Power BI?
3. Power BI Architecture
4. Data Sanitization & Cleansing Capabilities
5. Analytical Insights
6. Generating Department Wise Reports & Visualizations
7. Latest & Upcoming Power BI features
8. Live Q&A
Get technically equipped to grow and build your Power BI (Business Intelligence) practice, enabling you to offer new solutions and services to customers. With Power BI, you can transform your customers' data into rich visuals they can collect and organize, helping them focus on what matters most to their businesses.
Power BI has become a product with a ton of exciting features. This presentation will give an overview of some of them, including Power BI Desktop, Power BI service, what’s new, integration with other services, Power BI premium, and administration.
Power BI is a self-service business intelligence tool that allows users to analyze and visualize data. It consists of Power BI Desktop, the Power BI web service, and the Power BI mobile app. Power BI Desktop is used to build reports and dashboards locally, while the web service allows users to publish, share, and collaborate on reports and dashboards online. To create a dashboard in Power BI, a user would connect to a data source, build visualizations with the data, publish the report to the web, combine reports into a dashboard, and then share the dashboard.
Power BI is a business intelligence tool from Microsoft that allows users to analyze data, clean it, and visualize it in interactive reports and dashboards. It includes several components like Power Query for data transformation, Power Pivot for data modeling, and Power View for data visualization. Power BI Desktop is used to create reports locally, while Power BI Service hosts reports and dashboards in the cloud. It supports connecting to over 100 data sources and creating over 250 visualizations to provide insights from data.
This document provides an overview of Microsoft Power BI, including its history, key features, and capabilities. It describes how Power BI allows users to connect to various data sources, perform data transformation using Power Query, build interactive reports with Power View and Power Pivot, and create visualizations and dashboards to share insights. The document also discusses Power BI Desktop, the Power BI service, and how to publish reports and dashboards to the web for sharing.
Power BI Full Course | Power BI Tutorial for Beginners | EdurekaEdureka!
YouTube Link: https://youtu.be/3u7MQz1EyPY
** Power BI Training - https://www.edureka.co/power-bi-training **
This Edureka PPT on "Power BI Full Course" will help you understand and learn Power BI in detail. This Power BI Tutorial is ideal for both beginners as well as professionals who want to master up their Power BI concepts.
Power BI Desktop | Power BI Tutorial | Power BI Training | EdurekaEdureka!
This Edureka "Power BI Desktop" tutorial will help you to understand what is Power BI Desktop with examples and demo. Below are the topics covered in this tutorial:
1. Why Power BI?
2. What Power BI?
3. Who use Power BI?
4. Flow of Work
5. Power BI Trends
A simplified version of my presentation:
- PowerBI solution architecture
- Key steps to visualize data in PowerBI
- PowerBI Demo
- R in PowerBI
- Custom Visuals
- PowerBI Report Server
- Azure services and Power BI
Power BI Training | Getting Started with Power BI | Power BI Tutorial | Power...Edureka!
This Edureka tutorial on "Getting started with Power BI" will provide you the fundamental knowledge of Power BI. Below are the topics covered in this tutorial:
1. What is Self Service Business Intelligence?
2. Why Power BI?
3. What is Power BI?
4. Demo on Power BI
Power bi (1)Power BI Online Training Hyderabad | power bi online training ben...Big IT Trainings
Power BI Desktop integrates proven Microsoft technologies the powerful Query engine, data modeling, and visualizations. All sorts of different data sources, then combine and shape them in ways that facilitate making interesting, in Power BI online Training.
Explain about power BI Overview from Power BI Desktop, Power BI Service, Power BI Report Server and Power BI Mobile that consume all BI Data from Dataset and datamodel
This document provides an overview of Power BI, including:
- A history of Power BI and its tools over time from 2009 to present day.
- An overview of the different Power BI tools for preparing, building, exploring and reporting on data.
- How Power BI fits into the broader business intelligence ecosystem for preparing, modeling, visualizing and sharing data and reports.
- The capabilities Power BI provides for analysts, IT professionals and business users.
Power BI is a self-service business intelligence tool that allows users to analyze data and create reports and visualizations. It includes components for data discovery, analysis, and visualization both on-premises using Excel and in the cloud using the Power BI service. The tool integrates with Office 365 and allows users to discover, visualize, and share insights from data.
Power BI Overview, Deployment and GovernanceJames Serra
This document provides an overview of external sharing in Power BI using Azure Active Directory Business-to-Business (Azure B2B) collaboration. Azure B2B allows Power BI content to be securely distributed to guest users outside the organization while maintaining control over internal data. There are three main approaches for sharing - assigning Pro licenses manually, using guest's own licenses, or sharing to guests via Power BI Premium capacity. Azure B2B handles invitations, authentication, and governance policies to control external sharing. All guest actions are audited. Conditional access policies can also be enforced for guests.
The document introduces Power BI tools for self-service business intelligence including Excel add-ins like Power Query, PowerPivot, Power View, and Power Map. It also discusses Power BI for Office 365, the Power BI Preview, Power BI Designer, and the Power BI app. The presenter demonstrates these tools and provides resources for learning more.
This slide deck explains in a comprehensive way what Power BI is, how the Power BI architecture looks like and what the usage scenarios are for using Power BI and related tools
This document provides an introduction to Power BI, a business intelligence tool for data visualization. It discusses how Power BI helps organizations make more data-driven decisions by combining business analytics, data mining, visualization and infrastructure. Key features of Power BI include rich dashboards, report publishing, no constraints on memory or speed, and no need for technical support. Power BI consists of desktop, service and mobile app components and allows users to connect to data, model and format it, create visualizations, and publish reports.
Power BI is a business analytics service by Microsoft. It aims to provide interactive visualizations and business intelligence capabilities with an interface simple enough for end users to create their own reports and dashboards.
This presentation will give you an overview of what Microsoft Power BI is. What are its features. Why it is an upcoming popular Data Visualization tool in the market. How to use it and comparison with other Visualization tools.
Power BI is a cloud-based business analytics service that allows users to bring their data together and gain insights. It provides a single view of critical business data through live dashboards and rich interactive reports. Gartner has positioned Microsoft as a leader in business intelligence and analytics platforms for nine consecutive years based on its vision. The demo showcases how to create a Power BI account, import and transform different data sources to build a data model, create reports and columns/measures, and publish reports to the web.
Power BI is a business analytics service that allows users to connect to data, model and visualize data, and share insights. It includes the Power BI service, Power BI Desktop, and Power BI Premium. The Power BI service allows users to publish reports and dashboards to a cloud-based workspace for collaboration and sharing. Power BI Desktop is a free desktop application for building reports and data models. Power BI Premium provides dedicated cloud capacity for large-scale deployments and on-premises gateways.
Microsoft Power BI is a cloud-based business analytics service. This document provides an overview of Power BI and its key capabilities. It discusses connecting to various data sources, creating reports and dashboards, exploring data using natural language queries, and sharing insights across an organization. The document also describes the Power BI online service experience and how to work with reports, dashboards, and collaborate with others.
This document discusses Power BI, a Microsoft tool for data visualization and analytics. It covers what Power BI is, its components like Power Query, Power Pivot, and Power View. It also discusses the building blocks of Power BI like datasets, reports, dashboards and tiles. The document demonstrates how to install Power BI and introduces some key concepts like DAX and different types of visualizations. It aims to provide an overview of Power BI, its capabilities and how to use some of its main features.
Power BI Tutorial For Beginners | Power BI Tutorial | Power BI Demo | Power B...Edureka!
( Power BI Training - https://www.edureka.co/power-bi-training )
This Edureka videoon "Power BI Tutorial" will provide you with the fundamental knowledge on Power BI (Blog: https://goo.gl/uFTDU3). Below are the topics covered in this tutorial:
1. Why do we need Business Intelligence?
2. What is Self Service Business Intelligence?
3. Why Power BI?
4. What is Power BI?
5. Demo: Report and Dashboard Creation
BI: new of the buzz words that everyone is talking about but what is it? How can it be used to make a impact in my organization? How do I get started? In this session, we will talk about it and show you a live example in Office 365's SharePoint Online.
Objectives/Outcomes: In this session, participants will learn:
1. What is BI
2. What is Microsoft's Power BI
3. Case Studies
4. How can I get it
Microsoft heeft enkele jaren geleden Power BI geïntroduceerd. Sindsdien hebben het gebruik en de toepassings-mogelijkheden van Power BI een vlucht genomen. Veel van de dashboards uit Power BI zie je terug in andere Microsoft toepassingen zoals bijvoorbeeld Office 365 (rapporten), Operations Management Suite en nog veel meer.
Tijdens dit webinar laten we zien wat je in de basis kunt doen met Power BI, waarbij we enkele eenvoudige voorbeelden laten zien. Hierbij zie je de mogelijkheden van Power BI, en laten we ook zien hoe Power BI kan worden geintegreerd in andere applicaties. Na dit webinar heeft u een beter beeld van de mogelijkheden met Power BI en heeft u een beter beeld van de wijze waarop Power BI in uw organisatie een rol kan spelen.
Rapportages en dashboards met Power BI
Webinar rapportages met Power BIPower BI is een cloud service van Microsoft waarmee u snel dashboards kunt maken, rapporten kunt delen en direct toegang hebt tot alle gegevens die belangrijk voor u zijn. Power BI bevat standaard dashboards voor veelgebruikte applicaties zoals Dynamics, Salesforce en Google Analytics. Het voordeel van Power BI is, dat je allerlei dataservices kunt koppelen om je eigen gegevens te verrijken. Doordat het een Cloud Service is, heb je overal toegang tot je data en kun je zonder extra kosten gebruik maken van de rekenkracht van Azure. Daarnaast is Power BI een relatief goedkope Business Intelligence tool en zijn er apps beschikbaar voor ieder device.
Webinar Power BI
Enkele concrete voorbeelden die tijdens het webinar aan bod komen:
- Maken van een eenvoudig dashboard
- hoe gebruik je standaard dashboards
- hoe koppel je gegensbronnen als Dynamics CRM of Dynamics Nav aan Power BI
- combineren van interne en externe gegevensbronnen
The Power of BI: A guided tour of Microsoft's Business Intelligence toolingJason Himmelstein
Having trouble keeping up with all of the changes in the BI space around SharePoint & Office 365? Feel like every time you think you understand what is going on Microsoft pivots (pun intended) yet again? You are not alone.
Now is the time to change all of that. Microsoft is investing heavily in how to make BI more efficient, repeatable, and with outputs that will make executives squeal with delight. From Excel to Power BI, the tooling is evolving so quickly that it takes real effort to keep up.
Presented to The Ottawa IT Community Meetup Group (Ottawa SQL - PASS Chapter) on Thursday September 19
Powerful Self-Service BI in Excel 2013 - Data search and discovery with Power Query (formerly "Data Explorer"), analyzing and modeling with Power Pivot, visualizing and exploring with Power View and Power Map (formerly codename "GeoFlow")
This document provides an introduction to basic HTML and CSS elements for building web pages. It begins with an overview of the document structure, including the <html>, <head>, <title>, and <body> tags. It then covers common page elements like headings, paragraphs, lists, links, and images. The document progresses to explaining how to style elements with fonts, colors, backgrounds and more using inline CSS styles. Later it introduces external CSS files, IDs and classes, and properties like margins, padding, borders. Exercises are included throughout to help learn and practice the concepts. The goal is to teach the reader enough to build their own basic profile page using HTML and CSS.
Power BI (Business Intelligence) is a new and emerging self-service business intelligence and business analytics framework that brings together and enhances a few key Microsoft technologies. Fundamentally, Power BI is considered a premium Office option, because Microsoft licenses it that way. We will answer the following questions:
◾What makes Power BI different from the Microsoft Office I have known for years?
◾What are the major Power BI features in Excel 2013 and 2010?
◾What are the major features for Power BI for Office 365?
◾How can our team license Power BI?
Medialinkers offers you the basics of HTML 5. If you are a beginner and want to learn basics of HTML tags just visit this presentation created by: http://www.medialinkers.org/
DAX and Power BI Training - 001 OverviewWill Harvey
Course & Power BI Overview: This is the first session in a course that primarily focuses on DAX and PowerPivot, but also teaches the surrounding tools such as Power Query, Power BI Desktop and PowerBI.com.
Power BI - Finally I can make decisions based on factsUlysses Maclaren
SSW's General Manager, Ulysses Maclaren, will take you through his personal journey of discovery into the world of Power BI.
Many companies have valuable data, but the challenge is being able to easily visualize it in a way that allows you to make decisions.
He will show in a live demo how Power BI allows even non-technical users to produce and share invaluable reports and dashboards.
Création de visuels personnalisésavec Power BI Visuals CLIDenys Chamberland
Contenu de présentation sur la Création de visuels personnalisés avec Power BI Visuals CLI lors de la session MSDEVMTL : Data Plateform, le 23 janvier 2017 au locaux de Microsoft Montréal
This document discusses using Visio and workflows in SharePoint 2010. It provides an overview of workflows and their benefits, describes the workflow authoring tools of SharePoint Designer and Visual Studio, discusses workflow security, and how Visio can be used to create workflow diagrams that can be imported into SharePoint Designer. It also outlines the requirements and provides an agenda for a demo of creating a basic Visio workflow and deploying it.
BI: new of the buzz words that everyone is talking about but what is it? How can it be used to make a impact in my organization? How do I get started? This session was delivered for SharePoint Saturday Reston.
Power BI for Office 365: Using SharePoint to Deliver Self-ServicePerficient, Inc.
The document discusses Microsoft's Power BI tools for self-service business intelligence (BI) and analytics. It describes the key components of Power BI, including Excel-based tools for self-service BI (Power Query, Power Pivot, Power View, Power Map) and Power BI capabilities available with Office 365, such as Power BI sites for collaboration and data management features. The document provides an overview of the Power BI tools and capabilities as well as examples of how they can be used to connect to data, build reports and dashboards, and share and consume BI content.
Power BI is a business analytics tool that allows users to visualize and analyze data from various sources. The presentation provided an introduction to Power BI capabilities, including connecting to data, building reports and dashboards, and publishing content. Attendees saw demonstrations of connecting Excel data, creating reports and dashboards, pinning visuals, and publishing a dashboard to SharePoint. Resources for learning more about Power BI were also shared.
Bringing your data to life using Power BI - SPS London 2016Chirag Patel
This document provides an overview of Power BI, including its key components and how to use them. Power BI Desktop allows users to connect to various data sources, transform the data using Power Query, build reports using Power Pivot and Power View, and publish dashboards to the Power BI service. The Power BI service allows users to build dashboards with tiles linked to reports, ask questions of the data using natural language, and access reports and dashboards on mobile devices. Office 365 Groups integration allows content to be shared and collaborated on within groups. The presenter provides demonstrations of connecting to data, building reports and dashboards, asking questions of the data, and using the mobile app.
Formulating Power BI Enterprise StrategyTeo Lachev
The document outlines an agenda for a presentation on formulating a Power BI enterprise strategy. The agenda includes introductions, presentations on how Power BI empowers businesses and planning a data access strategy, a question and answer session, and information about an upcoming two-day Power BI workshop. It also provides background information about the presenters and describes various Power BI tools and capabilities for business users, data analysts, BI professionals, and developers.
This document provides an agenda for the Sydney Business Intelligence User Group meeting in November 2014. The meeting will feature a presentation titled "Power BI – Beyond the Basics" presented by Iman Eftekhari of Agile BI. The presentation will cover the main features and capabilities of Power BI using real-world examples and scenarios. It will also discuss best practices and tips for getting the most out of Power BI. The document lists several sponsors of the event, including software companies that provide tools for business intelligence.
Power BI Create lightning fast dashboard with power bi & Its Components Vishal Pawar
Every data has meaning, but we had limitation to use data through big long running process Extraction, Transformation and Representation, but now Power BI solves your problem to kick start having Data extraction in Power Query, Data Modelling and Transformation in Power Pivot and reach data representation using power view and power map on demand any nearby device on your fingertips, You will learn all latest and greatest features of Power BI.
ESPC15 Power BI - The New Way to Quickly Build Powerful Dashboards (Level 300)Knut Relbe-Moe [MVP, MCT]
Learn how to use the new Power BI Designer to create powerful reports and dashboards, and how to use the new features of Power BI; Power BI dashboards; Connect live to on-premises Analysis Services models, live connectors to for instance Dynamics or SalesForce, and how to use the Power BI Designer to utilize this. Power BI Designer is a standalone Windows Desktop application that can be downloaded from the Power BI site. This application combines Power Query, Power Pivot Data Model and Power View into a seamless experience that will allow customers to build their Power BI elements in an offline fashion and then upload to the Power BI Service.
In this session you will:
- Learn about Power BI Designer
- Learn how to set up Power BI dashboards
- Learn about Power Query, Power Pivot and Power View
This document provides an overview of a lunch presentation about using Microsoft Power BI to modernize reporting capabilities. The agenda includes an overview of Power BI, key concepts and latest connectors, new features, sharing and collaboration capabilities, and a demo. It discusses Power BI's free and paid Pro versions, and how the presenters' company can help clients get started with Power BI through starter kits or more complex accelerators.
SharePoint Days Casablanca 2016 - Tout ce que vous devez savoir sur Power BI v2Benoit Jester
This document provides an overview of Power BI version 2. It introduces Power BI Desktop for creating reports and visualizations, PowerBI.com for publishing dashboards and connecting to data sources, and the Power BI mobile app. Key concepts discussed include dashboards, reports, datasets, tiles, and content packs. The document also demonstrates connecting to various data sources, integrating Power BI visualizations, and using the REST API. It concludes that Power BI is a powerful, easy to use, and extensible business intelligence tool.
Groupby -Power bi dashboard in hour by vishal pawar-Presentation Vishal Pawar
Power BI Dashboard in an hour with Various Slides.
Target Audience:
Useful for Develops and DBA those who want to know what is Power BI and How we can utilize various features.
Also session will be useful for anyone who wants learn Power BI from basic.
Abstract:
In this session, We will walk through various features of Power BI, How Power BI can transform your company’s data into rich visuals and Easy yet powerful Analytics solutions for your whole organization.
At end of session with following Power BI Dashboard example
sp_Blitz in Dashboard
SQL Server Info Dashboard
Twitter Dashboard
World Dashboard
Most important takeaways from session –
You will be learning basics of Power BI with the additional perk of analyzing sp_Blitz in Power BI.
Various features of Power BI making you from ZERO to HERO
After this session, you will be able to analyze data into Power BI
Power BI provides advanced data technology for transforming, storing, and presenting data. This technology can support advanced Excel users and data scientists. This presentation provides basics for Excel 2010 and 2013 users and information about O365 and SharePoint Online supporting shared use cases.
This document discusses exploring Puerto Rico open data using Power BI. It provides an overview of Power BI and its key components - Power Query for data extraction and transformation, Power Pivot for data modeling, and Power View and Power Map for data visualization. It then demonstrates using these tools to analyze and visualize open data from Puerto Rico, accessing the data through Power BI's self-service BI capabilities.
In Project Server, Power BI adds value in creating interactive reports and dashboards as it allows data connectivity with OData and other data sources. Power BI reporting can be used with both Project Online and Project Server.
This webinar gives you a platform to learn how to connect to Data Source - OData feed from Power BI. In this session, you will also learn how to create and publish reports and dashboards using the visual tools set available in Power BI desktop, and explore more on its features.
SqlSaturday#699 Power BI - Create a dashboard from zero to heroVishal Pawar
Every data has meaning, but we had limitation to use data through big long running process Extraction, Transformation and Representation, but now Power BI solves your problem to kick start having Data extraction in Power Query, Data Modelling and Transformation in Power Pivot and reach data representation using power view and power map on demand any nearby device on your fingertips.
Learn how to create Power BI Dashboard from scratch.
Making the Most of Power BI with SQL Server 2014 and AzurePerficient, Inc.
Perficient is a leading IT consulting firm that helps clients implement business-driven technology solutions. Power BI is a Microsoft tool that provides self-service business intelligence capabilities. It includes Excel tools like Power Query, Power Pivot and Power View, as well as cloud-based services like Power BI sites. Power BI can connect to various data sources on-premises or in the cloud. SQL Server 2014 features enhancements for in-memory analytics and Azure integration that provide performance boosts. Using Azure virtual machines and HDInsight is recommended for cloud-based SQL Server BI.
Microsoft Power BI is a business analytics tool that allows users to access, analyze, and visualize data from various sources. It offers self-service BI capabilities that enable end users to explore and gain insights from data. Power BI provides live dashboards, natural language querying, and content packs for popular SaaS solutions. It integrates with Microsoft products and allows sharing and collaboration on reports and dashboards. Signing up for a free Power BI account is quick and only requires a work or school email address.
This document discusses business intelligence (BI) solutions for Office 365. It begins by outlining the requirements for BI in Office 365, then describes several BI solutions including PerformancePoint Services, Visio Services, Power BI, Excel Services, and SQL Server Reporting Services. It focuses on self-service BI with Excel 2013 and Power BI for Office 365, providing demos of their features. Finally, it concludes by comparing Excel, advanced Excel BI, Excel Services, and Power BI for Office 365 and their uses.
Best practices to deliver data analytics to the business with power biSatya Shyam K Jayanty
Get your data to life with Power BI visualization and insights!
With the changing landscape of Power BI features it is essential to get hold of configuration and deployment practices within your data platform that will ensure you are on-par with compliance & security practices. In this session we will overview from the basics leading into advanced tricks on this landscape:
How to deploy Power BI?
How to implement configuration parameters and package BI features as a part of Office 365 roll out in your organisation?
What are newest features and enhancements on this Power BI landscape?
How to manage on-premise vs on-cloud connectivity?
How can you help and support the Power BI community as well?
Having said that within the objectives of this session, cloud computing is another aspect of this technology made is possible to get data within few clicks and ticks to the end-user. Let us review how to manage & connect on-premise data to cloud capabilities that can offer full advantage of data catalogue capabilities by keeping data secure as per Information Governance standards. Not just with nuts and bolts, performance is another aspect that every Admin is keeping up, let us look into few settings on how to maximize performance to optimize access to data as required. Gain understanding and insight into number of tools that are available for your Business Intelligence needs. There will be a showcase of events to demonstrate where to begin and how to proceed in BI world.
- D BI A Consulting
[email protected]
B6 - Using Office 365 groups in Power Bi - Marco RussoSPS Monaco
This document discusses using Office 365 groups with Power BI. It provides an overview of Power BI features like data sources, visualizations, and sharing/collaboration. It then covers specific topics like sharing dashboards, using OneDrive for Business, creating app workspaces (which generate Office 365 groups), adding members, and refreshing data uploaded from workbooks or the Power BI service.
You rely on spreadsheets every day to manage and track your business. But everyone knows the downfalls to a static spreadsheet.
Data comes from a variety of sources and needs to be compiled. By the time, you compile the data it is old. You are often faced with sea of numbers to comb through for insightful takeaways. Meanwhile, the information you need is not available at your fingertips. There is a better way.
Power BI brings the tools you need to understand what is happening with your business in an easy to use and access dashboard. The best part is that the data is represented in easy to communicate and clear charts and graphs.
In this webinar, Portal Solutions’ Daniel Cohen-Dumani and Rick Hinton discuss the benefits of Power BI, including:
- Leverage Existing Excel Solutions
- Keep Data Fresh
- Drill Down to Get Real Insights
- Get Answers Fast
- Create Alerts To Stay Informed
- Your Data Where You Are
AI and Data Privacy in 2025: Global TrendsInData Labs
In this infographic, we explore how businesses can implement effective governance frameworks to address AI data privacy. Understanding it is crucial for developing effective strategies that ensure compliance, safeguard customer trust, and leverage AI responsibly. Equip yourself with insights that can drive informed decision-making and position your organization for success in the future of data privacy.
This infographic contains:
-AI and data privacy: Key findings
-Statistics on AI data privacy in the today’s world
-Tips on how to overcome data privacy challenges
-Benefits of AI data security investments.
Keep up-to-date on how AI is reshaping privacy standards and what this entails for both individuals and organizations.
DevOpsDays Atlanta 2025 - Building 10x Development Organizations.pptxJustin Reock
Building 10x Organizations with Modern Productivity Metrics
10x developers may be a myth, but 10x organizations are very real, as proven by the influential study performed in the 1980s, ‘The Coding War Games.’
Right now, here in early 2025, we seem to be experiencing YAPP (Yet Another Productivity Philosophy), and that philosophy is converging on developer experience. It seems that with every new method we invent for the delivery of products, whether physical or virtual, we reinvent productivity philosophies to go alongside them.
But which of these approaches actually work? DORA? SPACE? DevEx? What should we invest in and create urgency behind today, so that we don’t find ourselves having the same discussion again in a decade?
Procurement Insights Cost To Value Guide.pptxJon Hansen
Procurement Insights integrated Historic Procurement Industry Archives, serves as a powerful complement — not a competitor — to other procurement industry firms. It fills critical gaps in depth, agility, and contextual insight that most traditional analyst and association models overlook.
Learn more about this value- driven proprietary service offering here.
Enhancing ICU Intelligence: How Our Functional Testing Enabled a Healthcare I...Impelsys Inc.
Impelsys provided a robust testing solution, leveraging a risk-based and requirement-mapped approach to validate ICU Connect and CritiXpert. A well-defined test suite was developed to assess data communication, clinical data collection, transformation, and visualization across integrated devices.
How Can I use the AI Hype in my Business Context?Daniel Lehner
𝙄𝙨 𝘼𝙄 𝙟𝙪𝙨𝙩 𝙝𝙮𝙥𝙚? 𝙊𝙧 𝙞𝙨 𝙞𝙩 𝙩𝙝𝙚 𝙜𝙖𝙢𝙚 𝙘𝙝𝙖𝙣𝙜𝙚𝙧 𝙮𝙤𝙪𝙧 𝙗𝙪𝙨𝙞𝙣𝙚𝙨𝙨 𝙣𝙚𝙚𝙙𝙨?
Everyone’s talking about AI but is anyone really using it to create real value?
Most companies want to leverage AI. Few know 𝗵𝗼𝘄.
✅ What exactly should you ask to find real AI opportunities?
✅ Which AI techniques actually fit your business?
✅ Is your data even ready for AI?
If you’re not sure, you’re not alone. This is a condensed version of the slides I presented at a Linkedin webinar for Tecnovy on 28.04.2025.
Big Data Analytics Quick Research Guide by Arthur MorganArthur Morgan
This is a Quick Research Guide (QRG).
QRGs include the following:
- A brief, high-level overview of the QRG topic.
- A milestone timeline for the QRG topic.
- Links to various free online resource materials to provide a deeper dive into the QRG topic.
- Conclusion and a recommendation for at least two books available in the SJPL system on the QRG topic.
QRGs planned for the series:
- Artificial Intelligence QRG
- Quantum Computing QRG
- Big Data Analytics QRG
- Spacecraft Guidance, Navigation & Control QRG (coming 2026)
- UK Home Computing & The Birth of ARM QRG (coming 2027)
Any questions or comments?
- Please contact Arthur Morgan at [email protected].
100% human made.
HCL Nomad Web – Best Practices und Verwaltung von Multiuser-Umgebungenpanagenda
Webinar Recording: https://www.panagenda.com/webinars/hcl-nomad-web-best-practices-und-verwaltung-von-multiuser-umgebungen/
HCL Nomad Web wird als die nächste Generation des HCL Notes-Clients gefeiert und bietet zahlreiche Vorteile, wie die Beseitigung des Bedarfs an Paketierung, Verteilung und Installation. Nomad Web-Client-Updates werden “automatisch” im Hintergrund installiert, was den administrativen Aufwand im Vergleich zu traditionellen HCL Notes-Clients erheblich reduziert. Allerdings stellt die Fehlerbehebung in Nomad Web im Vergleich zum Notes-Client einzigartige Herausforderungen dar.
Begleiten Sie Christoph und Marc, während sie demonstrieren, wie der Fehlerbehebungsprozess in HCL Nomad Web vereinfacht werden kann, um eine reibungslose und effiziente Benutzererfahrung zu gewährleisten.
In diesem Webinar werden wir effektive Strategien zur Diagnose und Lösung häufiger Probleme in HCL Nomad Web untersuchen, einschließlich
- Zugriff auf die Konsole
- Auffinden und Interpretieren von Protokolldateien
- Zugriff auf den Datenordner im Cache des Browsers (unter Verwendung von OPFS)
- Verständnis der Unterschiede zwischen Einzel- und Mehrbenutzerszenarien
- Nutzung der Client Clocking-Funktion
Complete Guide to Advanced Logistics Management Software in Riyadh.pdfSoftware Company
Explore the benefits and features of advanced logistics management software for businesses in Riyadh. This guide delves into the latest technologies, from real-time tracking and route optimization to warehouse management and inventory control, helping businesses streamline their logistics operations and reduce costs. Learn how implementing the right software solution can enhance efficiency, improve customer satisfaction, and provide a competitive edge in the growing logistics sector of Riyadh.
HCL Nomad Web – Best Practices and Managing Multiuser Environmentspanagenda
Webinar Recording: https://www.panagenda.com/webinars/hcl-nomad-web-best-practices-and-managing-multiuser-environments/
HCL Nomad Web is heralded as the next generation of the HCL Notes client, offering numerous advantages such as eliminating the need for packaging, distribution, and installation. Nomad Web client upgrades will be installed “automatically” in the background. This significantly reduces the administrative footprint compared to traditional HCL Notes clients. However, troubleshooting issues in Nomad Web present unique challenges compared to the Notes client.
Join Christoph and Marc as they demonstrate how to simplify the troubleshooting process in HCL Nomad Web, ensuring a smoother and more efficient user experience.
In this webinar, we will explore effective strategies for diagnosing and resolving common problems in HCL Nomad Web, including
- Accessing the console
- Locating and interpreting log files
- Accessing the data folder within the browser’s cache (using OPFS)
- Understand the difference between single- and multi-user scenarios
- Utilizing Client Clocking
Dev Dives: Automate and orchestrate your processes with UiPath MaestroUiPathCommunity
This session is designed to equip developers with the skills needed to build mission-critical, end-to-end processes that seamlessly orchestrate agents, people, and robots.
📕 Here's what you can expect:
- Modeling: Build end-to-end processes using BPMN.
- Implementing: Integrate agentic tasks, RPA, APIs, and advanced decisioning into processes.
- Operating: Control process instances with rewind, replay, pause, and stop functions.
- Monitoring: Use dashboards and embedded analytics for real-time insights into process instances.
This webinar is a must-attend for developers looking to enhance their agentic automation skills and orchestrate robust, mission-critical processes.
👨🏫 Speaker:
Andrei Vintila, Principal Product Manager @UiPath
This session streamed live on April 29, 2025, 16:00 CET.
Check out all our upcoming Dev Dives sessions at https://community.uipath.com/dev-dives-automation-developer-2025/.
Technology Trends in 2025: AI and Big Data AnalyticsInData Labs
At InData Labs, we have been keeping an ear to the ground, looking out for AI-enabled digital transformation trends coming our way in 2025. Our report will provide a look into the technology landscape of the future, including:
-Artificial Intelligence Market Overview
-Strategies for AI Adoption in 2025
-Anticipated drivers of AI adoption and transformative technologies
-Benefits of AI and Big data for your business
-Tips on how to prepare your business for innovation
-AI and data privacy: Strategies for securing data privacy in AI models, etc.
Download your free copy nowand implement the key findings to improve your business.
Book industry standards are evolving rapidly. In the first part of this session, we’ll share an overview of key developments from 2024 and the early months of 2025. Then, BookNet’s resident standards expert, Tom Richardson, and CEO, Lauren Stewart, have a forward-looking conversation about what’s next.
Link to recording, presentation slides, and accompanying resource: https://bnctechforum.ca/sessions/standardsgoals-for-2025-standards-certification-roundup/
Presented by BookNet Canada on May 6, 2025 with support from the Department of Canadian Heritage.
Increasing Retail Store Efficiency How can Planograms Save Time and Money.pptxAnoop Ashok
In today's fast-paced retail environment, efficiency is key. Every minute counts, and every penny matters. One tool that can significantly boost your store's efficiency is a well-executed planogram. These visual merchandising blueprints not only enhance store layouts but also save time and money in the process.
Semantic Cultivators : The Critical Future Role to Enable AIartmondano
By 2026, AI agents will consume 10x more enterprise data than humans, but with none of the contextual understanding that prevents catastrophic misinterpretations.
Generative Artificial Intelligence (GenAI) in BusinessDr. Tathagat Varma
My talk for the Indian School of Business (ISB) Emerging Leaders Program Cohort 9. In this talk, I discussed key issues around adoption of GenAI in business - benefits, opportunities and limitations. I also discussed how my research on Theory of Cognitive Chasms helps address some of these issues
5. A powerful new way to work with data
Self-service business intelligence and analytics with Excel and the power of the cloud
6. A powerful new way to work with data
Self-service business intelligence with familiar Excel and the power of the cloud
7. Shared Queries
Data Refresh
Data Search
Mobile Access
BI Sites
Natural Language
Questions
Share & collaborate with Power BI for Office 365
8. Shared Queries
Data Refresh
Data Search
Mobile Access
BI Sites
Natural Language
Questions
Share & collaborate with Power BI for Office 365
9. Power BI
for Office 365
Data Management Gateway
Installed on-premises
Workbook
Cloud
On Premise
Share & collaborate with Power BI for Office 365
Shared Queries
Data Refresh
Data Search
Mobile Access
BI Sites
Natural Language
Questions
10. Share & collaborate with Power BI for Office 365
Shared Queries
Data Refresh
Data Search
Mobile Access
BI Sites
Natural Language
Questions
Search for:
• Public Data
• Corporate Data
• Shared Queries
11. Share & collaborate with Power BI for Office
365
Shared Queries
Data Refresh
Data Search
Mobile Access
BI Sites
Natural Language
Questions
12. Share & collaborate with Power BI for Office 365
Shared Queries
Data Refresh
Data Search
Mobile Access
BI Sites
Natural Language
Questions
13. PBI transforms your company's data into rich visuals
[for you to collect and organize] so you can …
Power BI (PBI)
Focus on
what matters
[to you]
By clearing
the clutter
Stay in
the know
With real-
time data
Spot trends
as they
happen
With
insights
Push your
business
further
Competitive
advantage
14. What if … Instead of viewing your data
like this ?
18. Feature
Power BI is a cloud-based business
analytics service that enables.
• fast and easy access to your data
• a live 360º view of your business
• data discovery and exploration
• insights from any device
• collaboration across your organization
• anyone to visualize and analyze data
Experience Your Data. Any Data, Any Way, Anywhere.
Power BI
19. Power BI REST APIsPower BI Desktop
Prepare Explore ShareReport
Data sources
SaaS solutions
e.g. Marketo, Salesforce, GitHub,
Google analytics
On-premises data
e.g. Analysis Services
Organizational content packs
Corporate data sources or external data
services
Azure services
Azure SQL, Stream Analytics…
Excel files
Workbook data / data models
Power BI Desktop files
Data from files, databases, Azure, and
other sources
Power BI service
Data refresh
Visualizations
Live dashboards
Content packs Sharing & collaborationNatural language query
Reports
Datasets01001
10101
Power BI
24. PBI Desktop
Power BI Desktop makes discovering data easy. You can import data from a wide
variety of data sources. After you connect to a data source, you can shape the
data before importing to build your analysis, reporting and dashboard
experience.
PBI Gateways
Personal Version: acts as a bridge, providing quick and secure data transfer
between the Power BI service and on-premises data sources that support
refresh.
Enterprise Version: enables IT departments to deploy and manage central
gateways to serve a large group of users.
Power BI Downloads – Available After
Signup
25. Power BI Downloads – Available After
Signup
PBI Mobile
Stay connected to your data from anywhere, anytime on any device:
iOS (iPad or iPhone), Apple Watch, Android phone, or Windows 10 device.
PBI Publisher for Excel
Take snapshots of your most important insights in Excel, like PivotTables, Charts,
and ranges and pin them to dashboards in Power BI.
Analyze in Excel Updates
Have a great dataset in Power BI, but just have to see it in Excel? With the
Analyze in Excel feature, you get all the great PivotTable, Chart, and Slicer
features in Excel your used to, all while connected to your data in Power BI.
69. Get Power BI (Free) http://tinyurl.com/hj5hdg6
Power BI Jump Start http://bit.ly/1ktON16
Power BI Getting Started http://bit.ly/1FF88KA
Power BI Team Blog http://bit.ly/1vwbTLG
Power BI Channel 9 http://bit.ly/1a9Q0gv
Power BI https://powerbi.microsoft.com
Resources
Bishwadeb Dey, MCP, MCTS
Senior Technical Lead, HCL Kolkata
[email protected]
@bishwadebdey
bishwadebdey.blogspot.com
#3: Microsoft Vision:
Today only about 10% of an organization’s business users can do business analytics. We believe everyone should have easy access to the data they need to make informed decisions. That’s our goal.
The challenge is that accessing and analyzing data can be a daunting task. Where does the data live? How do I access it and get it into the right format so that I can analyze it?
To solve this problem we need to make data of all types much easier to find, access, analyze, and share. This is the path we’re on.
#6: Our Approach:
Excel is the most commonly used analytical tool for business users – it truly is accessible to anyone. No other vendor has the ability to reach a billion users through tools they already know and use. Today Excel delivers end-to-end self-service BI functionality through capabilities such as Power Query, Power Pivot, Power View and Power Map. With the accessibility of Excel and proliferation of Office 365, we can lower the barrier of entry for businesses who want to take advantage of the benefits of business intelligence by putting the right analytics tools in everyone’s hands with no friction.
Ease of deployment through Office 365.. Power BI dramatically simplifies and reduces the time it takes for IT to setup and manage the complex infrastructure needed for an enterprise wide BI platform. Power BI enables businesses to balance between the needs of business users working in Excel and an IT department’s requirements for agility, monitoring and governance. IT can also provide business users the ability to search and access IT sanctioned corporate data sources both on premises and in the cloud while monitoring query usage against their data.
#7: Power BI for Office 365 is a complete self-service BI solution delivered through Excel and Office 365 that provides data discovery, analysis, and visualization capabilities to identify deeper business insights from data in Excel. The Power BI for Office 365 service is a cloud-based solution that enable collaboration and reduces the barriers to deploying a BI environment for sharing reports and accessing information.
#8: Collaborate and stay connected with Office 365: Extends Self-Service BI with ease of collaboration and sharing of reports and data sets which reducing friction from deployment and adoption.
Power BI Sites – quickly create collaborative BI sites for your team to share reports. Larger workbook viewing is now supported (up to 250MB) so that users can view and interact with larger workbooks through the browser. Power BI sites provide a highly visual experience for sharing reports including live report tiles to ease in locate the right report quickly.
#9: Manage data queries for the team
With Power BI people can share not only workbooks but also the queries they create using Power Query in Excel. This allows members of the team to build and manage data queries for others to use when creating their own reports.
Once published to Power BI users can define who they want to share their data queries with and track who’s accessing which queries. Data queries are registered with the Data Catalog so that they can be easily discovered through data search in Excel. If a user tries to access a query but they do not have access to the underlying data source, a workflow will allow them to request access from the DBA responsible for the data.
#10: Keep reports up to date with data refresh
A cloud based Business Intelligence solution must enable you to keep your reports connected to your on-premises data to keep their data fresh.
Keep your reports up to date by scheduling when the data should refresh. The Data Management Gateway allows reports that have been saved to the cloud to connect back to on-premises data sources to refresh data.
Scheduled data refresh for your reports
Connect cloud based report to on-premises data
The data management gateway is installed and configured by IT on-premises, and enables reports to connect through the firewall back to their underlying data sources.
#11: Maintain a Data Catalog of searchable data
IT departments can now use the Data Catalog feature of Power BI to make it easier for everyone to find and connect to corporate data.
The Data Catalog is a feature of Power BI which serves as a search engine for data, the IT department can register data from across the organization with the Data Catalog. This data is then searchable from within Power Query in Excel so that users can easily find and connect to corporate data they need without having to call IT with one off data requests.
When searching for data from Excel, users will now receive results from public data sources, corporate data sources managed by IT, as well as data queries that colleagues are publishing into Power BI. Making it easier to discover what connect exists and reducing duplicative efforts across the organization.
The Data Catalog also tracks data access and usage across the organization, providing IT with better telemetry for data governance and resource allocation.
#12: Stay connected with mobile access to your reports
Mobile BI access to reports in Office 365 is provided through two mechanisms. First, Excel and Power View reports now render in HTML5 so that you can access these reports from any HTML5 compatible browser, on any device. The second, is through native mobile BI apps connect to the Power BI service to keep users connected to their favorite reports, which they can view and explore from their tablet devices. Windows 8.1 tablet devices will be supported are currently supported and iOS will be supported in H2 of CY2014.
#13: Power BI enables business users to interact with their data in natural language. The natural language query capability allows users to ask questions of their corporate data and get instant and visual results. The experience is instantaneous and uses natural language query. Q&A interprets the semantics of the question the user is asking and serves up the correct interactive chart or graph.
It’s as easy as going to a colleague to ask a question. This dramatically increases how many business users can get more value from their existing BI solutions.
#14: Power BI solves the same problems that businesses have struggled with for years; but with different techniques, tools and features.
Focus On What Matters
Understand where you are now and what really matters
Stay In The Know
As your business changes, your data changes … you need the most current data to make the most informed decisions
Spot Trends
A picture says a 1000 words; visual presentations of your data show trends, how your actions are aligning to your goals & objectives
Push Your Business Further
You have a business to run and need to provide that service or product better than every other business
Many times in our businesses we are simply unaware of where the good data is
What are the systems of record within your business?
Where is that “One Source of the Truth” for your business as it relates to
Your Finances
Your Customers
Your Vendors
Your Clients
Ultimately, those are the big ideas behind Power BI.
#17: You could view your data like this …
And reveal what the business community has coined as “actionable insights”!
You have probably seen some of this capabilities if you have ever used Excel 2013 and if you’ve gotten curious and …
Activated the add-in included within Excel 2013 called Power Pivot
#18: AND if you were more curious …
You may have downloaded and activated the additional free add-ins of
Power Query
Power View
Power Map
These features provide some great querying, modeling and presentation capabilities.
So, we have to ask the question
- if I have Excel on Steroids, why would I want Power BI
#19: Key message:
Power BI is a business analytics service. With Power BI you can now see all of your data through a single pane of glass. Live Power BI dashboards and reports show visualizations and KPIs from data residing both on-premises and in the cloud, providing a consolidated view across your business regardless of where your data lives.
Talking points:
This is Power BI in a nutshell and the overall benefits to your business. We will look at what this means in more detail on the following slides
#20: Power BI Desktop is a visual data exploration tool that enables you to analyze data and create stunning reports. With Power BI Desktop, you are able to:
Acquire and prepare data using extensive query capabilities
Manipulation and consolidation of multiple data sources is performed in Power BI Desktop – this enables Power BI service users to use data from multiple sources in a single report
Establish data structure, then transform and analyze data
Visualize and explore your data in new ways through a freeform drag-and-drop canvas
Author reports with a broad range of modern data visualizations
Publish beautiful, interactive reports directly to powerbi.com
Securely share reports through unique, curated content library approach
Finally, the Power BI REST API library allows you to customize nearly every aspect of Power BI, including connecting to custom data sources, enabling real-time data streaming from your data source to Power BI, and integrating other applications with Power BI
#23: PBI registration requires a Work Email account to get started.
#24: One of the first things you will want to explore with the PBI environment is the familiar Site Actions GEAR icon.
Select that to reveal
The amount of space available
With PBI Pro, I have the ability to create a Content Pack
Manage my Admin Portal
Manage my Gateways (Personal or Enterprise)
Manage other settings
Dev Tools
And finally Manage Embed Codes
#27: One of the first things you will want to explore with the PBI environment is the familiar Site Actions GEAR icon.
Select that to reveal
The amount of space available
With PBI Pro, I have the ability to create a Content Pack
Manage my Admin Portal
Manage my Gateways (Personal or Enterprise)
Manage other settings
Dev Tools
And finally Manage Embed Codes
#30: With our current ‘PRO’ subscription, we have 10GB of storage available.
#32: With our current ‘PRO’ subscription, we have 10GB of storage available.
#41: The bulk of the remaining presentation will be on these topics in no certain order.
#42: With our current ‘PRO’ subscription, we have 10GB of storage available.
#44: With this option
The Excel File is managed in its entirety in ODB
The worksheet data, power views, charts, pivot tables, etc. are all managed within Excel
#45: Within PBI
Limited ability to manipulate the presentation pieces
Do have the ability to pin selected charts or sections of the data to a dashboard
NOTE: Do not use the Excel Power View features in Excel as they require Silverlight; even with Silverlight installed, IE still had issues.
#46: With this option
The Excel File worksheet data is managed within ODB
A connection is made between ODB and PBI
The remaining presentation details are performed within PBI
#55: Embed an HTML Snippet web part onto the page and insert the HTML from the prior Power BI page.
#56: Embed an HTML Snippet web part onto the page and insert the HTML from the prior Power BI page.
#58: For PBI on the Desktop, download both
Desktop
Gateways (Personal or Enterprise)
#59: If you already have an existing PBI Desktop file, we can simply open that file, make any updates and publish to our PBI Workspace in the Cloud.
#60: As we don’t have an existing PBI Desktop file already created, we can start with a simple Excel file.
We are greeted with an Import Prompt: Navigator
We can continue with the LoadOR
We can perform some pre-edit cleanup of the data source by clicking on the Edit button
We continue with the Load
#61: We are greeted with the blank looking canvas.
This is actually the Reporting workspace where we can build out our visuals.
#62: We are greeted with the blank looking canvas.
This is actually the Reporting workspace where we can build out our visuals.
#63: We are greeted with the blank looking canvas.
This is actually the Reporting workspace where we can build out our visuals.
#64: We are greeted with the blank looking canvas.
This is actually the Reporting workspace where we can build out our visuals.
#65: We are greeted with the blank looking canvas.
This is actually the Reporting workspace where we can build out our visuals.
#66: We are greeted with the blank looking canvas.
This is actually the Reporting workspace where we can build out our visuals.