SlideShare a Scribd company logo
Power BI & SAP
Integration Options and
possible Pitfalls
06.11.2019
Jochen Jülke
E-Mail: JJuelke@verovis.de
@JJUELKE
Vita
 Dipl. Wirtschaftsinformatiker
 Power BI MCSA , SQL Server 2000-2016 MCSE
 „Power BI“ Enthusiast seit 2008 (Project „Gemini“)
 Organisator Power BI Usergroup (PUG) München
Mission:
„Unternehmenssteuerung auf einem neuen Niveau“
#CFO #GoDigital #Projekterfolgreichmacher
founded 2015, 50x Passion
Session Objectives & Agenda
• Why should you consider mixing MS+SAP BI?
• What’s possible? What are valid Scenarios?
• HowTo/Demo: Connect PBI to BW and HANA
• Tips & Best Practices, Possible Pitfalls?
Why?
Why?
• Business / Use Cases
1. Enterprise Reporting
2. Self Service BI
3. Big Data / NoSQL Data Analysis
Performance
Security
User
Experience
(UX)
CXO-Level,
Manager,
“Consumer”
Controller,
Domain Expert Report
Designer
“Data Modeller”
IT, DBA, BI Dev
R&D,
Data Scientist
Why?
Consideration
1. UX-Experience
2. Performance
3. Security
4. Costs
• Intuitiv?
• Valueable?
• Accessible?
• Desirable?
• Usable?
• Authentication
• SAP, AD, SSO
• Autorisation
• Row-Level Sec.
• Column-Level
Sec.
• Lizence-Costs
• HW + SW Costs
• Skillset / Trainingscosts
• Cost of Chg./
Livecylce Mgt
• Antwortzeiten
• Ladezeiten
• Deployments
Report Layer vs. Data Layer
PowerBI.com
PowerBI.com
(Power BI Premium)
Azure Analysis Services
Other azure data services
HANA
ECC
NON-SAP Datasources
Files DBs (Web) APIs IoT & Datastreams
Power BI Desktop
Excel 2010-2019
Power BI
Add-Ins
Report-Linking
Direct Query / Dual Mode
Import Mode (Cached)
Live Connection
BICS
MDX
SAP
SQL
ODATA
Scenarios, Variants, Considerations
• SAP BW
• Direct Query (mit/ohne SSO)
• Import / Composite Mode
• SAP HANA
• Direct Query (mit/ohne SSO)
• Relational vs. Multidimensional
• Import / Composite Mode
• SAP ECC
• Theobald Connector
• Azure Data Factory
• Import / Composite Mode
• Frontends
• PowerBI.COM
• (Power BI Report Server)
• Excel (& Excel Online)
• SAP Analytics Cloud (SAC)
How it works
©2019 verovis GmbH – performance management & analytics – verovis.de 10
HANA
ECC
„BI Authors“
Power BI Desktop
SAP and MS Power BI
“Get Data” with Power BI Desktop
Power BI bietet keinen direkten Connector für Zugriff
auf SAP ECC/R3. Anbindung aber über OData-
Connector und/oder Azure Data Factory möglich.
SAP .NET Connector 3.0
https://docs.microsoft.com/en-us/power-bi/desktop-sap-bw-connector
->Im SAP Download Center verfügbar (SAP S-ID notwendig)
SAP HANA Client
https://docs.microsoft.com/en-us/power-bi/desktop-sap-hana
->Im SAP Download Center verfügbar (SAP S-ID notwendig)
→ Power BI Data Gateway benötigt ebenfalls installierte
BW/HANA Connectoren!!
©2019 verovis GmbH – performance management & analytics – verovis.de 11
SAP and MS Power BI
“Get Data” with Power BI Desktop
©2019 verovis GmbH – performance management & analytics – verovis.de 12
SAP HANA and MS Power BI
“Get Data” with Power BI Desktop
HANA Features
• Calculation Views
• (Attr/Analytic Views)
©2019 verovis GmbH – performance management & analytics – verovis.de 13
SAP BW and MS Power BI
“Get Data” with Power BI Desktop
BW Features
• InfoCubes & QueryCubes
• Bex Queries
• Selections
©2019 verovis GmbH – performance management & analytics – verovis.de 14
1. activate Feature in PBI Desktop and publish
SAP BW and MS Power BI
“SAP Variables/Selection” Dialog Feature requirements/constraints
• „Power BI Premium“ needed
• SAP SSO required!
• Only available in DirectQuery
• [….]
2. User klicks in PBI Service
3. User can now define SAP Filters in PopUp to filter report
©2019 verovis GmbH – performance management & analytics – verovis.de 15
Blueprint for SAP and MS Power BI
Gateway and Modes
HANA
ECC
„Dashboard &
Spreadsheet
Consumer“
„BI Authors“
Power BI Desktop
PowerBI.com
MS Data Gateway
Import Mode
Daten werden im Intervall X über Gateway in die Cloud
übertragen und dort gespeichert
Direcy Query (DQ) Mode
Benötigte Daten zur Anzeige eines Reports werden
beim Aufruf des Reports „live“ über Gateway geladen
und lediglich temporär in einem Cloud-Cache
gespeichert
Mixed/Composite Mode
Für jeder Tabelle im PBI Model kann definiert werden
ob diese per Import- oder DirectQuery Mode über das
Gateway geladen wird
Auswahlkriterien für den „Besten“ Modus:
Performance <> Datemenge <> Datenaktualität
©2019 verovis GmbH – performance management & analytics – verovis.de 16
Blueprint for SAP and MS Power BI
Security – 3 Variants
Proxy Account Single Sign On (SSO) RLS / SAP Permission
Replication
©2019 verovis GmbH – performance management & analytics – verovis.de 17
Blueprint for SAP and MS Power BI
Variant 1: Security with Proxy Account
HANA
ECC
„Dashboard &
Spreadsheet
Consumer“
„BI Authors“
Power BI Desktop
PowerBI.com
MS Data Gateway
SAP-Benutzer (Serviceaccount):
XYSVC
Active Directory Benutzer:
XY@myCompany.de
SAP Berechtigungen für
SAP-Benutzer (Serviceaccount):
XYSVC
Import Mode
or
Hybrid/Composite Mode
or
Direct Query (DQ) Mode
©2019 verovis GmbH – performance management & analytics – verovis.de 18
Blueprint for SAP and MS Power BI
Variant 2: Security with Single Sign On (SSO)
HANA
ECC
„Dashboard &
Spreadsheet
Consumer“
„BI Authors“
Power BI Desktop
PowerBI.com
MS Data Gateway
„Passthrough“ per SSO
Active Directory Benutzer
= SAP-Benutzer
Active Directory Benutzer:
XY@myCompany.de
SAP Berechtigungen für
SAP-Benutzer:
XY@myCompany.de
Direcy Query (DQ) Mode
Benötigte Daten zur Anzeige eines Reports werden
beim Aufruf des Reports „live“ über Gateway geladen
und lediglich temporär in einem Cloud-Cache
gespeichert
SAP Security Replication
Challenge
• If we use PBI as „Frontend“ for SAP we want to leverage existing SAP
Security Authorisations/Privileges
• This is NOT possible when using other Modes then Direct Query+SSO
Solution Approach
• User/Permission Management stays in SAP
• „Security Metadata“ of SAP must be imported into PBI
• Based on this data PBI Role Level (RLS) can be applied
Benefits
• Leverage SAP Security Definitions in PBI (no double-maintenance needed)
• Increased performance in comparison to Direct Query Szenarios
• Option to „mashup“ SAP und non-SAP Data in PBI
RLS
Analytics
Privilege
SEC
Metadata
©2019 verovis GmbH – performance management & analytics – verovis.de 20
Blueprint for SAP and MS Power BI
Variant 3: Security with “SAP Permission Replication”
HANA
ECC
„Dashboard &
Spreadsheet
Consumer“
„BI Authors“
Power BI Desktop
PowerBI.com
MS Data Gateway
SAP-Benutzer (Serviceaccount):
XYSVC
Active Directory Benutzer:
XY@myCompany.de
SAP-Berechtigungen für
SAP-Benutzer (Serviceaccount):
XYSVC
RLS
Import Mode
or
Hybrid/Composite Mode
©2019 verovis GmbH – performance management & analytics – verovis.de 21
©2019 verovis GmbH – performance management & analytics – verovis.de 22
Blueprint for SAP and MS Power BI
Full Picture
Workspaces
Global
Group2
GroupX
Live
Dataset
Snapshot
Dataset
Dashboard1
PBI Report1 XL Report2
Dataset1 Dataset2
PBIXFile
PBIApps
Sec-RoleSec-Role
„Dashboard &
Spreadsheet
Consumer“
Scheduled
Load
O365&PBI
Administration
O365 & PowerBI.com PBI Visual
XL Range
Direct
Query
Other Source Systems
SQL
AS
Azure
AS
MS Data Gateway
SQL MDS
Excel 2010-2019
Power BI Desktop
Power BI
Add-Ins
„BI Authors“
Sec-Roles Mgt.
or
Master/Dim-Data
BW Query
SQL Srv or
Azure SQL/DWH
MS-DB acts either as „intelligent Data Cache for SAP“ or as
primary DWH (design decision if SAP-HANA or MS-DWH
should lead)
Sec-RoleSec-Role Active Directory
(onPrem)
SAP
DATA HUB
HANA
Theobald XtractIS
/ Universal
SSIS
PBI HANA
Connector
QuerySnapshot
Mobile App
HANA
Studio /
Eclipse
BEx/BW Designer
Sec
Power Query
M-Script
ECC
SAP
SLC
SAP
SNC
Business
Objects BO
Azure Data
Factory (ADF)
Best Practice Tips
Best Practice Tips
• General
• Choose the right architecture/dataflow
• Build Composite Modells
• „Query Folding“ to reduce amount of data imported
• use PBI Desktop „Query reduction“ Option for faster Design-Mode
• Report-Linking between Power BI and SAP Analytics Cloud (SAC)
• SAP HANA
• avoid multiple Joins in HANA Views and materialize the view
• Multidimensional vs. Relational Mode
• SAP BW
• overcome SAP BW memory overflow issues
• leverage tracing for BW Connector
• Direct Query and DAX Limitations
1. AVOID COPY BULK DATA VIA MDX FROM CUBE TO CUBE
Best Practices Tips
Choose the right architecture/dataflow
ECC
MDX
Import
Dataset
PBIX File
1x
Dataset/
Model
X
Power
Queries
1x
ReportDashboards Reports Datasets Dataflows
Workspace 01
Dashboards Reports Datasets Dataflows
Workspace 02
SQL Srv or
Azure SQL
Query
Snapshots
HANA
Power-BI Service (powerbi.com)
Azure Analysis Services
Publish
SQL Server
Analysis Services
2. „Lift & Shift“ components as needed
Best Practices Tips
Composite Models
Storage Mode „Import“
Cached „snapshot“ of data
Storage Mode „Direct Query“
Returns always „live“ data.
Dashboard tiles can be cached
Storage Mode Dual
cached or non-cached based on specific query and
involved tables
Best Practices Tips
„Query Folding“ to reduce amount of data imported
- “Query Folding” limits the data transferred from source (BW/HANA) by i.e.Using WHERE Clause for the data-source
- Adding i.e. a custom column to the query BREAKS query folding and all processing is done in PowerBI (instead of source)
“Query Folding” active = processing/filtering on source No “Query Folding” = processing/filtering in powerbi
By default every
klick in PBI
Desktop can
produce a new
query to the
datasource
Best Practices Tips
use PBI Desktop „Query reduction“ Option for faster Design-Mode
• PBI>SAC
Jump from PBI Report „in Context“ to SAC Report or embed SAC Content via „HTML Visual“
in Power BI
→Use SAP Analytics Cloud URL API
https://help.sap.com/viewer/a4406994704e4af5a8559a640b496468/release/en-
US/4818f7d4ffc241d6ac646e4974e7ba6c.html
https://www.saplearners.com/how-to-call-a-gui-transaction-with-parameters-in-sap-fiori/
• SAC>PBI
→Filter a PBI report using query string parameters in the URL
https://docs.microsoft.com/en-us/power-bi/service-url-filters
Best Practices Tips
Report-Linking between Power BI and SAP Analytics Cloud (SAC)
PowerBI.com
Typical performance issues come from:
- Number of visuals on the page
- HANA View with numerous joins and
aggregations
- Measures created in BI
Solution Approches:
- Reduce number of visuals
- Materialize HANA Views where possible
- Create all measures in HANA
HANA - Best Practices Tips
avoid multiple Joins in HANA Views and materialize the view
HANA - Best Practices Tips
Multidimensional vs. Relational Mode
PBI>File>Options>Global
Category Import Direct Query (Multi) Direct Query (relational)
Data Sources Table+view+calc.view Single calculation view Multiple calulation views
SQL Statements Yes No yes
Composite Models Yes No Yes
Calculated Columns Yes (DAX or M-Scipt) No Yes
Parent-Child hierarchies Yes yes No
SSL Support Yes Yes No
Data Types - SmallDecimal var binary not supported
- Nvarchar truncated to 400 chars
Other/Limits - Performance is good
- SSL is supported
- Perf is not optimal when using larger,
complex HANA views
- - Non-additive measures do not work as
expected (as explained here)
- Hard Limit of BW MDX Interface: 1 Million Cells (Columns * Rows)
- If Query runs infinite/timeouts
- Option 1: Consider Switching to DirectQuery-Mode
- Option 2: Consider Switching to PBI Premium and incremental Refresh
- Option 3: Create „Loops“ to get data in batches
- Convert Query (Q1) to Function and add Parameters (i.E. for Timerange)
- Create a second Query (Q2) with calls the function with different parameters multiple times (for
each row in Q2)
BW - Best Practices Tips
overcome SAP BW memory overflow issues
1. Create
„PBI_EnableSapBwTracing“
environment-variable
BW - Best Practices Tips
leverage tracing for BW Connector
2. Run Report in PBI Desktop
and open trace folder
3. Use SAP Transaction MDXTEST to
check the query
- DAX Limitations
- Problem:
No available in Direct-Query Mode: Nearly all filter functions like FILTER(),
SELECTEDVALUE()…
- Solution: Use .[UniqueName] Attributes
Sample:
CurrentYear = format(VALUE(left(right(MAX('Fiscal year'[Fiscal year.Fiscal year Level
01.UniqueName]);5);4));"#")
BW - Best Practices Tips
Direct Query and DAX Limitations
Other Limits:
- 1M row retrieval limit
- No/limited „Datasource Mashup“ possibilities
- No calculated tables
- No Q&A or Quick Insights
- Can be (very) slooow
- Can negatively impact data source performance
- Can deliver inconsistent results
(especially over volatile data sources)
- …
Recap
Session Objectives & Agenda
• Why should you consider mixing MS+SAP BI?
• What’s possible? What are valid Scenarios?
• HowTo/Demo: Connect PBI to BW and HANA
• Tips & Best Practices, Possible Pitfalls?
Jochen Jülke
E-Mail: JJuelke@verovis.de
@JJUELKE
Vita
 Dipl. Wirtschaftsinformatiker
 Power BI MCSA , SQL Server 2000-2016 MCSE
 „Power BI“ Enthusiast seit 2008 (Project „Gemini“)
 Organisator Power BI Usergroup (PUG) München
Mission:
„Unternehmenssteuerung auf einem neuen Niveau“
#CFO #GoDigital #Projekterfolgreichmacher
founded 2015, 50x Passion
Ad

More Related Content

What's hot (20)

Power BI Overview
Power BI OverviewPower BI Overview
Power BI Overview
Nikkia Carter
 
Power BI Overview
Power BI Overview Power BI Overview
Power BI Overview
Gal Vekselman
 
Power BI Made Simple
Power BI Made SimplePower BI Made Simple
Power BI Made Simple
James Serra
 
Power BI: From the Basics
Power BI: From the BasicsPower BI: From the Basics
Power BI: From the Basics
Nikkia Carter
 
What is Power BI
What is Power BIWhat is Power BI
What is Power BI
Dries Vyvey
 
SAP BW/4HANA - The Intelligent Enterprise Data Warehouse
SAP BW/4HANA - The Intelligent Enterprise Data WarehouseSAP BW/4HANA - The Intelligent Enterprise Data Warehouse
SAP BW/4HANA - The Intelligent Enterprise Data Warehouse
Stridely Solutions
 
SAP BW Introduction.
SAP BW Introduction.SAP BW Introduction.
SAP BW Introduction.
Deloitte India (Offices of the US)
 
SAP HANA Migration Deck.pptx
SAP HANA Migration Deck.pptxSAP HANA Migration Deck.pptx
SAP HANA Migration Deck.pptx
SingbBablu
 
Power BI Overview
Power BI OverviewPower BI Overview
Power BI Overview
James Serra
 
SQL to Azure Migrations
SQL to Azure MigrationsSQL to Azure Migrations
SQL to Azure Migrations
Datavail
 
Introduction to Microsoft Power BI
Introduction to Microsoft Power BIIntroduction to Microsoft Power BI
Introduction to Microsoft Power BI
Exilesoft
 
Power BI - Bring your data together
Power BI - Bring your data togetherPower BI - Bring your data together
Power BI - Bring your data together
Stéphane Fréchette
 
Data Lakehouse, Data Mesh, and Data Fabric (r1)
Data Lakehouse, Data Mesh, and Data Fabric (r1)Data Lakehouse, Data Mesh, and Data Fabric (r1)
Data Lakehouse, Data Mesh, and Data Fabric (r1)
James Serra
 
SAP ECC to S/4HANA Move
SAP ECC to S/4HANA MoveSAP ECC to S/4HANA Move
SAP ECC to S/4HANA Move
AGSanePLDTCompany
 
What is Power BI
What is Power BIWhat is Power BI
What is Power BI
Naseeba P P
 
Power BI Full Course | Power BI Tutorial for Beginners | Edureka
Power BI Full Course | Power BI Tutorial for Beginners | EdurekaPower BI Full Course | Power BI Tutorial for Beginners | Edureka
Power BI Full Course | Power BI Tutorial for Beginners | Edureka
Edureka!
 
SAP Smart Financials 1.0
SAP Smart Financials 1.0SAP Smart Financials 1.0
SAP Smart Financials 1.0
bigsomar
 
Data Sharing with Snowflake
Data Sharing with SnowflakeData Sharing with Snowflake
Data Sharing with Snowflake
Snowflake Computing
 
Snowflake Architecture.pptx
Snowflake Architecture.pptxSnowflake Architecture.pptx
Snowflake Architecture.pptx
chennakesava44
 
The Power Of Snowflake for SAP BusinessObjects
The Power Of Snowflake for SAP BusinessObjectsThe Power Of Snowflake for SAP BusinessObjects
The Power Of Snowflake for SAP BusinessObjects
Wiiisdom
 
Power BI Made Simple
Power BI Made SimplePower BI Made Simple
Power BI Made Simple
James Serra
 
Power BI: From the Basics
Power BI: From the BasicsPower BI: From the Basics
Power BI: From the Basics
Nikkia Carter
 
What is Power BI
What is Power BIWhat is Power BI
What is Power BI
Dries Vyvey
 
SAP BW/4HANA - The Intelligent Enterprise Data Warehouse
SAP BW/4HANA - The Intelligent Enterprise Data WarehouseSAP BW/4HANA - The Intelligent Enterprise Data Warehouse
SAP BW/4HANA - The Intelligent Enterprise Data Warehouse
Stridely Solutions
 
SAP HANA Migration Deck.pptx
SAP HANA Migration Deck.pptxSAP HANA Migration Deck.pptx
SAP HANA Migration Deck.pptx
SingbBablu
 
Power BI Overview
Power BI OverviewPower BI Overview
Power BI Overview
James Serra
 
SQL to Azure Migrations
SQL to Azure MigrationsSQL to Azure Migrations
SQL to Azure Migrations
Datavail
 
Introduction to Microsoft Power BI
Introduction to Microsoft Power BIIntroduction to Microsoft Power BI
Introduction to Microsoft Power BI
Exilesoft
 
Power BI - Bring your data together
Power BI - Bring your data togetherPower BI - Bring your data together
Power BI - Bring your data together
Stéphane Fréchette
 
Data Lakehouse, Data Mesh, and Data Fabric (r1)
Data Lakehouse, Data Mesh, and Data Fabric (r1)Data Lakehouse, Data Mesh, and Data Fabric (r1)
Data Lakehouse, Data Mesh, and Data Fabric (r1)
James Serra
 
What is Power BI
What is Power BIWhat is Power BI
What is Power BI
Naseeba P P
 
Power BI Full Course | Power BI Tutorial for Beginners | Edureka
Power BI Full Course | Power BI Tutorial for Beginners | EdurekaPower BI Full Course | Power BI Tutorial for Beginners | Edureka
Power BI Full Course | Power BI Tutorial for Beginners | Edureka
Edureka!
 
SAP Smart Financials 1.0
SAP Smart Financials 1.0SAP Smart Financials 1.0
SAP Smart Financials 1.0
bigsomar
 
Snowflake Architecture.pptx
Snowflake Architecture.pptxSnowflake Architecture.pptx
Snowflake Architecture.pptx
chennakesava44
 
The Power Of Snowflake for SAP BusinessObjects
The Power Of Snowflake for SAP BusinessObjectsThe Power Of Snowflake for SAP BusinessObjects
The Power Of Snowflake for SAP BusinessObjects
Wiiisdom
 

Similar to Power BI & SAP - Integration Options and possible Pifalls (20)

Power bi overview
Power bi overview Power bi overview
Power bi overview
Kiki Noviandi
 
Sap bw bi
Sap bw biSap bw bi
Sap bw bi
trainer4ss
 
SAP Business Data Cloud: Was die neue SAP-Lösung für Unternehmen und ihre Dat...
SAP Business Data Cloud: Was die neue SAP-Lösung für Unternehmen und ihre Dat...SAP Business Data Cloud: Was die neue SAP-Lösung für Unternehmen und ihre Dat...
SAP Business Data Cloud: Was die neue SAP-Lösung für Unternehmen und ihre Dat...
IBsolution GmbH
 
Sql Saturday Jacksonville- Power BI Report Server Enterprise Architecture, to...
Sql Saturday Jacksonville- Power BI Report Server Enterprise Architecture, to...Sql Saturday Jacksonville- Power BI Report Server Enterprise Architecture, to...
Sql Saturday Jacksonville- Power BI Report Server Enterprise Architecture, to...
Vishal Pawar
 
SAP HANA as Driver of EDW Evolution_ LSA++ (Layered Scalable Architecture) fo...
SAP HANA as Driver of EDW Evolution_ LSA++ (Layered Scalable Architecture) fo...SAP HANA as Driver of EDW Evolution_ LSA++ (Layered Scalable Architecture) fo...
SAP HANA as Driver of EDW Evolution_ LSA++ (Layered Scalable Architecture) fo...
k842420001
 
Power BI Modeling Use Cases: Desktop to Enterprise with Questions and Answers
Power BI Modeling Use Cases: Desktop to Enterprise with Questions and AnswersPower BI Modeling Use Cases: Desktop to Enterprise with Questions and Answers
Power BI Modeling Use Cases: Desktop to Enterprise with Questions and Answers
Senturus
 
Azure advanced analytics for SAP customers
Azure advanced analytics for SAP customersAzure advanced analytics for SAP customers
Azure advanced analytics for SAP customers
Visual_BI
 
A deep dive session on Tableau
A deep dive session on TableauA deep dive session on Tableau
A deep dive session on Tableau
Visual_BI
 
Big data sap hana goto market strategy
Big data   sap hana goto market strategyBig data   sap hana goto market strategy
Big data sap hana goto market strategy
Srikant Mudiganti
 
Der Weg in die SAP Data Warehouse Cloud: Handlungsempfehlung für SAP BW-Kunden
Der Weg in die SAP Data Warehouse Cloud: Handlungsempfehlung für SAP BW-KundenDer Weg in die SAP Data Warehouse Cloud: Handlungsempfehlung für SAP BW-Kunden
Der Weg in die SAP Data Warehouse Cloud: Handlungsempfehlung für SAP BW-Kunden
IBsolution GmbH
 
Power BI Report Server Enterprise Architecture, Tools to Publish reports and ...
Power BI Report Server Enterprise Architecture, Tools to Publish reports and ...Power BI Report Server Enterprise Architecture, Tools to Publish reports and ...
Power BI Report Server Enterprise Architecture, Tools to Publish reports and ...
Vishal Pawar
 
SAP BPC Embedded for S/4 HANA
SAP BPC Embedded for S/4 HANASAP BPC Embedded for S/4 HANA
SAP BPC Embedded for S/4 HANA
SAPBPCANALYTICS G.P
 
South Florida SQL Saturday - Power BI Report Server Enterprise Architecture, ...
South Florida SQL Saturday - Power BI Report Server Enterprise Architecture, ...South Florida SQL Saturday - Power BI Report Server Enterprise Architecture, ...
South Florida SQL Saturday - Power BI Report Server Enterprise Architecture, ...
Vishal Pawar
 
Power BI Report Server: a Deep Dive for PASS Business Analytics Virtual Group
Power BI Report Server: a Deep Dive for PASS Business Analytics Virtual GroupPower BI Report Server: a Deep Dive for PASS Business Analytics Virtual Group
Power BI Report Server: a Deep Dive for PASS Business Analytics Virtual Group
Luca Gualtieri
 
Life after Xcelsius
Life after XcelsiusLife after Xcelsius
Life after Xcelsius
Visual_BI
 
SQL 2012 PowerView Talk SPSLA
SQL 2012 PowerView Talk SPSLASQL 2012 PowerView Talk SPSLA
SQL 2012 PowerView Talk SPSLA
sangeetargupta
 
Power BI Report Server & Office Online Server
Power BI Report Server & Office Online ServerPower BI Report Server & Office Online Server
Power BI Report Server & Office Online Server
Isabelle Van Campenhoudt
 
DOC Power-Bi-Guidance.pdf
DOC Power-Bi-Guidance.pdfDOC Power-Bi-Guidance.pdf
DOC Power-Bi-Guidance.pdf
ssusere8fdd1
 
Whats new and exciting jan 22
Whats new and exciting jan 22Whats new and exciting jan 22
Whats new and exciting jan 22
Berkovich Consulting
 
Using Power BI and Azure as analytics engine for business applications
Using Power BI and Azure as analytics engine for business applicationsUsing Power BI and Azure as analytics engine for business applications
Using Power BI and Azure as analytics engine for business applications
Digital Illustrated
 
SAP Business Data Cloud: Was die neue SAP-Lösung für Unternehmen und ihre Dat...
SAP Business Data Cloud: Was die neue SAP-Lösung für Unternehmen und ihre Dat...SAP Business Data Cloud: Was die neue SAP-Lösung für Unternehmen und ihre Dat...
SAP Business Data Cloud: Was die neue SAP-Lösung für Unternehmen und ihre Dat...
IBsolution GmbH
 
Sql Saturday Jacksonville- Power BI Report Server Enterprise Architecture, to...
Sql Saturday Jacksonville- Power BI Report Server Enterprise Architecture, to...Sql Saturday Jacksonville- Power BI Report Server Enterprise Architecture, to...
Sql Saturday Jacksonville- Power BI Report Server Enterprise Architecture, to...
Vishal Pawar
 
SAP HANA as Driver of EDW Evolution_ LSA++ (Layered Scalable Architecture) fo...
SAP HANA as Driver of EDW Evolution_ LSA++ (Layered Scalable Architecture) fo...SAP HANA as Driver of EDW Evolution_ LSA++ (Layered Scalable Architecture) fo...
SAP HANA as Driver of EDW Evolution_ LSA++ (Layered Scalable Architecture) fo...
k842420001
 
Power BI Modeling Use Cases: Desktop to Enterprise with Questions and Answers
Power BI Modeling Use Cases: Desktop to Enterprise with Questions and AnswersPower BI Modeling Use Cases: Desktop to Enterprise with Questions and Answers
Power BI Modeling Use Cases: Desktop to Enterprise with Questions and Answers
Senturus
 
Azure advanced analytics for SAP customers
Azure advanced analytics for SAP customersAzure advanced analytics for SAP customers
Azure advanced analytics for SAP customers
Visual_BI
 
A deep dive session on Tableau
A deep dive session on TableauA deep dive session on Tableau
A deep dive session on Tableau
Visual_BI
 
Big data sap hana goto market strategy
Big data   sap hana goto market strategyBig data   sap hana goto market strategy
Big data sap hana goto market strategy
Srikant Mudiganti
 
Der Weg in die SAP Data Warehouse Cloud: Handlungsempfehlung für SAP BW-Kunden
Der Weg in die SAP Data Warehouse Cloud: Handlungsempfehlung für SAP BW-KundenDer Weg in die SAP Data Warehouse Cloud: Handlungsempfehlung für SAP BW-Kunden
Der Weg in die SAP Data Warehouse Cloud: Handlungsempfehlung für SAP BW-Kunden
IBsolution GmbH
 
Power BI Report Server Enterprise Architecture, Tools to Publish reports and ...
Power BI Report Server Enterprise Architecture, Tools to Publish reports and ...Power BI Report Server Enterprise Architecture, Tools to Publish reports and ...
Power BI Report Server Enterprise Architecture, Tools to Publish reports and ...
Vishal Pawar
 
South Florida SQL Saturday - Power BI Report Server Enterprise Architecture, ...
South Florida SQL Saturday - Power BI Report Server Enterprise Architecture, ...South Florida SQL Saturday - Power BI Report Server Enterprise Architecture, ...
South Florida SQL Saturday - Power BI Report Server Enterprise Architecture, ...
Vishal Pawar
 
Power BI Report Server: a Deep Dive for PASS Business Analytics Virtual Group
Power BI Report Server: a Deep Dive for PASS Business Analytics Virtual GroupPower BI Report Server: a Deep Dive for PASS Business Analytics Virtual Group
Power BI Report Server: a Deep Dive for PASS Business Analytics Virtual Group
Luca Gualtieri
 
Life after Xcelsius
Life after XcelsiusLife after Xcelsius
Life after Xcelsius
Visual_BI
 
SQL 2012 PowerView Talk SPSLA
SQL 2012 PowerView Talk SPSLASQL 2012 PowerView Talk SPSLA
SQL 2012 PowerView Talk SPSLA
sangeetargupta
 
Power BI Report Server & Office Online Server
Power BI Report Server & Office Online ServerPower BI Report Server & Office Online Server
Power BI Report Server & Office Online Server
Isabelle Van Campenhoudt
 
DOC Power-Bi-Guidance.pdf
DOC Power-Bi-Guidance.pdfDOC Power-Bi-Guidance.pdf
DOC Power-Bi-Guidance.pdf
ssusere8fdd1
 
Using Power BI and Azure as analytics engine for business applications
Using Power BI and Azure as analytics engine for business applicationsUsing Power BI and Azure as analytics engine for business applications
Using Power BI and Azure as analytics engine for business applications
Digital Illustrated
 
Ad

Recently uploaded (20)

Minions Want to eat presentacion muy linda
Minions Want to eat presentacion muy lindaMinions Want to eat presentacion muy linda
Minions Want to eat presentacion muy linda
CarlaAndradesSoler1
 
03 Daniel 2-notes.ppt seminario escatologia
03 Daniel 2-notes.ppt seminario escatologia03 Daniel 2-notes.ppt seminario escatologia
03 Daniel 2-notes.ppt seminario escatologia
Alexander Romero Arosquipa
 
md-presentHHHHHHHHHHHHHHHHHHHHHHHHHHHHHHation.pptx
md-presentHHHHHHHHHHHHHHHHHHHHHHHHHHHHHHation.pptxmd-presentHHHHHHHHHHHHHHHHHHHHHHHHHHHHHHation.pptx
md-presentHHHHHHHHHHHHHHHHHHHHHHHHHHHHHHation.pptx
fatimalazaar2004
 
Conic Sectionfaggavahabaayhahahahahs.pptx
Conic Sectionfaggavahabaayhahahahahs.pptxConic Sectionfaggavahabaayhahahahahs.pptx
Conic Sectionfaggavahabaayhahahahahs.pptx
taiwanesechetan
 
Flip flop presenation-Presented By Mubahir khan.pptx
Flip flop presenation-Presented By Mubahir khan.pptxFlip flop presenation-Presented By Mubahir khan.pptx
Flip flop presenation-Presented By Mubahir khan.pptx
mubashirkhan45461
 
Developing Security Orchestration, Automation, and Response Applications
Developing Security Orchestration, Automation, and Response ApplicationsDeveloping Security Orchestration, Automation, and Response Applications
Developing Security Orchestration, Automation, and Response Applications
VICTOR MAESTRE RAMIREZ
 
FPET_Implementation_2_MA to 360 Engage Direct.pptx
FPET_Implementation_2_MA to 360 Engage Direct.pptxFPET_Implementation_2_MA to 360 Engage Direct.pptx
FPET_Implementation_2_MA to 360 Engage Direct.pptx
ssuser4ef83d
 
VKS-Python Basics for Beginners and advance.pptx
VKS-Python Basics for Beginners and advance.pptxVKS-Python Basics for Beginners and advance.pptx
VKS-Python Basics for Beginners and advance.pptx
Vinod Srivastava
 
Ch3MCT24.pptx measure of central tendency
Ch3MCT24.pptx measure of central tendencyCh3MCT24.pptx measure of central tendency
Ch3MCT24.pptx measure of central tendency
ayeleasefa2
 
chapter 4 Variability statistical research .pptx
chapter 4 Variability statistical research .pptxchapter 4 Variability statistical research .pptx
chapter 4 Variability statistical research .pptx
justinebandajbn
 
Geometry maths presentation for begginers
Geometry maths presentation for begginersGeometry maths presentation for begginers
Geometry maths presentation for begginers
zrjacob283
 
Simple_AI_Explanation_English somplr.pptx
Simple_AI_Explanation_English somplr.pptxSimple_AI_Explanation_English somplr.pptx
Simple_AI_Explanation_English somplr.pptx
ssuser2aa19f
 
Data Science Courses in India iim skills
Data Science Courses in India iim skillsData Science Courses in India iim skills
Data Science Courses in India iim skills
dharnathakur29
 
Molecular methods diagnostic and monitoring of infection - Repaired.pptx
Molecular methods diagnostic and monitoring of infection  -  Repaired.pptxMolecular methods diagnostic and monitoring of infection  -  Repaired.pptx
Molecular methods diagnostic and monitoring of infection - Repaired.pptx
7tzn7x5kky
 
Thingyan is now a global treasure! See how people around the world are search...
Thingyan is now a global treasure! See how people around the world are search...Thingyan is now a global treasure! See how people around the world are search...
Thingyan is now a global treasure! See how people around the world are search...
Pixellion
 
Ppt. Nikhil.pptxnshwuudgcudisisshvehsjks
Ppt. Nikhil.pptxnshwuudgcudisisshvehsjksPpt. Nikhil.pptxnshwuudgcudisisshvehsjks
Ppt. Nikhil.pptxnshwuudgcudisisshvehsjks
panchariyasahil
 
Template_A3nnnnnnnnnnnnnnnnnnnnnnnnnnnnnnnnnnn
Template_A3nnnnnnnnnnnnnnnnnnnnnnnnnnnnnnnnnnnTemplate_A3nnnnnnnnnnnnnnnnnnnnnnnnnnnnnnnnnnn
Template_A3nnnnnnnnnnnnnnnnnnnnnnnnnnnnnnnnnnn
cegiver630
 
AI Competitor Analysis: How to Monitor and Outperform Your Competitors
AI Competitor Analysis: How to Monitor and Outperform Your CompetitorsAI Competitor Analysis: How to Monitor and Outperform Your Competitors
AI Competitor Analysis: How to Monitor and Outperform Your Competitors
Contify
 
Deloitte Analytics - Applying Process Mining in an audit context
Deloitte Analytics - Applying Process Mining in an audit contextDeloitte Analytics - Applying Process Mining in an audit context
Deloitte Analytics - Applying Process Mining in an audit context
Process mining Evangelist
 
chapter3 Central Tendency statistics.ppt
chapter3 Central Tendency statistics.pptchapter3 Central Tendency statistics.ppt
chapter3 Central Tendency statistics.ppt
justinebandajbn
 
Minions Want to eat presentacion muy linda
Minions Want to eat presentacion muy lindaMinions Want to eat presentacion muy linda
Minions Want to eat presentacion muy linda
CarlaAndradesSoler1
 
md-presentHHHHHHHHHHHHHHHHHHHHHHHHHHHHHHation.pptx
md-presentHHHHHHHHHHHHHHHHHHHHHHHHHHHHHHation.pptxmd-presentHHHHHHHHHHHHHHHHHHHHHHHHHHHHHHation.pptx
md-presentHHHHHHHHHHHHHHHHHHHHHHHHHHHHHHation.pptx
fatimalazaar2004
 
Conic Sectionfaggavahabaayhahahahahs.pptx
Conic Sectionfaggavahabaayhahahahahs.pptxConic Sectionfaggavahabaayhahahahahs.pptx
Conic Sectionfaggavahabaayhahahahahs.pptx
taiwanesechetan
 
Flip flop presenation-Presented By Mubahir khan.pptx
Flip flop presenation-Presented By Mubahir khan.pptxFlip flop presenation-Presented By Mubahir khan.pptx
Flip flop presenation-Presented By Mubahir khan.pptx
mubashirkhan45461
 
Developing Security Orchestration, Automation, and Response Applications
Developing Security Orchestration, Automation, and Response ApplicationsDeveloping Security Orchestration, Automation, and Response Applications
Developing Security Orchestration, Automation, and Response Applications
VICTOR MAESTRE RAMIREZ
 
FPET_Implementation_2_MA to 360 Engage Direct.pptx
FPET_Implementation_2_MA to 360 Engage Direct.pptxFPET_Implementation_2_MA to 360 Engage Direct.pptx
FPET_Implementation_2_MA to 360 Engage Direct.pptx
ssuser4ef83d
 
VKS-Python Basics for Beginners and advance.pptx
VKS-Python Basics for Beginners and advance.pptxVKS-Python Basics for Beginners and advance.pptx
VKS-Python Basics for Beginners and advance.pptx
Vinod Srivastava
 
Ch3MCT24.pptx measure of central tendency
Ch3MCT24.pptx measure of central tendencyCh3MCT24.pptx measure of central tendency
Ch3MCT24.pptx measure of central tendency
ayeleasefa2
 
chapter 4 Variability statistical research .pptx
chapter 4 Variability statistical research .pptxchapter 4 Variability statistical research .pptx
chapter 4 Variability statistical research .pptx
justinebandajbn
 
Geometry maths presentation for begginers
Geometry maths presentation for begginersGeometry maths presentation for begginers
Geometry maths presentation for begginers
zrjacob283
 
Simple_AI_Explanation_English somplr.pptx
Simple_AI_Explanation_English somplr.pptxSimple_AI_Explanation_English somplr.pptx
Simple_AI_Explanation_English somplr.pptx
ssuser2aa19f
 
Data Science Courses in India iim skills
Data Science Courses in India iim skillsData Science Courses in India iim skills
Data Science Courses in India iim skills
dharnathakur29
 
Molecular methods diagnostic and monitoring of infection - Repaired.pptx
Molecular methods diagnostic and monitoring of infection  -  Repaired.pptxMolecular methods diagnostic and monitoring of infection  -  Repaired.pptx
Molecular methods diagnostic and monitoring of infection - Repaired.pptx
7tzn7x5kky
 
Thingyan is now a global treasure! See how people around the world are search...
Thingyan is now a global treasure! See how people around the world are search...Thingyan is now a global treasure! See how people around the world are search...
Thingyan is now a global treasure! See how people around the world are search...
Pixellion
 
Ppt. Nikhil.pptxnshwuudgcudisisshvehsjks
Ppt. Nikhil.pptxnshwuudgcudisisshvehsjksPpt. Nikhil.pptxnshwuudgcudisisshvehsjks
Ppt. Nikhil.pptxnshwuudgcudisisshvehsjks
panchariyasahil
 
Template_A3nnnnnnnnnnnnnnnnnnnnnnnnnnnnnnnnnnn
Template_A3nnnnnnnnnnnnnnnnnnnnnnnnnnnnnnnnnnnTemplate_A3nnnnnnnnnnnnnnnnnnnnnnnnnnnnnnnnnnn
Template_A3nnnnnnnnnnnnnnnnnnnnnnnnnnnnnnnnnnn
cegiver630
 
AI Competitor Analysis: How to Monitor and Outperform Your Competitors
AI Competitor Analysis: How to Monitor and Outperform Your CompetitorsAI Competitor Analysis: How to Monitor and Outperform Your Competitors
AI Competitor Analysis: How to Monitor and Outperform Your Competitors
Contify
 
Deloitte Analytics - Applying Process Mining in an audit context
Deloitte Analytics - Applying Process Mining in an audit contextDeloitte Analytics - Applying Process Mining in an audit context
Deloitte Analytics - Applying Process Mining in an audit context
Process mining Evangelist
 
chapter3 Central Tendency statistics.ppt
chapter3 Central Tendency statistics.pptchapter3 Central Tendency statistics.ppt
chapter3 Central Tendency statistics.ppt
justinebandajbn
 
Ad

Power BI & SAP - Integration Options and possible Pifalls

  • 1. Power BI & SAP Integration Options and possible Pitfalls 06.11.2019
  • 2. Jochen Jülke E-Mail: [email protected] @JJUELKE Vita  Dipl. Wirtschaftsinformatiker  Power BI MCSA , SQL Server 2000-2016 MCSE  „Power BI“ Enthusiast seit 2008 (Project „Gemini“)  Organisator Power BI Usergroup (PUG) München Mission: „Unternehmenssteuerung auf einem neuen Niveau“ #CFO #GoDigital #Projekterfolgreichmacher founded 2015, 50x Passion
  • 3. Session Objectives & Agenda • Why should you consider mixing MS+SAP BI? • What’s possible? What are valid Scenarios? • HowTo/Demo: Connect PBI to BW and HANA • Tips & Best Practices, Possible Pitfalls?
  • 5. Why? • Business / Use Cases 1. Enterprise Reporting 2. Self Service BI 3. Big Data / NoSQL Data Analysis Performance Security User Experience (UX) CXO-Level, Manager, “Consumer” Controller, Domain Expert Report Designer “Data Modeller” IT, DBA, BI Dev R&D, Data Scientist
  • 6. Why? Consideration 1. UX-Experience 2. Performance 3. Security 4. Costs • Intuitiv? • Valueable? • Accessible? • Desirable? • Usable? • Authentication • SAP, AD, SSO • Autorisation • Row-Level Sec. • Column-Level Sec. • Lizence-Costs • HW + SW Costs • Skillset / Trainingscosts • Cost of Chg./ Livecylce Mgt • Antwortzeiten • Ladezeiten • Deployments
  • 7. Report Layer vs. Data Layer PowerBI.com PowerBI.com (Power BI Premium) Azure Analysis Services Other azure data services HANA ECC NON-SAP Datasources Files DBs (Web) APIs IoT & Datastreams Power BI Desktop Excel 2010-2019 Power BI Add-Ins Report-Linking Direct Query / Dual Mode Import Mode (Cached) Live Connection BICS MDX SAP SQL ODATA
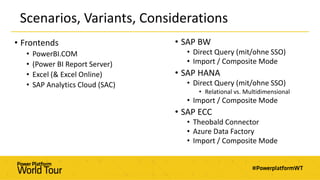
  • 8. Scenarios, Variants, Considerations • SAP BW • Direct Query (mit/ohne SSO) • Import / Composite Mode • SAP HANA • Direct Query (mit/ohne SSO) • Relational vs. Multidimensional • Import / Composite Mode • SAP ECC • Theobald Connector • Azure Data Factory • Import / Composite Mode • Frontends • PowerBI.COM • (Power BI Report Server) • Excel (& Excel Online) • SAP Analytics Cloud (SAC)
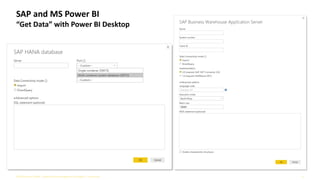
  • 10. ©2019 verovis GmbH – performance management & analytics – verovis.de 10 HANA ECC „BI Authors“ Power BI Desktop SAP and MS Power BI “Get Data” with Power BI Desktop Power BI bietet keinen direkten Connector für Zugriff auf SAP ECC/R3. Anbindung aber über OData- Connector und/oder Azure Data Factory möglich. SAP .NET Connector 3.0 https://docs.microsoft.com/en-us/power-bi/desktop-sap-bw-connector ->Im SAP Download Center verfügbar (SAP S-ID notwendig) SAP HANA Client https://docs.microsoft.com/en-us/power-bi/desktop-sap-hana ->Im SAP Download Center verfügbar (SAP S-ID notwendig) → Power BI Data Gateway benötigt ebenfalls installierte BW/HANA Connectoren!!
  • 11. ©2019 verovis GmbH – performance management & analytics – verovis.de 11 SAP and MS Power BI “Get Data” with Power BI Desktop
  • 12. ©2019 verovis GmbH – performance management & analytics – verovis.de 12 SAP HANA and MS Power BI “Get Data” with Power BI Desktop HANA Features • Calculation Views • (Attr/Analytic Views)
  • 13. ©2019 verovis GmbH – performance management & analytics – verovis.de 13 SAP BW and MS Power BI “Get Data” with Power BI Desktop BW Features • InfoCubes & QueryCubes • Bex Queries • Selections
  • 14. ©2019 verovis GmbH – performance management & analytics – verovis.de 14 1. activate Feature in PBI Desktop and publish SAP BW and MS Power BI “SAP Variables/Selection” Dialog Feature requirements/constraints • „Power BI Premium“ needed • SAP SSO required! • Only available in DirectQuery • [….] 2. User klicks in PBI Service 3. User can now define SAP Filters in PopUp to filter report
  • 15. ©2019 verovis GmbH – performance management & analytics – verovis.de 15 Blueprint for SAP and MS Power BI Gateway and Modes HANA ECC „Dashboard & Spreadsheet Consumer“ „BI Authors“ Power BI Desktop PowerBI.com MS Data Gateway Import Mode Daten werden im Intervall X über Gateway in die Cloud übertragen und dort gespeichert Direcy Query (DQ) Mode Benötigte Daten zur Anzeige eines Reports werden beim Aufruf des Reports „live“ über Gateway geladen und lediglich temporär in einem Cloud-Cache gespeichert Mixed/Composite Mode Für jeder Tabelle im PBI Model kann definiert werden ob diese per Import- oder DirectQuery Mode über das Gateway geladen wird Auswahlkriterien für den „Besten“ Modus: Performance <> Datemenge <> Datenaktualität
  • 16. ©2019 verovis GmbH – performance management & analytics – verovis.de 16 Blueprint for SAP and MS Power BI Security – 3 Variants Proxy Account Single Sign On (SSO) RLS / SAP Permission Replication
  • 17. ©2019 verovis GmbH – performance management & analytics – verovis.de 17 Blueprint for SAP and MS Power BI Variant 1: Security with Proxy Account HANA ECC „Dashboard & Spreadsheet Consumer“ „BI Authors“ Power BI Desktop PowerBI.com MS Data Gateway SAP-Benutzer (Serviceaccount): XYSVC Active Directory Benutzer: [email protected] SAP Berechtigungen für SAP-Benutzer (Serviceaccount): XYSVC Import Mode or Hybrid/Composite Mode or Direct Query (DQ) Mode
  • 18. ©2019 verovis GmbH – performance management & analytics – verovis.de 18 Blueprint for SAP and MS Power BI Variant 2: Security with Single Sign On (SSO) HANA ECC „Dashboard & Spreadsheet Consumer“ „BI Authors“ Power BI Desktop PowerBI.com MS Data Gateway „Passthrough“ per SSO Active Directory Benutzer = SAP-Benutzer Active Directory Benutzer: [email protected] SAP Berechtigungen für SAP-Benutzer: [email protected] Direcy Query (DQ) Mode Benötigte Daten zur Anzeige eines Reports werden beim Aufruf des Reports „live“ über Gateway geladen und lediglich temporär in einem Cloud-Cache gespeichert
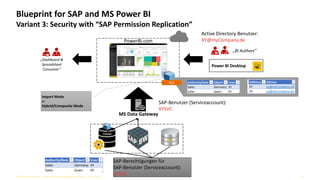
  • 19. SAP Security Replication Challenge • If we use PBI as „Frontend“ for SAP we want to leverage existing SAP Security Authorisations/Privileges • This is NOT possible when using other Modes then Direct Query+SSO Solution Approach • User/Permission Management stays in SAP • „Security Metadata“ of SAP must be imported into PBI • Based on this data PBI Role Level (RLS) can be applied Benefits • Leverage SAP Security Definitions in PBI (no double-maintenance needed) • Increased performance in comparison to Direct Query Szenarios • Option to „mashup“ SAP und non-SAP Data in PBI RLS Analytics Privilege SEC Metadata
  • 20. ©2019 verovis GmbH – performance management & analytics – verovis.de 20 Blueprint for SAP and MS Power BI Variant 3: Security with “SAP Permission Replication” HANA ECC „Dashboard & Spreadsheet Consumer“ „BI Authors“ Power BI Desktop PowerBI.com MS Data Gateway SAP-Benutzer (Serviceaccount): XYSVC Active Directory Benutzer: [email protected] SAP-Berechtigungen für SAP-Benutzer (Serviceaccount): XYSVC RLS Import Mode or Hybrid/Composite Mode
  • 21. ©2019 verovis GmbH – performance management & analytics – verovis.de 21
  • 22. ©2019 verovis GmbH – performance management & analytics – verovis.de 22 Blueprint for SAP and MS Power BI Full Picture Workspaces Global Group2 GroupX Live Dataset Snapshot Dataset Dashboard1 PBI Report1 XL Report2 Dataset1 Dataset2 PBIXFile PBIApps Sec-RoleSec-Role „Dashboard & Spreadsheet Consumer“ Scheduled Load O365&PBI Administration O365 & PowerBI.com PBI Visual XL Range Direct Query Other Source Systems SQL AS Azure AS MS Data Gateway SQL MDS Excel 2010-2019 Power BI Desktop Power BI Add-Ins „BI Authors“ Sec-Roles Mgt. or Master/Dim-Data BW Query SQL Srv or Azure SQL/DWH MS-DB acts either as „intelligent Data Cache for SAP“ or as primary DWH (design decision if SAP-HANA or MS-DWH should lead) Sec-RoleSec-Role Active Directory (onPrem) SAP DATA HUB HANA Theobald XtractIS / Universal SSIS PBI HANA Connector QuerySnapshot Mobile App HANA Studio / Eclipse BEx/BW Designer Sec Power Query M-Script ECC SAP SLC SAP SNC Business Objects BO Azure Data Factory (ADF)
  • 24. Best Practice Tips • General • Choose the right architecture/dataflow • Build Composite Modells • „Query Folding“ to reduce amount of data imported • use PBI Desktop „Query reduction“ Option for faster Design-Mode • Report-Linking between Power BI and SAP Analytics Cloud (SAC) • SAP HANA • avoid multiple Joins in HANA Views and materialize the view • Multidimensional vs. Relational Mode • SAP BW • overcome SAP BW memory overflow issues • leverage tracing for BW Connector • Direct Query and DAX Limitations
  • 25. 1. AVOID COPY BULK DATA VIA MDX FROM CUBE TO CUBE Best Practices Tips Choose the right architecture/dataflow ECC MDX Import Dataset PBIX File 1x Dataset/ Model X Power Queries 1x ReportDashboards Reports Datasets Dataflows Workspace 01 Dashboards Reports Datasets Dataflows Workspace 02 SQL Srv or Azure SQL Query Snapshots HANA Power-BI Service (powerbi.com) Azure Analysis Services Publish SQL Server Analysis Services 2. „Lift & Shift“ components as needed
  • 26. Best Practices Tips Composite Models Storage Mode „Import“ Cached „snapshot“ of data Storage Mode „Direct Query“ Returns always „live“ data. Dashboard tiles can be cached Storage Mode Dual cached or non-cached based on specific query and involved tables
  • 27. Best Practices Tips „Query Folding“ to reduce amount of data imported - “Query Folding” limits the data transferred from source (BW/HANA) by i.e.Using WHERE Clause for the data-source - Adding i.e. a custom column to the query BREAKS query folding and all processing is done in PowerBI (instead of source) “Query Folding” active = processing/filtering on source No “Query Folding” = processing/filtering in powerbi
  • 28. By default every klick in PBI Desktop can produce a new query to the datasource Best Practices Tips use PBI Desktop „Query reduction“ Option for faster Design-Mode
  • 29. • PBI>SAC Jump from PBI Report „in Context“ to SAC Report or embed SAC Content via „HTML Visual“ in Power BI →Use SAP Analytics Cloud URL API https://help.sap.com/viewer/a4406994704e4af5a8559a640b496468/release/en- US/4818f7d4ffc241d6ac646e4974e7ba6c.html https://www.saplearners.com/how-to-call-a-gui-transaction-with-parameters-in-sap-fiori/ • SAC>PBI →Filter a PBI report using query string parameters in the URL https://docs.microsoft.com/en-us/power-bi/service-url-filters Best Practices Tips Report-Linking between Power BI and SAP Analytics Cloud (SAC) PowerBI.com
  • 30. Typical performance issues come from: - Number of visuals on the page - HANA View with numerous joins and aggregations - Measures created in BI Solution Approches: - Reduce number of visuals - Materialize HANA Views where possible - Create all measures in HANA HANA - Best Practices Tips avoid multiple Joins in HANA Views and materialize the view
  • 31. HANA - Best Practices Tips Multidimensional vs. Relational Mode PBI>File>Options>Global Category Import Direct Query (Multi) Direct Query (relational) Data Sources Table+view+calc.view Single calculation view Multiple calulation views SQL Statements Yes No yes Composite Models Yes No Yes Calculated Columns Yes (DAX or M-Scipt) No Yes Parent-Child hierarchies Yes yes No SSL Support Yes Yes No Data Types - SmallDecimal var binary not supported - Nvarchar truncated to 400 chars Other/Limits - Performance is good - SSL is supported - Perf is not optimal when using larger, complex HANA views - - Non-additive measures do not work as expected (as explained here)
  • 32. - Hard Limit of BW MDX Interface: 1 Million Cells (Columns * Rows) - If Query runs infinite/timeouts - Option 1: Consider Switching to DirectQuery-Mode - Option 2: Consider Switching to PBI Premium and incremental Refresh - Option 3: Create „Loops“ to get data in batches - Convert Query (Q1) to Function and add Parameters (i.E. for Timerange) - Create a second Query (Q2) with calls the function with different parameters multiple times (for each row in Q2) BW - Best Practices Tips overcome SAP BW memory overflow issues
  • 33. 1. Create „PBI_EnableSapBwTracing“ environment-variable BW - Best Practices Tips leverage tracing for BW Connector 2. Run Report in PBI Desktop and open trace folder 3. Use SAP Transaction MDXTEST to check the query
  • 34. - DAX Limitations - Problem: No available in Direct-Query Mode: Nearly all filter functions like FILTER(), SELECTEDVALUE()… - Solution: Use .[UniqueName] Attributes Sample: CurrentYear = format(VALUE(left(right(MAX('Fiscal year'[Fiscal year.Fiscal year Level 01.UniqueName]);5);4));"#") BW - Best Practices Tips Direct Query and DAX Limitations Other Limits: - 1M row retrieval limit - No/limited „Datasource Mashup“ possibilities - No calculated tables - No Q&A or Quick Insights - Can be (very) slooow - Can negatively impact data source performance - Can deliver inconsistent results (especially over volatile data sources) - …
  • 35. Recap
  • 36. Session Objectives & Agenda • Why should you consider mixing MS+SAP BI? • What’s possible? What are valid Scenarios? • HowTo/Demo: Connect PBI to BW and HANA • Tips & Best Practices, Possible Pitfalls?
  • 37. Jochen Jülke E-Mail: [email protected] @JJUELKE Vita  Dipl. Wirtschaftsinformatiker  Power BI MCSA , SQL Server 2000-2016 MCSE  „Power BI“ Enthusiast seit 2008 (Project „Gemini“)  Organisator Power BI Usergroup (PUG) München Mission: „Unternehmenssteuerung auf einem neuen Niveau“ #CFO #GoDigital #Projekterfolgreichmacher founded 2015, 50x Passion