SlideShare a Scribd company logo
Predictive Business Process
Monitoring Considering
Reliability Estimates
Andreas Metzger, Felix Föcker
Full Paper Presentation at the 29th International Conference on Advanced Information
Systems Engineering - CAiSE 2017, Essen, Germany, June 12-16, 2017, Lecture Notes in
Computer Science, E. Dubois and K. Pohl, Eds., vol. 10253. Springer, 2017.
https://doi.org/10.1007/978-3-319-59536-8_28
(Open Access)
Agenda
1. Motivation
2. Experimental Design
3. Main Results
4. Conclusions
CAiSE 2017, Essen
Motivation
Predictive Monitoring and Proactive Adaptation
3CAiSE 2017, Essen
monitor
predict
real-time
decision
proactive
adaptation
time
t t + 
planned /
acceptable situations
= Violation
= Non-
Violation

• A. Metzger, P. Leitner, D. Ivanovic, E. Schmieders, R. Franklin, M. Carro, S. Dustdar, and K. Pohl, “Comparing and combining predictive business
process monitoring techniques,” IEEE Trans. on Systems Man Cybernetics: Systems, vol. 45, no. 2, pp. 276–290, 2015.
• Z. Feldmann, F. Fournier, R. Franklin, and A. Metzger, “Industry article: Proactive event processing in action: A case study on the proactive
management of transport processes,” in DEBS 2013, Arlington, Texas, USA, ACM, 2013, pp. 97–106.
e.g., delay in
freight delivery
time
e.g., schedule
faster means of
transport
Motivation
Prediction Accuracy
CAiSE 2017, Essen 4
• Prediction accuracy is key for proactive process adaptation
• Prediction accuracy = ability of prediction technique
• to forecast as many true violations as possible,
• while generating as few false alarms as possible
• True violation  triggering of required adaptations
• Missed required adaptation = less opportunity for proactively preventing
or mitigating a problem
• False alarm  triggering of unnecessary adaptation
• Unnecessary adaptation = additional costs for executing the adaptations,
while not addressing actual problems
Motivation
Prediction Accuracy
• Research focused on aggregate accuracy
• E.g., precision, recall, mean average prediction error, …
• But: aggregate accuracy gives no direct information about error of an
individual prediction
• Prediction reliability estimates provide such information
CAiSE 2017, Essen 5
Aggregate Accuracy
75%
75%
75%
75%
 Distinguish between more or less reliable predictions on case by case basis
Prediction #
1
2
3
…
Reliability Estimate
60%
90%
70%
…
Motivation
Predictive Monitoring with Reliability Estimates
CAiSE 2017, Essen 6
monitor
predict
real-time
decision
proactive
adaptation
time
t t + 
planned /
acceptable situations
= Violation
= Non-
Violation

 ≤ threshold  no adaptation
 > threshold  adaptation
+ Reliability estimate 
Reliability estimates offer more information for decision making
Agenda
1. Motivation
2. Experimental Design
3. Main Results
4. Conclusions
CAiSE 2017, Essen
Experimental Design
Computing Predictions and Reliability Estimates
Foundation: Ensemble prediction using Machine Learning
CAiSE 2017, Essen 8
Prediction T
Reliability 
Process
Monitoring
Data
Classification Model 1
Classification Model m{
{{Each model of ensemble
trained differently
(bagging)
 T1
 Tm
Experimental Design
Cost Model and Experimental Variables
CAiSE 2017, Essen 9
Costs
Adaptation Cost
Adaptation Cost
+ Penalty
 > 
 ≤  No
Adaptation
Adaptation
Reliability 
Violation
Non-Violationeffective
not
effective
0
PenaltyViolation
Non-Violation
• Reliability threshold 
• Adaptation effectiveness 
• Relative adaptation costs : adaptation cost =  · penalty
Experimental Design
Process Model and Data Set
Domain: Freight Transport and Logistics
• One of the most-used industries in the world and in EU
• 15% of GDP (source: KLU), 4,824 megatonnes CO2 (source: DG MOVE),
increase by 40 % in 2030 and by 80% in 2050 (source: ALICE ETP)
• Airfreight process
• 5 months of operational data
• 3 942 process instances
• 56 082 service invocations
10CAiSE 2017, Essen
Point of
Prediction
Agenda
1. Motivation
2. Experimental Design
3. Main Results
4. Conclusions
CAiSE 2017, Essen
Experimental Results
Effect on Process Performance
12CAiSE 2017, Essen
alpha-0.1 alpha-0.2 alpha-0.3 alpha-0.4 alpha-0.5 alpha-0.6 alpha-0.70000005
alpha-0.8000001 alpha-0.9000001 alpha-1.0000001
0,45 0,50 0,55 0,60 0,65 0,70 0,75 0,80 0,85 0,90 0,95 1,00 1,05
Reliability Threshold
0,72
0,74
0,76
0,78
0,8
0,82
0,84
0,86
0,88
NonViolationRate
 (reliability threshold)
Non-violationRate
 = 1
 = .9
 = .8
 = .1
 = .2
 = .7
 = .6
 = .5
 = .4
 = .3
No proactive
process adaptation
Proactive process adaptation
without reliability estimates
.50 .55 .60 .65 .70 .75 .80 .85 .90 .95 1.0





.88
.86
.84
.82
.80
.78
.76
.74
.72

Key:
Negative effect
Positive effect
 Optimum
alpha-0.1 alpha-0.2 alpha-0.3 alpha-0.4 alpha-0
alpha-0.8000001 alpha-0.9000001 alpha-1.0000001
0,45 0,50 0,55 0,60 0,65 0,70 0,75 0
Reliability Thresh
0,72
0,74
0,76
0,78
0,8
0,82
0,84
0,86
0,88
NonViolationRate
alpha-0.1 alpha-0.2 alpha-0.3 alpha-0.4 alpha-0
alpha-0.8000001 alpha-0.9000001 alpha-1.0000001
0,45 0,50 0,55 0,60 0,65 0,70 0,75 0
Reliability Thresh
0,72
0,74
0,76
0,78
0,8
0,82
0,84
0,86
0,88
NonViolationRate
Missed required adaptations
due to high loss of predictions,
not compensated by less
unnecessary adaptations
Experimental Results
Effect on Costs
13CAiSE 2017, Essen
EnsSize=100, BootsSize=80, Voting=simple, AdaptSuccRate=0.80
Tot - Lambda [%] 0 Tot - Lambda [%] 10 Tot - Lambda [%] 20 Tot - Lambda [%] 30
Tot - Lambda [%] 40 Tot - Lambda [%] 50 Tot - Lambda [%] 60 Tot - Lambda [%] 70
0,45 0,50 0,55 0,60 0,65 0,70 0,75 0,80 0,85 0,90 0,95 1,00 1,05
Reliability Threshold
60.000
70.000
80.000
90.000
100.000
110.000
120.000
130.000
Cost
 (reliability threshold)
costs
 = .9
 = .8
 = 1
 = .7
 = .6
 = .5
 = .4
 = .3
 = .2
 = 0
 = .1
.50 .55 .60 .65 .70 .75 .80 .85 .90 .95 1.0






130,000
120,000
110,000
100,000
90,000
80,000
70,000
60,000
No proactive
process adaptation
Proactive process adaptation
without reliability estimates
Key:
Negative effect
Positive effect
 Optimum
alpha-0.1 alpha-0.2 alpha-0.3 alpha-0.4 alpha-0
alpha-0.8000001 alpha-0.9000001 alpha-1.0000001
0,45 0,50 0,55 0,60 0,65 0,70 0,75 0
Reliability Thresh
0,72
0,74
0,76
0,78
0,8
0,82
0,84
0,86
0,88
NonViolationRate
alpha-0.1 alpha-0.2 alpha-0.3 alpha-0.4 alpha-0
alpha-0.8000001 alpha-0.9000001 alpha-1.0000001
0,45 0,50 0,55 0,60 0,65 0,70 0,75 0
Reliability Thresh
0,72
0,74
0,76
0,78
0,8
0,82
0,84
0,86
NonViolationRate
 = .8
Very high adaptation
costs, not compensated
by avoided penalties
Missed required adaptations
(even though cheap) due to
loss of predictions
Experimental Results
Effect on Costs
• Observations for full range of , ,  (= 5000 cases)
• Striving balance between avoiding unnecessary proactive
actions and rejecting required proactive actions
• Cost savings due to proactive process adaptation
• No, in 47.5% of the cases
• Yes, in 52.5% of the cases
• Cost savings due to considering
reliability estimates
• No, in 17,1% of the cases
• Yes, in 82.9% of the cases
14CAiSE 2017, Essen
Cost savings
Frequency
Savings from 2%
to 54%,
14% on average
Agenda
1. Motivation
2. Experimental Design
3. Main Results
4. Conclusions
CAiSE 2017, Essen
Conclusions
Observation
• Considering reliability estimates can have a positive effect on
costs – but not in all situations!
Open Questions
• How to upfront determine these situations?
• How to provide further information for decision making (e.g.,
risk = probability x severity)?
• How to consider different shapes of costs (penalties and
adaptation costs)?
16CAiSE 2017, Essen
Thanks
CAiSE 2017, Essen 17
…the EFRE co-financed operational
program NRW.Ziel2
http://www.lofip.de
…the EU’s Horizon 2020 research and
innovation programme under Objective
ICT-15 ‘Big Data PPP: Large Scale Pilot
Actions ‘
http://www.transformingtransport.eu
Research leading to these results has received
funding from…

More Related Content

Similar to Predictive Process Monitoring Considering Reliability Estimates (20)

PPTX
7Epsilon Risk Based Thinking - ASQ International Conference on Quality Stand...
Meghana Ransing
 
PPTX
Med day presentation
Carsten Lund
 
PDF
Exposure Index
Holger Himmel
 
PPT
Lean Production
xyhfun
 
PDF
Feature Reduction Techniques
Vishal Patel
 
PDF
Health Care Analytics
International School of Engineering
 
PDF
Six Sigma Confidence Interval Analysis (CIA) Training Module
Frank-G. Adler
 
PPTX
Compiling Analysis Results
Matt Hansen
 
PPTX
ATAGTR2017 Artificial Intelligence in Software Testing – Demystified
Agile Testing Alliance
 
PPT
Measurement system analysis Presentation.ppt
jawadullah25
 
PPTX
Measurement System Analysis
Ronald Shewchuk
 
PPT
Toc Education
teddalexander
 
PDF
QCP user manual EN.pdf
Emerson Ceras
 
PPTX
Bayesian Approaches To Improve Sample Size Webinar
nQuery
 
PPTX
software engineering metrics concpets in advanced sotwrae
DurgaDeviP2
 
PPT
7qctools173-100325112603-phpapp01.ppt
Oswaldo Gonzales
 
PPT
Design For Six Sigma Overview
Travis Eck
 
PDF
2011 Acumen Annual Summit Keynote
Acumen
 
PPTX
MGM Agile Dec 28th 2022 (003).pptx
Jalaja Raj
 
PDF
Guide to Improving QA Testing with Gen AI.pdf
kalichargn70th171
 
7Epsilon Risk Based Thinking - ASQ International Conference on Quality Stand...
Meghana Ransing
 
Med day presentation
Carsten Lund
 
Exposure Index
Holger Himmel
 
Lean Production
xyhfun
 
Feature Reduction Techniques
Vishal Patel
 
Six Sigma Confidence Interval Analysis (CIA) Training Module
Frank-G. Adler
 
Compiling Analysis Results
Matt Hansen
 
ATAGTR2017 Artificial Intelligence in Software Testing – Demystified
Agile Testing Alliance
 
Measurement system analysis Presentation.ppt
jawadullah25
 
Measurement System Analysis
Ronald Shewchuk
 
Toc Education
teddalexander
 
QCP user manual EN.pdf
Emerson Ceras
 
Bayesian Approaches To Improve Sample Size Webinar
nQuery
 
software engineering metrics concpets in advanced sotwrae
DurgaDeviP2
 
7qctools173-100325112603-phpapp01.ppt
Oswaldo Gonzales
 
Design For Six Sigma Overview
Travis Eck
 
2011 Acumen Annual Summit Keynote
Acumen
 
MGM Agile Dec 28th 2022 (003).pptx
Jalaja Raj
 
Guide to Improving QA Testing with Gen AI.pdf
kalichargn70th171
 

More from Andreas Metzger (15)

PPTX
Explainable Online Reinforcement Learning for Adaptive Systems
Andreas Metzger
 
PPTX
Data Quality Issues in Online Reinforcement Learning for Self-Adaptive System...
Andreas Metzger
 
PPTX
Explaining Online Reinforcement Learning Decisions of Self-Adaptive Systems
Andreas Metzger
 
PPTX
Antrittsvorlesung - APL.pptx
Andreas Metzger
 
PPTX
Feature Model-Guided Online Reinforcement Learning for Self-Adaptive Services
Andreas Metzger
 
PPTX
Triggering Proactive Business Process Adaptations via Online Reinforcement Le...
Andreas Metzger
 
PPTX
Data-driven AI for Self-Adaptive Software Systems
Andreas Metzger
 
PPTX
Data-driven Deep Learning for Proactive Terminal Process Management
Andreas Metzger
 
PPTX
Big Data Technology Insights
Andreas Metzger
 
PPTX
Proactive Process Adaptation using Deep Learning Ensembles
Andreas Metzger
 
PPTX
Data-driven AI for Self-adaptive Information Systems
Andreas Metzger
 
PPTX
Towards an End-to-End Architecture for Run-time Data Protection in the Cloud
Andreas Metzger
 
PPTX
Considering Non-sequential Control Flows for Process Prediction with Recurren...
Andreas Metzger
 
PPTX
Big Data Value in Mobility and Logistics
Andreas Metzger
 
PDF
Risk-based Proactive Process Adaptation
Andreas Metzger
 
Explainable Online Reinforcement Learning for Adaptive Systems
Andreas Metzger
 
Data Quality Issues in Online Reinforcement Learning for Self-Adaptive System...
Andreas Metzger
 
Explaining Online Reinforcement Learning Decisions of Self-Adaptive Systems
Andreas Metzger
 
Antrittsvorlesung - APL.pptx
Andreas Metzger
 
Feature Model-Guided Online Reinforcement Learning for Self-Adaptive Services
Andreas Metzger
 
Triggering Proactive Business Process Adaptations via Online Reinforcement Le...
Andreas Metzger
 
Data-driven AI for Self-Adaptive Software Systems
Andreas Metzger
 
Data-driven Deep Learning for Proactive Terminal Process Management
Andreas Metzger
 
Big Data Technology Insights
Andreas Metzger
 
Proactive Process Adaptation using Deep Learning Ensembles
Andreas Metzger
 
Data-driven AI for Self-adaptive Information Systems
Andreas Metzger
 
Towards an End-to-End Architecture for Run-time Data Protection in the Cloud
Andreas Metzger
 
Considering Non-sequential Control Flows for Process Prediction with Recurren...
Andreas Metzger
 
Big Data Value in Mobility and Logistics
Andreas Metzger
 
Risk-based Proactive Process Adaptation
Andreas Metzger
 
Ad

Recently uploaded (20)

PDF
Technical-Report-GPS_GIS_RS-for-MSF-finalv2.pdf
KPycho
 
DOCX
🧩 1. Solvent R-WPS Office work scientific
NohaSalah45
 
PPTX
03_Ariane BERCKMOES_Ethias.pptx_AIBarometer_release_event
FinTech Belgium
 
PDF
apidays Singapore 2025 - Streaming Lakehouse with Kafka, Flink and Iceberg by...
apidays
 
PPTX
big data eco system fundamentals of data science
arivukarasi
 
PPTX
04_Tamás Marton_Intuitech .pptx_AI_Barometer_2025
FinTech Belgium
 
PDF
apidays Singapore 2025 - Trustworthy Generative AI: The Role of Observability...
apidays
 
PDF
apidays Singapore 2025 - From API Intelligence to API Governance by Harsha Ch...
apidays
 
PDF
Research Methodology Overview Introduction
ayeshagul29594
 
PPTX
Feb 2021 Ransomware Recovery presentation.pptx
enginsayin1
 
PDF
2025 Global Data Summit - FOM with AI.pdf
Marco Wobben
 
PDF
A GraphRAG approach for Energy Efficiency Q&A
Marco Brambilla
 
PDF
Group 5_RMB Final Project on circular economy
pgban24anmola
 
PDF
5- Global Demography Concepts _ Population Pyramids .pdf
pkhadka824
 
PDF
GOOGLE ADS (1).pdf THE ULTIMATE GUIDE TO
kushalkeshwanisou
 
PPTX
Module-2_3-1eentzyssssssssssssssssssssss.pptx
ShahidHussain66691
 
PDF
IT GOVERNANCE 4-2 - Information System Security (1).pdf
mdirfanuddin1322
 
PPTX
SHREYAS25 INTERN-I,II,III PPT (1).pptx pre
swapnilherage
 
PDF
UNISE-Operation-Procedure-InDHIS2trainng
ahmedabduselam23
 
Technical-Report-GPS_GIS_RS-for-MSF-finalv2.pdf
KPycho
 
🧩 1. Solvent R-WPS Office work scientific
NohaSalah45
 
03_Ariane BERCKMOES_Ethias.pptx_AIBarometer_release_event
FinTech Belgium
 
apidays Singapore 2025 - Streaming Lakehouse with Kafka, Flink and Iceberg by...
apidays
 
big data eco system fundamentals of data science
arivukarasi
 
04_Tamás Marton_Intuitech .pptx_AI_Barometer_2025
FinTech Belgium
 
apidays Singapore 2025 - Trustworthy Generative AI: The Role of Observability...
apidays
 
apidays Singapore 2025 - From API Intelligence to API Governance by Harsha Ch...
apidays
 
Research Methodology Overview Introduction
ayeshagul29594
 
Feb 2021 Ransomware Recovery presentation.pptx
enginsayin1
 
2025 Global Data Summit - FOM with AI.pdf
Marco Wobben
 
A GraphRAG approach for Energy Efficiency Q&A
Marco Brambilla
 
Group 5_RMB Final Project on circular economy
pgban24anmola
 
5- Global Demography Concepts _ Population Pyramids .pdf
pkhadka824
 
GOOGLE ADS (1).pdf THE ULTIMATE GUIDE TO
kushalkeshwanisou
 
Module-2_3-1eentzyssssssssssssssssssssss.pptx
ShahidHussain66691
 
IT GOVERNANCE 4-2 - Information System Security (1).pdf
mdirfanuddin1322
 
SHREYAS25 INTERN-I,II,III PPT (1).pptx pre
swapnilherage
 
UNISE-Operation-Procedure-InDHIS2trainng
ahmedabduselam23
 
Ad

Predictive Process Monitoring Considering Reliability Estimates

  • 1. Predictive Business Process Monitoring Considering Reliability Estimates Andreas Metzger, Felix Föcker Full Paper Presentation at the 29th International Conference on Advanced Information Systems Engineering - CAiSE 2017, Essen, Germany, June 12-16, 2017, Lecture Notes in Computer Science, E. Dubois and K. Pohl, Eds., vol. 10253. Springer, 2017. https://doi.org/10.1007/978-3-319-59536-8_28 (Open Access)
  • 2. Agenda 1. Motivation 2. Experimental Design 3. Main Results 4. Conclusions CAiSE 2017, Essen
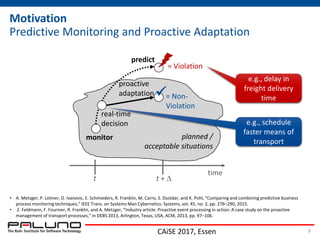
  • 3. Motivation Predictive Monitoring and Proactive Adaptation 3CAiSE 2017, Essen monitor predict real-time decision proactive adaptation time t t +  planned / acceptable situations = Violation = Non- Violation  • A. Metzger, P. Leitner, D. Ivanovic, E. Schmieders, R. Franklin, M. Carro, S. Dustdar, and K. Pohl, “Comparing and combining predictive business process monitoring techniques,” IEEE Trans. on Systems Man Cybernetics: Systems, vol. 45, no. 2, pp. 276–290, 2015. • Z. Feldmann, F. Fournier, R. Franklin, and A. Metzger, “Industry article: Proactive event processing in action: A case study on the proactive management of transport processes,” in DEBS 2013, Arlington, Texas, USA, ACM, 2013, pp. 97–106. e.g., delay in freight delivery time e.g., schedule faster means of transport
  • 4. Motivation Prediction Accuracy CAiSE 2017, Essen 4 • Prediction accuracy is key for proactive process adaptation • Prediction accuracy = ability of prediction technique • to forecast as many true violations as possible, • while generating as few false alarms as possible • True violation  triggering of required adaptations • Missed required adaptation = less opportunity for proactively preventing or mitigating a problem • False alarm  triggering of unnecessary adaptation • Unnecessary adaptation = additional costs for executing the adaptations, while not addressing actual problems
  • 5. Motivation Prediction Accuracy • Research focused on aggregate accuracy • E.g., precision, recall, mean average prediction error, … • But: aggregate accuracy gives no direct information about error of an individual prediction • Prediction reliability estimates provide such information CAiSE 2017, Essen 5 Aggregate Accuracy 75% 75% 75% 75%  Distinguish between more or less reliable predictions on case by case basis Prediction # 1 2 3 … Reliability Estimate 60% 90% 70% …
  • 6. Motivation Predictive Monitoring with Reliability Estimates CAiSE 2017, Essen 6 monitor predict real-time decision proactive adaptation time t t +  planned / acceptable situations = Violation = Non- Violation   ≤ threshold  no adaptation  > threshold  adaptation + Reliability estimate  Reliability estimates offer more information for decision making
  • 7. Agenda 1. Motivation 2. Experimental Design 3. Main Results 4. Conclusions CAiSE 2017, Essen
  • 8. Experimental Design Computing Predictions and Reliability Estimates Foundation: Ensemble prediction using Machine Learning CAiSE 2017, Essen 8 Prediction T Reliability  Process Monitoring Data Classification Model 1 Classification Model m{ {{Each model of ensemble trained differently (bagging)  T1  Tm
  • 9. Experimental Design Cost Model and Experimental Variables CAiSE 2017, Essen 9 Costs Adaptation Cost Adaptation Cost + Penalty  >   ≤  No Adaptation Adaptation Reliability  Violation Non-Violationeffective not effective 0 PenaltyViolation Non-Violation • Reliability threshold  • Adaptation effectiveness  • Relative adaptation costs : adaptation cost =  · penalty
  • 10. Experimental Design Process Model and Data Set Domain: Freight Transport and Logistics • One of the most-used industries in the world and in EU • 15% of GDP (source: KLU), 4,824 megatonnes CO2 (source: DG MOVE), increase by 40 % in 2030 and by 80% in 2050 (source: ALICE ETP) • Airfreight process • 5 months of operational data • 3 942 process instances • 56 082 service invocations 10CAiSE 2017, Essen Point of Prediction
  • 11. Agenda 1. Motivation 2. Experimental Design 3. Main Results 4. Conclusions CAiSE 2017, Essen
  • 12. Experimental Results Effect on Process Performance 12CAiSE 2017, Essen alpha-0.1 alpha-0.2 alpha-0.3 alpha-0.4 alpha-0.5 alpha-0.6 alpha-0.70000005 alpha-0.8000001 alpha-0.9000001 alpha-1.0000001 0,45 0,50 0,55 0,60 0,65 0,70 0,75 0,80 0,85 0,90 0,95 1,00 1,05 Reliability Threshold 0,72 0,74 0,76 0,78 0,8 0,82 0,84 0,86 0,88 NonViolationRate  (reliability threshold) Non-violationRate  = 1  = .9  = .8  = .1  = .2  = .7  = .6  = .5  = .4  = .3 No proactive process adaptation Proactive process adaptation without reliability estimates .50 .55 .60 .65 .70 .75 .80 .85 .90 .95 1.0      .88 .86 .84 .82 .80 .78 .76 .74 .72  Key: Negative effect Positive effect  Optimum alpha-0.1 alpha-0.2 alpha-0.3 alpha-0.4 alpha-0 alpha-0.8000001 alpha-0.9000001 alpha-1.0000001 0,45 0,50 0,55 0,60 0,65 0,70 0,75 0 Reliability Thresh 0,72 0,74 0,76 0,78 0,8 0,82 0,84 0,86 0,88 NonViolationRate alpha-0.1 alpha-0.2 alpha-0.3 alpha-0.4 alpha-0 alpha-0.8000001 alpha-0.9000001 alpha-1.0000001 0,45 0,50 0,55 0,60 0,65 0,70 0,75 0 Reliability Thresh 0,72 0,74 0,76 0,78 0,8 0,82 0,84 0,86 0,88 NonViolationRate Missed required adaptations due to high loss of predictions, not compensated by less unnecessary adaptations
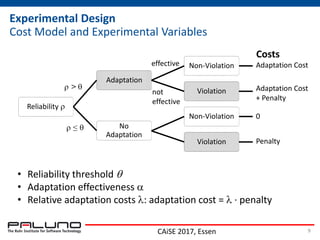
  • 13. Experimental Results Effect on Costs 13CAiSE 2017, Essen EnsSize=100, BootsSize=80, Voting=simple, AdaptSuccRate=0.80 Tot - Lambda [%] 0 Tot - Lambda [%] 10 Tot - Lambda [%] 20 Tot - Lambda [%] 30 Tot - Lambda [%] 40 Tot - Lambda [%] 50 Tot - Lambda [%] 60 Tot - Lambda [%] 70 0,45 0,50 0,55 0,60 0,65 0,70 0,75 0,80 0,85 0,90 0,95 1,00 1,05 Reliability Threshold 60.000 70.000 80.000 90.000 100.000 110.000 120.000 130.000 Cost  (reliability threshold) costs  = .9  = .8  = 1  = .7  = .6  = .5  = .4  = .3  = .2  = 0  = .1 .50 .55 .60 .65 .70 .75 .80 .85 .90 .95 1.0       130,000 120,000 110,000 100,000 90,000 80,000 70,000 60,000 No proactive process adaptation Proactive process adaptation without reliability estimates Key: Negative effect Positive effect  Optimum alpha-0.1 alpha-0.2 alpha-0.3 alpha-0.4 alpha-0 alpha-0.8000001 alpha-0.9000001 alpha-1.0000001 0,45 0,50 0,55 0,60 0,65 0,70 0,75 0 Reliability Thresh 0,72 0,74 0,76 0,78 0,8 0,82 0,84 0,86 0,88 NonViolationRate alpha-0.1 alpha-0.2 alpha-0.3 alpha-0.4 alpha-0 alpha-0.8000001 alpha-0.9000001 alpha-1.0000001 0,45 0,50 0,55 0,60 0,65 0,70 0,75 0 Reliability Thresh 0,72 0,74 0,76 0,78 0,8 0,82 0,84 0,86 NonViolationRate  = .8 Very high adaptation costs, not compensated by avoided penalties Missed required adaptations (even though cheap) due to loss of predictions
  • 14. Experimental Results Effect on Costs • Observations for full range of , ,  (= 5000 cases) • Striving balance between avoiding unnecessary proactive actions and rejecting required proactive actions • Cost savings due to proactive process adaptation • No, in 47.5% of the cases • Yes, in 52.5% of the cases • Cost savings due to considering reliability estimates • No, in 17,1% of the cases • Yes, in 82.9% of the cases 14CAiSE 2017, Essen Cost savings Frequency Savings from 2% to 54%, 14% on average
  • 15. Agenda 1. Motivation 2. Experimental Design 3. Main Results 4. Conclusions CAiSE 2017, Essen
  • 16. Conclusions Observation • Considering reliability estimates can have a positive effect on costs – but not in all situations! Open Questions • How to upfront determine these situations? • How to provide further information for decision making (e.g., risk = probability x severity)? • How to consider different shapes of costs (penalties and adaptation costs)? 16CAiSE 2017, Essen
  • 17. Thanks CAiSE 2017, Essen 17 …the EFRE co-financed operational program NRW.Ziel2 http://www.lofip.de …the EU’s Horizon 2020 research and innovation programme under Objective ICT-15 ‘Big Data PPP: Large Scale Pilot Actions ‘ http://www.transformingtransport.eu Research leading to these results has received funding from…