Discover the power of process mapping to streamline workflows, boost productivity, and drive business efficiency. Learn essential techniques to visualize and optimize your processes effectively.
Describe FIVE benefits of process mapping-SolutionProcess mapping invo.docxcliftonl1
Describe FIVE benefits of process mapping.
Solution
Process mapping involves constructing a flowchart representation indicating processes that shows how a product or transaction is processed and the flows of information or products across supply chains and networks. Some benefits are given below:
Management understanding
Allows a better understanding of the basic processes that are undertaken, so providing management with a convenient overview demonstrating responsibilities and key stages in the supply chain.
Role understanding
Allows workers to understand what their job is and how their work fits into the whole process (and therefore the importance of undertaking their role effectively). Process mapping also allows consideration of role reallocation.
Standardisation
Highlights where opportunities exist to standardise processes and strengthen practices through simple depiction.
Highlights inefficiencies
Visually highlights areas where inefficiencies are present through analysis of queues, value and location, so pinpointing areas of waste. This provides an agenda to tackle duplication of effort, the requirement to complete unnecessary paperwork, and misdirected queries that hold up production, etc.
Supports corporate initiatives
Mapping can be used as a tool as part of a corporate initiative such as customer satisfaction improvement programmes, lean operations, business process re-engineering, etc.
.
The Essential Guide to Process Diagrams for Smarter Business ManagementRUPAL AGARWAL
This presentation serves as a comprehensive guide to using process diagrams in business management. Discover how visual workflows, mapping techniques, and diagrammatic thinking can simplify complex operations, improve communication, and drive organizational efficiency.
The Role of BPMN Diagrams in Advanced Business Process MappingRUPAL AGARWAL
Business Process Model and Notation (BPMN) diagrams play a crucial role in advanced business process mapping by providing a standardized visual representation of workflows. They enhance process clarity, improve communication among stakeholders, and facilitate process automation. BPMN enables organizations to analyze, optimize, and streamline operations by modeling complex business processes with clear symbols and notation. This helps in identifying inefficiencies, ensuring compliance, and improving overall efficiency in business operations.
Suggest to practice EA in a three tier approach rather than a big bang. Point out EA is a planning effort rather than an engineering effort. EA is not the enterprise wide solution architecture. Clarify the confusion of business capability and business process. EA is not business process centric it is the mean to support the end of business capability. Introduce the concept of business floor plan and EA landscape. The business floor plan is similar to the floor plan of a house. EA landscape to present the situation of usage such as the landscape of application, data and technology. Practical EA use the popular EA method such as FEAF, TOGAF, DODAF to design the segment architecture .
This document discusses using a Work Breakdown Structure (WBS) to organize an ERP implementation project. It describes the typical phases of an ERP project based on the ASAP methodology, including project preparation, business blueprint, realization, final preparation, and go-live and support. It then proposes expanding these phases into 11 work packages in a WBS to further break down the project into independent tasks and address potential challenges at each stage. These include activities like system architecture design, configuration and development, data conversion, testing, training, and cutover. The WBS provides a framework for managing the project by assigning responsibilities, estimating costs, and tracking progress for each defined work package and task.
Extending Microsoft Project into a Unified Work Management SolutionMichelle Manimtim
Project management solutions can be isolated silos of information within a much larger and complex enterprise. A variety of tools for managing tasks and work are scattered across the organization, and often perform overlapping and similar functions. Redundancy and duplicate entry of data can be drains on productivity and employee satisfaction. There is a better way! Come see how Tivitie’s Project Connect integrates Project to tools like Wunderlist, Office 365 Planner, TFS, JIRA, and others, to provide a unified work management experience, and dramatic improvements in operational efficiency.
Business intelligence (BI) involves gathering, storing, and analyzing data to help users make business decisions. It includes technologies like reporting, analytics, and data mining. A business object represents real-world things like customers or orders with attributes, behaviors, and relationships. In SAP, BI tools extract data from sources into data warehouses for analysis. Consultants help clients optimize processes and determine BI needs. SAP BI consultants design, implement, and deploy BI solutions, while SAP BO consultants focus more on technical aspects. Salaries for BI and BO consultants range from around $60,000 for entry-level to over $150,000 for more experienced roles.
This document discusses tools and techniques for modeling business processes, improving processes, and implementing ERP systems. It describes how flowcharts and event process chains can be used to map processes. Process modeling helps identify improvement opportunities and supports ERP implementations. The document also outlines keys steps in an ERP implementation project and tools for managing the project lifecycle.
This document provides an overview and summary of the features and capabilities of VersionNine IDEA audit analytics software. In 3 sentences: IDEA is an audit analytics software that simplifies the audit workflow through features like automated documentation, reporting, querying, data analysis, and risk identification capabilities to increase audit effectiveness. It aims to help auditors analyze 100% of transactions, organize their work, automate tasks, and communicate results through various export and reporting options. The software claims to make audits more efficient through its easy to use interface and wide range of analysis, reporting, and automation tools.
Performance Canvas is a business intelligence software that aims to provide business users with easy-to-use self-service analytics capabilities. It can connect to various data sources and be embedded in existing systems. The software offers dashboards, reports, planning and collaboration features to give business users control over business data and insights. It has a simple drag-and-drop interface to reduce the learning curve for business users.
This chapter discusses process modeling, improvement, and ERP implementation. It describes tools for modeling business processes like flowcharts and event process chains. Process modeling helps identify areas for improvement. The chapter also covers evaluating processes for value added activities and using simulation to test improvements. ERP systems provide workflow tools to automate processes. Managing organizational change is key to a successful ERP implementation.
This document discusses an SAP integrated business intelligence portal solution. It provides examples of how a BI portal can integrate data from diverse sources, present information in formats for different stakeholders, and guarantee performance, availability, and security. Specific examples discussed include balance sheet consolidation from multiple systems, executive presentations combining executed, budgeted and projected values, and margin analysis with multi-unit drill downs. The document also covers infrastructure design and advantages of BI portals like minimal training and transparent access to real-time enterprise data.
Jeamaire Drone’s Business Intelligence PortfolioHESABLE1
This document provides an overview of the author's Business Intelligence portfolio, including projects and skills developed in areas such as data modeling, SQL programming, SSIS, SSAS, MDX programming, SSRS, and PerformancePoint/SharePoint. It includes examples of the author's work in designing a data model for a construction company, writing SQL queries, developing SSIS packages to load data from files into a database, building SSAS cubes and calculations, writing MDX queries, and developing SSRS and PerformancePoint reports deployed to SharePoint.
Enterprise Approach towards Cost Savings and Enterprise AgilityNUS-ISS
Presented by Mr Poon See Hong, Deputy Director (Planning), Police Logistics Department, Singapore Police Force, at our 14th Architecture Community of Practice Forum on 21 Jul 2016.
Numerify IT Service Analytics for ServiceNowNumerify
Numerify360 is a suite of cloud-based analytic applications designed for IT service management tools like ServiceNow. It mines data from these tools to provide actionable insights through dashboards and reports. This helps IT teams better manage resources, track SLA performance, and improve efficiency. Managers can use the analytics to identify bottlenecks, maximize team performance, and lower costs.
This document discusses process analysis tools. It defines process analysis as evaluating current business operations. Tools described for process analysis include flow charts, time-function mapping, value stream analysis, process charts, and service blueprints. Flow charts use symbols to show each step in a process linked by arrows. Time-function mapping uses a flowchart and timeline to identify time-consuming steps. Value stream analysis isolates non-value adding steps. Process charts record work flows simply. Service blueprints focus on customer interactions and separate service processes by interaction level.
PCSOFT ERP Solutions is an Indian company established in 1990 that provides ERP and business intelligence software and services. It operates in industries like manufacturing, retail, logistics, and consumer goods. The presentation discusses PCSOFT's business intelligence extension to its ERP product, which uses technologies like SQL Server Integration Services, SQL Server Analysis Services, and SQL Server Reporting Services to integrate data from multiple sources and provide analytics and reporting capabilities. It also covers PCSOFT's plans to develop a mobile application for its ERP software using Android and material design principles to allow customers to access information anytime on their smartphones.
Department of the Interior’s Methodology for Business Transformation (MBT)Nathaniel Palmer
1. The document summarizes the Department of the Interior's (DOI) methodology for business architecture transformation called the Methodology for Business Transformation (MBT).
2. The MBT is a multi-step process that includes analyzing stakeholders, business processes, current IT systems, and defining target business and technology architectures.
3. The goal is to facilitate effective business transformation across the DOI through enterprise improvement, establishing clear lines of sight from investments to outcomes, and optimizing business processes.
Department of the Interior’s Methodology for Business Transformation (MBT)Nathaniel Palmer
1. The document summarizes the Department of the Interior's (DOI) methodology for business architecture transformation called the Methodology for Business Transformation (MBT).
2. The MBT is a multi-step process that includes analyzing stakeholders, business processes, current IT systems, and defining target business and technology architectures.
3. The goal is to establish a line of sight from investments to business processes and outcomes to improve performance through enterprise improvement, which takes a collaborative approach across the DOI.
Dynamics Day 2014: Microsoft Dynamics AX - Business Insight Leveraging AnalyticsIntergen
A close-up look at how to leverage analytics functionality in Microsoft Dynamics AX, covering traditional BI, modifying role centres and Power BI.
Dynamics Day is Australasia's leading event for users of Microsoft Dynamics. For those of you who couldn't make it along to the event, we have made all session content available online.
The document provides an overview of work flow diagrams:
- It defines a work flow diagram as a graphic representation that defines the steps of a process from start to finish using symbols and shapes.
- Work flow diagrams are used to visualize business processes, standardize critical areas, and define employee roles and responsibilities.
- There are different types of work flow diagrams like ANSI flowcharts, UML activity diagrams, and BPMN diagrams that are used in various industries.
- Common symbols in work flow diagrams include shapes for starting/ending points, actions, decisions, and connections between steps.
Leveraging MS BI Toolset to Monitor Performance - TechFuse 2010Dan English
There are many different pieces in the Microsoft BI toolset. In this session, we will take a look at all of the different pieces and utilize each of them to create a unified dashboard, where each component is being leveraged. The tools that will be utilized during this session will include SQL Server 2008, SSRS 2008, SSAS 2008, Excel 2007, Excel Services, PPS 2007, Dashboard Designer, SharePoint Server 2007 and more.
Tutorial Video: https://youtu.be/7BDcv-eFuG4
Website: https://www.elewayte.com/
LinkedIn: https://www.linkedin.com/company/elewayte-an-online-training-company/
Instagram: https://www.instagram.com/elewayte_edu/
Contact: 6383453564
WhatsApp: https://bit.ly/42nDsN1
Expert: Hitendra Dixit
About Power Bi:
Power BI is a powerful business intelligence tool developed by Microsoft that enables users to analyze, visualize, and share data in a user-friendly manner. It helps organizations gain valuable insights from their data and make informed decisions.
With Power BI, users can connect to a wide range of data sources, including databases, spreadsheets, online services, and cloud platforms. It allows for easy data transformation and modelling, enabling users to shape and combine data from multiple sources to create meaningful relationships.
One of the key strengths of Power BI lies in its data visualization capabilities. It provides a wide variety of visualizations, such as charts, graphs, maps, and tables, which can be customized to suit specific needs. These visuals can be used to present data in a compelling and intuitive manner, making it easier for users to understand complex information.
Power BI also offers interactive dashboards and reports that allow users to explore data dynamically. This interactivity enables users to drill down into specific details, filter data, and ask ad-hoc questions, leading to deeper insights and a better understanding of the data.
Moreover, Power BI facilitates data sharing and collaboration within an organization. Users can publish their reports and dashboards to the Power BI service, making them accessible to colleagues and stakeholders. This allows for real-time data updates and seamless sharing of insights across teams, promoting data-driven decision-making.
Power BI is particularly important for business professionals, analysts, and decision-makers who deal with large volumes of data. It empowers them to transform raw data into actionable insights without the need for complex coding or technical expertise. Additionally, Power BI can be used across various industries, including finance, marketing, sales, operations, and human resources, making it a valuable tool for organizations of all sizes and sectors.
In conclusion, Power BI is an essential tool for data analysis and visualization, enabling organizations to unlock the power of their data. Its user-friendly interface, powerful data modelling capabilities, and interactive visualizations make it indispensable for users seeking to gain insights, make data-driven decisions, and share information effectively.
Business process management (BPM) is the discipline of improving a business process from end to end by analyzing it, modelling how it works in different scenarios, executing improvements, monitoring the improved process and continually optimizing it.
Unlocking Process Excellence with SAP Signavio Process IntelligenceRUPAL AGARWAL
This presentation introduces SAP Signavio Process Intelligence, a data-driven process mining solution that empowers businesses to visualize, analyze, and improve their operations. Learn how real-time insights and deep process understanding drive transformation, compliance, and efficiency.
Retail Stores of the Future: Innovations Shaping Tomorrow’s Shopping ExperienceRUPAL AGARWAL
Explore how cutting-edge technologies like AI, AR/VR, robotics, and smart analytics are revolutionizing the retail landscape. This presentation dives into the transformation of physical stores into interactive, data-driven, and hyper-personalized environments designed to meet the needs of the future consumer.
Ad
More Related Content
Similar to Process Mapping Essentials: A Roadmap for Business Efficiency (20)
Extending Microsoft Project into a Unified Work Management SolutionMichelle Manimtim
Project management solutions can be isolated silos of information within a much larger and complex enterprise. A variety of tools for managing tasks and work are scattered across the organization, and often perform overlapping and similar functions. Redundancy and duplicate entry of data can be drains on productivity and employee satisfaction. There is a better way! Come see how Tivitie’s Project Connect integrates Project to tools like Wunderlist, Office 365 Planner, TFS, JIRA, and others, to provide a unified work management experience, and dramatic improvements in operational efficiency.
Business intelligence (BI) involves gathering, storing, and analyzing data to help users make business decisions. It includes technologies like reporting, analytics, and data mining. A business object represents real-world things like customers or orders with attributes, behaviors, and relationships. In SAP, BI tools extract data from sources into data warehouses for analysis. Consultants help clients optimize processes and determine BI needs. SAP BI consultants design, implement, and deploy BI solutions, while SAP BO consultants focus more on technical aspects. Salaries for BI and BO consultants range from around $60,000 for entry-level to over $150,000 for more experienced roles.
This document discusses tools and techniques for modeling business processes, improving processes, and implementing ERP systems. It describes how flowcharts and event process chains can be used to map processes. Process modeling helps identify improvement opportunities and supports ERP implementations. The document also outlines keys steps in an ERP implementation project and tools for managing the project lifecycle.
This document provides an overview and summary of the features and capabilities of VersionNine IDEA audit analytics software. In 3 sentences: IDEA is an audit analytics software that simplifies the audit workflow through features like automated documentation, reporting, querying, data analysis, and risk identification capabilities to increase audit effectiveness. It aims to help auditors analyze 100% of transactions, organize their work, automate tasks, and communicate results through various export and reporting options. The software claims to make audits more efficient through its easy to use interface and wide range of analysis, reporting, and automation tools.
Performance Canvas is a business intelligence software that aims to provide business users with easy-to-use self-service analytics capabilities. It can connect to various data sources and be embedded in existing systems. The software offers dashboards, reports, planning and collaboration features to give business users control over business data and insights. It has a simple drag-and-drop interface to reduce the learning curve for business users.
This chapter discusses process modeling, improvement, and ERP implementation. It describes tools for modeling business processes like flowcharts and event process chains. Process modeling helps identify areas for improvement. The chapter also covers evaluating processes for value added activities and using simulation to test improvements. ERP systems provide workflow tools to automate processes. Managing organizational change is key to a successful ERP implementation.
This document discusses an SAP integrated business intelligence portal solution. It provides examples of how a BI portal can integrate data from diverse sources, present information in formats for different stakeholders, and guarantee performance, availability, and security. Specific examples discussed include balance sheet consolidation from multiple systems, executive presentations combining executed, budgeted and projected values, and margin analysis with multi-unit drill downs. The document also covers infrastructure design and advantages of BI portals like minimal training and transparent access to real-time enterprise data.
Jeamaire Drone’s Business Intelligence PortfolioHESABLE1
This document provides an overview of the author's Business Intelligence portfolio, including projects and skills developed in areas such as data modeling, SQL programming, SSIS, SSAS, MDX programming, SSRS, and PerformancePoint/SharePoint. It includes examples of the author's work in designing a data model for a construction company, writing SQL queries, developing SSIS packages to load data from files into a database, building SSAS cubes and calculations, writing MDX queries, and developing SSRS and PerformancePoint reports deployed to SharePoint.
Enterprise Approach towards Cost Savings and Enterprise AgilityNUS-ISS
Presented by Mr Poon See Hong, Deputy Director (Planning), Police Logistics Department, Singapore Police Force, at our 14th Architecture Community of Practice Forum on 21 Jul 2016.
Numerify IT Service Analytics for ServiceNowNumerify
Numerify360 is a suite of cloud-based analytic applications designed for IT service management tools like ServiceNow. It mines data from these tools to provide actionable insights through dashboards and reports. This helps IT teams better manage resources, track SLA performance, and improve efficiency. Managers can use the analytics to identify bottlenecks, maximize team performance, and lower costs.
This document discusses process analysis tools. It defines process analysis as evaluating current business operations. Tools described for process analysis include flow charts, time-function mapping, value stream analysis, process charts, and service blueprints. Flow charts use symbols to show each step in a process linked by arrows. Time-function mapping uses a flowchart and timeline to identify time-consuming steps. Value stream analysis isolates non-value adding steps. Process charts record work flows simply. Service blueprints focus on customer interactions and separate service processes by interaction level.
PCSOFT ERP Solutions is an Indian company established in 1990 that provides ERP and business intelligence software and services. It operates in industries like manufacturing, retail, logistics, and consumer goods. The presentation discusses PCSOFT's business intelligence extension to its ERP product, which uses technologies like SQL Server Integration Services, SQL Server Analysis Services, and SQL Server Reporting Services to integrate data from multiple sources and provide analytics and reporting capabilities. It also covers PCSOFT's plans to develop a mobile application for its ERP software using Android and material design principles to allow customers to access information anytime on their smartphones.
Department of the Interior’s Methodology for Business Transformation (MBT)Nathaniel Palmer
1. The document summarizes the Department of the Interior's (DOI) methodology for business architecture transformation called the Methodology for Business Transformation (MBT).
2. The MBT is a multi-step process that includes analyzing stakeholders, business processes, current IT systems, and defining target business and technology architectures.
3. The goal is to facilitate effective business transformation across the DOI through enterprise improvement, establishing clear lines of sight from investments to outcomes, and optimizing business processes.
Department of the Interior’s Methodology for Business Transformation (MBT)Nathaniel Palmer
1. The document summarizes the Department of the Interior's (DOI) methodology for business architecture transformation called the Methodology for Business Transformation (MBT).
2. The MBT is a multi-step process that includes analyzing stakeholders, business processes, current IT systems, and defining target business and technology architectures.
3. The goal is to establish a line of sight from investments to business processes and outcomes to improve performance through enterprise improvement, which takes a collaborative approach across the DOI.
Dynamics Day 2014: Microsoft Dynamics AX - Business Insight Leveraging AnalyticsIntergen
A close-up look at how to leverage analytics functionality in Microsoft Dynamics AX, covering traditional BI, modifying role centres and Power BI.
Dynamics Day is Australasia's leading event for users of Microsoft Dynamics. For those of you who couldn't make it along to the event, we have made all session content available online.
The document provides an overview of work flow diagrams:
- It defines a work flow diagram as a graphic representation that defines the steps of a process from start to finish using symbols and shapes.
- Work flow diagrams are used to visualize business processes, standardize critical areas, and define employee roles and responsibilities.
- There are different types of work flow diagrams like ANSI flowcharts, UML activity diagrams, and BPMN diagrams that are used in various industries.
- Common symbols in work flow diagrams include shapes for starting/ending points, actions, decisions, and connections between steps.
Leveraging MS BI Toolset to Monitor Performance - TechFuse 2010Dan English
There are many different pieces in the Microsoft BI toolset. In this session, we will take a look at all of the different pieces and utilize each of them to create a unified dashboard, where each component is being leveraged. The tools that will be utilized during this session will include SQL Server 2008, SSRS 2008, SSAS 2008, Excel 2007, Excel Services, PPS 2007, Dashboard Designer, SharePoint Server 2007 and more.
Tutorial Video: https://youtu.be/7BDcv-eFuG4
Website: https://www.elewayte.com/
LinkedIn: https://www.linkedin.com/company/elewayte-an-online-training-company/
Instagram: https://www.instagram.com/elewayte_edu/
Contact: 6383453564
WhatsApp: https://bit.ly/42nDsN1
Expert: Hitendra Dixit
About Power Bi:
Power BI is a powerful business intelligence tool developed by Microsoft that enables users to analyze, visualize, and share data in a user-friendly manner. It helps organizations gain valuable insights from their data and make informed decisions.
With Power BI, users can connect to a wide range of data sources, including databases, spreadsheets, online services, and cloud platforms. It allows for easy data transformation and modelling, enabling users to shape and combine data from multiple sources to create meaningful relationships.
One of the key strengths of Power BI lies in its data visualization capabilities. It provides a wide variety of visualizations, such as charts, graphs, maps, and tables, which can be customized to suit specific needs. These visuals can be used to present data in a compelling and intuitive manner, making it easier for users to understand complex information.
Power BI also offers interactive dashboards and reports that allow users to explore data dynamically. This interactivity enables users to drill down into specific details, filter data, and ask ad-hoc questions, leading to deeper insights and a better understanding of the data.
Moreover, Power BI facilitates data sharing and collaboration within an organization. Users can publish their reports and dashboards to the Power BI service, making them accessible to colleagues and stakeholders. This allows for real-time data updates and seamless sharing of insights across teams, promoting data-driven decision-making.
Power BI is particularly important for business professionals, analysts, and decision-makers who deal with large volumes of data. It empowers them to transform raw data into actionable insights without the need for complex coding or technical expertise. Additionally, Power BI can be used across various industries, including finance, marketing, sales, operations, and human resources, making it a valuable tool for organizations of all sizes and sectors.
In conclusion, Power BI is an essential tool for data analysis and visualization, enabling organizations to unlock the power of their data. Its user-friendly interface, powerful data modelling capabilities, and interactive visualizations make it indispensable for users seeking to gain insights, make data-driven decisions, and share information effectively.
Business process management (BPM) is the discipline of improving a business process from end to end by analyzing it, modelling how it works in different scenarios, executing improvements, monitoring the improved process and continually optimizing it.
Unlocking Process Excellence with SAP Signavio Process IntelligenceRUPAL AGARWAL
This presentation introduces SAP Signavio Process Intelligence, a data-driven process mining solution that empowers businesses to visualize, analyze, and improve their operations. Learn how real-time insights and deep process understanding drive transformation, compliance, and efficiency.
Retail Stores of the Future: Innovations Shaping Tomorrow’s Shopping ExperienceRUPAL AGARWAL
Explore how cutting-edge technologies like AI, AR/VR, robotics, and smart analytics are revolutionizing the retail landscape. This presentation dives into the transformation of physical stores into interactive, data-driven, and hyper-personalized environments designed to meet the needs of the future consumer.
Enhancing Real-Time Monitoring with GIS, BIM & Digital Twin TechnologiesRUPAL AGARWAL
This presentation delves into how Geographic Information Systems (GIS), Building Information Modeling (BIM), and Digital Twin technologies integrate to enable real-time monitoring, predictive analysis, and intelligent decision-making in infrastructure and urban development. Learn how these advanced tools revolutionize asset management, operational efficiency, and sustainability.
Success Strategies in Family-Run Retail BusinessesRUPAL AGARWAL
This presentation explores the unique dynamics, challenges, and advantages of family-run retail businesses. It provides insights into operational models, conflict resolution, succession planning, and modern retail strategies that help family-owned businesses thrive in a competitive market.
Building the Future: Leveraging GIS and BIM for Sustainable Digital TwinsRUPAL AGARWAL
This presentation explores how the integration of Geographic Information Systems (GIS) and Building Information Modeling (BIM) enables the creation of infrastructure digital twins that drive sustainable development. It highlights how digital twins support real-time data analysis, lifecycle management, environmental impact reduction, and smarter urban planning, ultimately empowering resilient and efficient infrastructure solutions.
Mastering Communication with the Next Generation of CustomersRUPAL AGARWAL
This presentation explores effective strategies, tools, and mindsets required to engage, understand, and build trust with GenNext customers—digital natives who value personalization, authenticity, and social responsibility. It highlights key communication trends, platform preferences, behavioral insights, and practical tips for businesses aiming to future-proof their customer engagement.
This presentation highlights how digital twin technology can revolutionize energy optimization in educational institutions. It covers the integration of real-time data, simulation models, and IoT systems to monitor, predict, and reduce energy consumption, promoting sustainability and cost-efficiency in school operations.
Unlocking the Future with Predictive AnalyticsRUPAL AGARWAL
This presentation explores the fundamentals and applications of predictive analytics, including data modeling, machine learning techniques, and real-world use cases in business, healthcare, and finance. Learn how organizations leverage historical data to forecast trends, make informed decisions, and gain a competitive edge.
BPMS 2.0: The Future of Intelligent Business Process ManagementRUPAL AGARWAL
Explore BPMS 2.0 — the next generation of Business Process Management Systems — that integrates automation, AI, cloud, and real-time analytics to streamline operations, enhance agility, and drive smarter decision-making. This presentation breaks down the evolution from traditional BPM to BPMS 2.0 and how it empowers organizations to thrive in a fast-paced digital world.
Harnessing Hyper-Localisation: A New Era in Retail StrategyRUPAL AGARWAL
Discover how hyper-localisation is transforming the retail landscape by allowing businesses to tailor products, services, and marketing strategies to meet the unique needs of specific communities. This presentation explores the concept, benefits, and real-world examples of hyper-localisation in action, helping retailers boost customer satisfaction and drive growth.
Revolutionizing Supermarket Customer Experience: Smarter Layouts and Seamless...RUPAL AGARWAL
This presentation explores innovative strategies to transform supermarket customer experience by reimagining store layouts and optimizing checkout designs. Learn how to enhance shopper satisfaction, reduce wait times, and boost overall sales through thoughtful design improvements and data-driven insights.
Revolutionizing Construction Project Management with GIS-BIM Integration and ...RUPAL AGARWAL
This presentation explores how the integration of Geographic Information Systems (GIS), Building Information Modeling (BIM), and Digital Twin technologies is transforming construction project management. It highlights real-time data synchronization, improved planning and coordination, lifecycle asset management, and enhanced decision-making for smarter, more sustainable infrastructure development.
Enhancing Customer Experience in Supermarkets: Strategies for 2025 and BeyondRUPAL AGARWAL
This presentation outlines practical strategies to elevate customer experience (CX) in supermarkets. It covers customer journey mapping, technology integration, staff training, store layout optimization, and loyalty programs. Designed for managers and stakeholders looking to boost satisfaction, engagement, and retention in an increasingly competitive retail environment.
How Hyper-Localization Helps Retail Chain Stores Stay Ahead of Regional Compe...RUPAL AGARWAL
This presentation dives into the power of hyper-localization in retail. Learn how national and global retail chains can tailor offerings, marketing, and customer experiences to outperform regional competitors and drive customer loyalty in diverse local markets.
Optimizing School Infrastructure with BIM-Based Asset MappingRUPAL AGARWAL
Discover how Building Information Modeling (BIM) revolutionizes school infrastructure management. This presentation explores BIM-based asset mapping techniques to streamline maintenance, enhance planning, and boost operational efficiency in educational institutions.
Value Stream Mapping (VSM): Visualizing Processes for Continuous Improvement ...RUPAL AGARWAL
This PDF explores the concept of Value Stream Mapping (VSM), offering a visual framework to understand business processes. It highlights how VSM helps organizations identify inefficiencies, minimize waste, and streamline workflows. By focusing on continuous improvement, VSM supports the enhancement of operational performance and customer satisfaction.
Tackling Pharmacy Retail Challenges: Smart Strategies for Sustainable GrowthRUPAL AGARWAL
This presentation explores the key challenges faced by pharmacy retailers in today’s dynamic healthcare landscape, including regulatory hurdles, supply chain disruptions, and competitive pricing pressures. It also provides practical, tactful solutions to overcome these issues—ensuring profitability, compliance, and customer satisfaction in the evolving pharmacy retail sector.
Retail Athleisure: The Fusion of Fashion, Fitness, and FunctionRUPAL AGARWAL
Explore the booming athleisure market and how retail brands are redefining style and comfort. This presentation dives into consumer trends, brand strategies, and the future of athleisure in the retail landscape.
The Importance of Procedure Flow Charts in Streamlining Operations | Boost Ef...RUPAL AGARWAL
Discover how procedure flow charts simplify complex processes, enhance clarity, and boost operational efficiency. Learn their key role in streamlining business workflows.
Streamlining Workflow: Enhancing Management with Procedure Flow ChartsRUPAL AGARWAL
This presentation delves into how procedure flow charts can transform workflow management by visualizing processes, identifying inefficiencies, and promoting better team coordination. Perfect for operations managers, team leads, and process analysts, it explains the types, benefits, and best practices of flow charting with practical examples. Learn how to map, analyze, and optimize workflows to boost productivity and reduce errors across any organization.
From Dreams to Threads: The Story Behind The ChhapaiThe Chhapai
Chhapai is a direct-to-consumer (D2C) lifestyle fashion brand founded by Akash Sharma. We believe in providing the best quality printed & graphic t-shirts & hoodies so you can express yourself through what you wear, because everything can’t be explained in words.
**Title:** Accounting Basics – A Complete Visual Guide
**Author:** CA Suvidha Chaplot
**Description:**
Whether you're a beginner in business, a commerce student, or preparing for professional exams, understanding the language of business — **accounting** — is essential. This beautifully designed SlideShare simplifies key accounting concepts through **colorful infographics**, clear examples, and smart layouts.
From understanding **why accounting matters** to mastering **core principles, standards, types of accounts, and the accounting equation**, this guide covers everything in a visual-first format.
📘 **What’s Inside:**
* **Introduction to Accounting**: Definition, objectives, scope, and users
* **Accounting Concepts & Principles**: Business Entity, Accruals, Matching, Going Concern, and more
* **Types of Accounts**: Asset, Liability, Equity explained visually
* **The Accounting Equation**: Assets = Liabilities + Equity broken down with diagrams
* BONUS: Professionally designed cover for presentation or academic use
🎯 **Perfect for:**
* Students (Commerce, BBA, MBA, CA Foundation)
* Educators and Trainers
* UGC NET/Assistant Professor Aspirants
* Anyone building a strong foundation in accounting
👩🏫 **Designed & curated by:** CA Suvidha Chaplot
Explore the growing trend of payroll outsourcing in the UK with key 2025 statistics, market insights, and benefits for accounting firms. This infographic highlights why more firms are turning to outsourced payroll services for UK businesses to boost compliance, cut costs, and streamline operations. Discover how QXAS can help your firm stay ahead.
for more details visit:- https://qxaccounting.com/uk/service/payroll-outsourcing/
Yuriy Chapran: Zero Trust and Beyond: OpenVPN’s Role in Next-Gen Network Secu...Lviv Startup Club
Yuriy Chapran: Zero Trust and Beyond: OpenVPN’s Role in Next-Gen Network Security (UA)
UA Online PMDay 2025 Spring
Website – https://pmday.org/online
Youtube – https://www.youtube.com/startuplviv
FB – https://www.facebook.com/pmdayconference
Looking for Reliable BPO Project Providers?"anujascentbpo
"Looking for Reliable BPO Project Providers?" tailored for businesses potentially seeking outsourcing partners, especially those in or considering Noida and India.
India Advertising Market Size & Growth | Industry TrendsAman Bansal
The advertising market in India is rapidly growing, driven by the increasing consumption of digital media, mobile usage, and evolving consumer behaviors. Traditional media like TV and print continue to hold a significant share, while digital platforms, including social media and online video, are expanding swiftly. As brands focus on reaching diverse audiences, the market sees innovation in formats like influencer marketing, targeted ads, and regional content. This dynamic landscape offers vast opportunities for both domestic and global players in the advertising sector.
Kiran Flemish is a dynamic musician, composer, and student leader pursuing a degree in music with a minor in film and media studies. As a talented tenor saxophonist and DJ, he blends jazz with modern digital production, creating original compositions using platforms like Logic Pro and Ableton Live. With nearly a decade of experience as a private instructor and youth music coach, Kiran is passionate about mentoring the next generation of musicians. He has hosted workshops, raised funds for causes like the Save the Music Foundation and Type I Diabetes research, and is eager to expand his career in music licensing and production.
The Peter Cowley Entrepreneurship Event Master 30th.pdfRichard Lucas
About this event
The event is dedicated to remember the contribution Peter Cowley made to the entrepreneurship eco-system in Cambridge and beyond, and includes a special lecture about his impact..
We aim to make the event useful and enjoyable for all those who are committed to entrepreneurship.
Programme
Registration and Networking
Introduction & Welcome
The Invested Investor Peter Cowley Entrepreneurship Talk, by Katy Tuncer Linkedin
Introductions from key actors in the entrepreneurship support eco-system
Cambridge Angels Emmi Nicholl Managing Director Linkedin
Cambridge University Entrepreneurs , Emre Isik President Elect Linkedin
CUTEC Annur Ababil VP Outreach Linkedin
King's Entrepreneurship Lab (E-Lab) Sophie Harbour Linkedin
Cambridgeshire Chambers of Commerce Charlotte Horobin CEO Linkedin
St John's Innovation Centre Ltd Barnaby Perks CEO Linkedin
Presentations by entrepreneurs from Cambridge and Anglia Ruskin Universities
Jeremy Leong Founder Rainbow Rocket Climbing Wall Linkedin
Mark Kotter Founder - bit.bio https://www.bit.bio Linkedin
Talha Mehmood Founder CEO Medily Linkedin
Alison Howie Cambridge Adaptive Testing Linkedin
Mohammad Najilah, Director of the Medical Technology Research Centre, Anglia Ruskin University Linkedin
Q&A
Guided Networking
Light refreshments will be served. Many thanks to Penningtons Manches Cooper and Anglia Ruskin University for covering the cost of catering, and to Anglia Ruskin University for providing the venue
The event is hosted by
Prof. Gary Packham Linkedin Pro Vice Chancellor Anglia Ruskin University
Richard Lucas Linkedin Founder CAMentrepreneurs
About Peter Cowley
Peter Cowley ARU Doctor of Business Administration, honoris causa.
Author of Public Success Private Grief
Co-Founder CAMentrepreneurs & Honorary Doctorate from Anglia Ruskin.
Chair of Cambridge Angels, UK Angel Investor of the Year, President of European Business Angels Network Wikipedia. Peter died in November 2024.
About Anglia Ruskin University - ARU
ARU was the recipient of the Times Higher Education University of the Year 2023 and is a global university with students from 185 countries coming to study at the institution. Anglia Ruskin prides itself on being enterprising, and innovative, and nurtures those qualities in students and graduates through mentorship, support and start-up funding on offer through the Anglia Ruskin Enterprise Academy. ARU was the first in the UK to receive the prestigious Entrepreneurial University Award from the National Centre for Entrepreneurship in Education (NCEE), and students, businesses, and partners all benefit from the outstanding facilities available.
About CAMentrepreneurs
CAMentrepreneurs supports business and social entrepreneurship among Cambridge University Alumni, students and others. Since its launch in 2016 CAMentrepreneurs has held more than 67 events in Boston, Cambridge, Dallas, Dubai, Edinburgh, Glasgow, Helsinki, Hong Kong, Houston, Lisbon, London, Oxford, Paris, New
From Sunlight to Savings The Rise of Homegrown Solar Power.pdfInsolation Energy
With the rise in climate change and environmental concerns, many people are turning to alternative options for the betterment of the environment. The best option right now is solar power, due to its affordability, and long-term value.
Diagrams are key to architectural work, aligning teams and guiding business decisions. This session covers best practices for transforming text into clear flowcharts using standard components and professional styling. Learn to create, customize, and reuse high-quality diagrams with tools like Miro, Lucidchart, ... Join us for hands-on learning and elevate your diagramming skills!
NewBase 28 April 2025 Energy News issue - 1783 by Khaled Al Awadi_compressed...Khaled Al Awadi
Greetings
Attached our latest energy news
NewBase 28 April 2025 Energy News issue - 1783 by Khaled Al AwadiGreetings
Attached our latest energy news
NewBase 28 April 2025 Energy News issue - 1783 by Khaled Al AwadiGreetings
Attached our latest energy news
NewBase 28 April 2025 Energy News issue - 1783 by Khaled Al Awadi
Oleksandra Apanasenkova: Must, Should, Could Have Ретроспективи в команді (UA)Lviv Startup Club
Oleksandra Apanasenkova: Must, Should, Could Have Ретроспективи в команді (UA)
UA Online PMDay 2025 Spring
Website – https://pmday.org/online
Youtube – https://www.youtube.com/startuplviv
FB – https://www.facebook.com/pmdayconference
Mr. Habib is currently the Founder and President of Manhattan Strategy Group (MSG) an INC 5000 company based out of Washington, DC. Mr. Habib advises the US Government on large scale multibillion-dollar Human Development and other major Federal initiatives.
Mr. Habib has over 20 years of international business and strategy experience that spans across 30 countries. Mr. Habib brings with him business and financial advisory expertise as well as policy experience in both public and private sectors. Mr. Habib excels at new ventures, strategic planning, economic & industry analysis, market assessments, evaluation analysis, due diligence, deal structuring, relationship management, and results driven turnaround efforts.
Mr. Habib is currently the Founder and President of Manhattan Strategy Group (MSG) an INC 5000 company based out of Washington, DC. Mr. Habib advises the US Government on large scale multibillion-dollar Human Development and other major Federal initiatives, including but not limited to Education, Human Services and Workforce programs. Mr. Habib has also advised Fortune 100 clients in the energy, healthcare, consumer goods, financial services, and technology sectors (e.g. Microsoft, Google, Proctor & Gamble, Pfizer, American Express, Dow Chemical, AT&T).
Mr. Habib also establish Indus, the first Pakistan focused diaspora run policy and research focused independent/objective Think Tank in Washington DC and served as the organization’s Special Advisor. In his role, Mr. Habib oversaw strategic direction with a key focus on improving US-Pakistan dialogue and programming. Under Mr. Habib’s leadership, Indus developed partnerships with key academic institutions (John Hopkins, Georgetown, etc.) and prominent U.S. based think tanks (Wilson Center, Middle East Institute, USIP, Atlantic Council, and others) and conducted over two dozen successful policy related events in order to facilitate dialogue and understanding in a critical bilateral relationship. Given his tenure at Indus and
previous experience, Mr. Habib has a strong understanding of the Pakistan landscape with access to the highest levels of Government, private sector, and NGOs throughout Pakistan.
Alaska Silver: Developing Critical Minerals & High-Grade Silver Resources
Alaska Silver is advancing a prolific 8-km mineral corridor hosting two significant deposits. Our flagship high-grade silver deposit at Waterpump Creek, which contains gallium (the U.S. #1 critical mineral), and the historic Illinois Creek mine anchor our 100% owned carbonate replacement system across an expansive, underexplored landscape.
Waterpump Creek: 75 Moz @ 980 g/t AgEq (Inferred), open for expansion north and south
Illinois Creek: 525 Koz AuEq - 373 Koz @ 1.3 g/t AuEq (Indicated), 152 Koz @ 1.44 g/t AuEq (Inferred)
2024 "Warm Springs" Discovery: First copper, gold, and Waterpump Creek-grade silver intercepts 0.8 miles from Illinois Creek
2025 Focus: Targeting additional high-grade silver discoveries at Waterpump Creek South and initiating studies on gallium recovery potential.
2. Introduction
Overview of Process Mapping
Types of Business Process Maps
Principles of Process Mapping
Framework of Process Mapping
Benefits of Process Mapping
Conclusion
About us
Index
4. Next Slide
Page 4
Businesses thrive on great ideas, but ideas
require structured processes to reach
execution.
Process mapping provides the workflow and
task alignment to transform ideas into
actionable results.
Particularly useful for brainstorming and
cross-functional collaboration, process
mapping enhances clarity and efficiency.
Introduction
INDEX
6. Next Slide
of Process Mapping
Overview
Process mapping
visually outlines
workflows using
process maps and
symbols to represent
entities and actions.
Simplifies
communication by
replacing lengthy
discussions with clear
visual
representations
Applicable across
various functions
like process
analysis,
improvement, and
training.
Page 6
INDEX
8. Flow
Charts
High Level
Diagrams
Visualize inputs,
outputs, &
workflows for
easy planning &
communication.
Detailed
Diagrams
Swimlane
Diagrams
Value
Stream
Diagrams
Break
down tasks
into
subtasks for
in-depth
analysis
Highlight
critical
steps
without
operational
details.
Clarify roles
and
responsibilities
in cross-
functional
workflows.
Break
down tasks
into
subtasks for
in-depth
analysis
Map
suppliers,
inputs,
processes,
outputs, and
customers for
a complete
overview.
SIPOC
Diagrams
TypesofBusinessProcessMaps
Page 8
INDEX
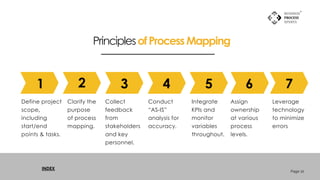
10. Define project
scope,
including
start/end
points & tasks.
Clarify the
purpose
of process
mapping.
Collect
feedback
from
stakeholders
and key
personnel.
Conduct
“AS-IS”
analysis for
accuracy.
Integrate
KPIs and
monitor
variables
throughout.
Assign
ownership
at various
process
levels.
Leverage
technology
to minimize
errors
PrinciplesofProcessMapping
1 2 3 4 5 6 7
Page 10
INDEX
12. Define project
scope,
objectives, and
best practices.
Map the "AS-IS"
process with
detailed roles
and timelines.
Analyze for
inefficiencies,
gaps, and
improvement
areas.
Refine into a
"TO-BE" process
and implement
changes.
FrameworkofProcessMapping
Page 12
INDEX
14. 1 2 3 4 5
Simplifies
complex ideas
and enhances
understanding.
Identifies
inefficiencies
for
improvement.
Improves
communication
and decision-
making.
Boosts team
proficiency
and supports
industry
certifications.
Facilitates
problem-
solving and
task
assignments.
BenefitsofProcessMapping
Page 14
INDEX
16. Process mapping transforms ideas into actionable workflows, fostering
operational efficiency.
It simplifies communication, enhances problem-solving, and ensures
alignment across teams.
For seamless implementation, consider working with BPM consultants to
optimize your processes.
Conclusion
Page 16
INDEX
17. FOR MORE DETAILS
To know more about "Process Mapping", visit:
https://businessprocessxperts.com/process-mapping-essentials-a-
roadmap-for-business-efficiency/
For India & South Asia: https://www.yourretailcoach.in/
For Dubai & Middle East: https://www.yourretailcoach.ae/
For Africa: https://www.yourretailcoach.africa/
Business Process Xperts: https://www.businessprocessxperts.com/
Page 17
INDEX