SlideShare a Scribd company logo
Producer Performance Tuning
For Apache Kafka
Jiangjie (Becket) Qin @ LinkedIn
Streams Meetup @ LinkedIn
June 15, 2015
What is Apache Kafka?
“ Kafka is a high throughput low latency ….. ”
Performance tuning is
● still very important!
● a case by case process based on
○ Different data pattern
○ Performance objectives
2
Agenda
● The goal of producer performance tuning
● Understand Kafka Producer
● Producer performance tuning
○ ProducerPerformance tool
○ Quantitative analysis using producer metrics
○ Play with a toy example
● Some real world examples
○ Latency when acks=-1
○ Produce when RTT is long
● Q & A
3
Agenda
● The goal of producer performance tuning
● Understand Kafka Producer
● Producer performance tuning
○ ProducerPerformance tool
○ Quantitative analysis using producer metrics
○ Play with a toy example
● Some real world examples
○ Latency when acks=-1
○ Produce when RTT is long
● Q & A
4
The goal of producer performance tuning
With a given dataset to send:
● Achieve the throughput and latency goals with guarantees of
○ Durability
○ Ordering
● Focus on the average producer performance
○ 99 percentile performance sometimes cannot be “tuned”
○ Tuning average performance also helps 99 percentile numbers
● Today’s talk
○ Fixed data pattern (1000 bytes of integers ranging between 0 - 50000)
5
Agenda
● The goal of producer performance tuning
● Understand the Kafka Producer
● Producer performance tuning
○ ProducerPerformance tool
○ Quantitative analysis using producer metrics
○ Play with a toy example
● Some real world examples
○ Latency when acks=-1
○ Produce when RTT is long
● Q & A
6
Understand the Kafka producer
● org.apache.kafka.producer.KafkaProducer
○ If you are still using OLD producer, please upgrade!
● Benchmarks in this talk use Kafka 0.10.0
○ No broker side recompression (KIP-31)
○ 8 bytes overhead per message due to the introduction of timestamp (KIP-32)
7
Critical Configurations
● batch.size
● linger.ms
● compression.type
● max.in.flight.requests.per.connection (affects ordering)
● acks (affects durability)
8
Understand the Kafka producer
User: producer.send(new ProducerRecord(“topic0”, “hello”), callback);
● Serialization
9
topic=“topic0”
value=“hello”
Serializer
Understand the Kafka producer
Topic
Metadata
topic=“topic0”
value=“hello”
PartitionerSerializer
● Serialization
● Partitioning
topic=“topic0”
partition =0
value=“hello”
User: producer.send(new ProducerRecord(“topic0”, “hello”), callback);
10
Understand the Kafka producer
Record Accumulator
batch0 batch1 topic0, 0● Serialization
● Partitioning
Topic
Metadata
topic=“topic0”
value=“hello”
PartitionerSerializer
topic=“topic0”
partition =0
value=“hello”
User: producer.send(new ProducerRecord(“topic0”, “hello”), callback);
11
Understand the Kafka producer
Record Accumulator
batch0 batch1 topic0, 0● Serialization
● Partitioning
freeused
compressor
callbacks
Topic
Metadata
topic=“topic0”
value=“hello”
PartitionerSerializer
topic=“topic0”
partition =0
value=“hello”
User: producer.send(new ProducerRecord(“topic0”, “hello”), callback);
12
Understand the Kafka producer
Record Accumulator
batch0 batch1 topic0, 0● Serialization
● Partitioning
● Compression
freeused
compressor
callbacks
MTopic
Metadata
topic=“topic0”
value=“hello”
PartitionerSerializer
topic=“topic0”
partition =0
value=“hello”
User: producer.send(new ProducerRecord(“topic0”, “hello”), callback);
13
Understand the Kafka producer
Record Accumulator
batch0 batch1 topic0, 0● Serialization
● Partitioning
● Compression
Tasks done by the user threads.
freeused
compressor
callbacks
M
CB
Topic
Metadata
topic=“topic0”
value=“hello”
PartitionerSerializer
topic=“topic0”
partition =0
value=“hello”
User: producer.send(new ProducerRecord(“topic0”, “hello”), callback);
14
Understand the Kafka producer
Record Accumulator
…...
batch0 batch1
batch0
batch0 batch1
topic0, 0
topic0, 1
topic1, 0batch2
freeused
compressor
callbacks
M
CB
sender thread
15
Sender:
1. polls batches from the batch queues (one batch / partition)
Sender:
1. polls batches from the batch queues (one batch / partition)
2. groups batches based on the leader broker
Understand the Kafka producer
Record Accumulator
…...
batch1
batch1
topic0, 0
topic0, 1
topicN, Mbatch2
sender thread
batch0
batch0
batch0
request 0
request 1
Broker 0
Broker 1
(one batch / partition)
freeused
compressor
callbacks
M
CB
16
Sender:
1. polls batches from the batch queues (one batch / partition)
2. groups batches based on the leader broker
3. sends the grouped batches to the brokers
4. Pipelining if max.in.flight.requests.per.connection > 1
Understand the Kafka producer
Record Accumulator
…...
batch1
batch1
topic0, 0
topic0, 1
topicN, Mbatch2
sender thread
batch0
batch0
batch0
request 0
request 1
Broker 0
Broker 1
(one batch / partition)
freeused
compressor
callbacks
M
CB
17
Sender:
1. polls batches from the batch queues (one batch / partition)
2. groups batches based on the leader broker
3. sends the grouped batches to the brokers
4. Pipelining if max.in.flight.requests.per.connection > 1
Understand the Kafka producer
Record Accumulator
…...
batch1
batch1
topic0, 0
topic0, 1
topicN, Mbatch2
sender thread
batch0
batch0
batch0
request 0
request 1
Broker 0
Broker 1
(one batch / partition)
freeused
compressor
callbacks
M
CB
18
resp
resp
sender thread
Sender:
A batch is ready when one of the following is true:
● batch.size is reached
● linger.ms is reached
● Another batch to the same broker is ready (piggyback)
● flush() or close() is called
Understand the Kafka producer
Record Accumulator
…...
batch1
batch1
topic0, 0
topic0, 1
topicN, Mbatch2
Broker 0
Broker 1
freeused
compressor
callbacks
M
CB
19
sender thread
Understand the Kafka producer
Record Accumulator
…...
topic0, 0
topic0, 1
topicN, Mbatch2
batch1 batch1
request 2
Broker 0
Broker 1
freeused
compressor
callbacks
M
CB
20
Sender:
A batch is ready when one of the following is true:
● batch.size is reached
● linger.ms is reached
● Another batch to the same broker is ready (piggyback)
● flush() or close() is called
(one batch / partition)
sender thread
Understand the Kafka producer
Record Accumulator
…...
topic0, 0
topic0, 1
topicN, Mbatch2
batch1 batch1
request 2
Broker 0
Broker 1
freeused
compressor
callbacks
M
CB
21
Sender:
A batch is ready when one of the following is true:
● batch.size is reached
● linger.ms is reached
● Another batch to the same broker is ready (piggyback)
● flush() or close() is called
(one batch / partition)
sender thread
Understand the Kafka producer
Record Accumulator
…...
topic0, 0
topic0, 1
topicN, Mbatch2
batch1 batch1
request 2
Broker 0
Broker 1
freeused
compressor
callbacks
M
CB
callbacks CB
resp
22
Sender:
On receiving the response
● The callbacks are fired in the message sending order
batch.size & linger.ms
batch.size is size based batching
linger.ms is time based batching
In general, more batching
● ⇒ Better compression ratio ⇒ Higher throughput
● ⇒ Higher latency
23
compression.type
● Compression is usually the dominant part of the producer.send()
● The speed of different compression types differs A LOT
● Compression is in user thread, so adding more user threads helps with
throughput if compression is slow
24
acks
Defines different durability level for producing.
acks Throughput Latency Durability
0 high low No guarantee
1 medium medium leader
-1 low high ISR
25
max.in.flight.requests.per.connection
max.in.flight.requests.per.connection > 1 means pipelining.
In general, pipelining
● gives better throughput
● may cause out of order delivery when retry occurs
● Excessive pipelining ⇒ Drop of throughput
○ lock contention
○ worse batching
We will be using max.in.flight.requests.per.connection=1 for today’s
talk.
26
Agenda
● The goal of producer performance tuning
● Understand KafkaProducer
● Producer performance tuning
○ ProducerPerformance tool
○ Quantitative analysis using producer metrics
○ Play with a toy example
● Some real world examples
○ Latency when acks=-1
○ Produce when RTT is long
● Q & A
27
ProducerPerformance Tool
Useful producer performance tuning tool:
● org.apache.kafka.tools.ProducerPerformance
Example:
./kafka-producer-perf-test.sh --num-records 1000000 --record-size 1000 --topic
becket_test_3_replicas_1_partition --throughput 1000000 --producer-props bootstrap.
servers=localhost:9092 max.in.flight.requests.per.connection=1 batch.size=100000
compression.type=lz4
28
ProducerPerformance Tool
Useful producer performance tuning tool:
● org.apache.kafka.tools.ProducerPerformance
With KAFKA-3554:
./kafka-producer-perf-test.sh --num-records 1000000 --record-size 1000 --topic
becket_test_3_replicas_1_partition --throughput 1000000 --num-threads 2 --value-bound 50000
--producer-props bootstrap.servers=localhost:9092 max.in.flight.requests.per.connection=1
batch.size=100000 compression.type=lz4
● --num-threads : The number of the user threads to send messages.
● --value-bound : The range of the random integer in the messages. This option is useful when compression is used.
Different integer range simulates different compression ratio.
29
Quantitative analysis using producer metrics
The improved ProducerPerformance tool (KAFKA-3554) prints the following
producer metrics.
● Select_Rate_Avg (The rate that the sender thread runs to check if it can send some messages)
● Request_Rate_Avg
● Request_Latency_Avg (Not including the callback execution time)
● Request_Size_Avg (After compression)
● Batch_Size_Avg (After compression)
● Records_Per_Request_Avg
● Record_Queue_Time_Avg
● Compression_Rate_Avg
Note: The metrics need some time (~ 1 min) to become stable.
30
Quantitative analysis using producer metrics
./kafka-producer-perf-test.sh --num-records 1000000 --record-size 1000 --topic
becket_test_3_replicas_4_partition --throughput 100000 --num-threads 1 --value-bound 50000
--producer-props bootstrap.servers=localhost:9092 compression.type=gzip max.in.flight.
requests.per.connection=1
1000000 records sent, 10444.300545 records/sec (9.96 MB/sec), 4.19 ms avg latency, 154.00 ms max latency, 4 ms 50th,
6 ms 95th, 6 ms 99th, 22 ms 99.9th.
Select_Rate_Avg: 3114.67
Request_Rate_Avg: 1448.53
Request_Latency_Avg: 2.73
Request_Size_Avg: 5034.47
Batch_Size_Avg: 4941.93
Records_Per_Request_Avg: 7.05
Record_Queue_Time_Avg: 2.45
Compression_Rate_Avg: 0.68
31
Quantitative analysis using producer metrics
1. throughput_Avg ~= Request_Rate_Avg * Request_Size_Avg / Compression_Rate_Avg
./kafka-producer-perf-test.sh --num-records 1000000 --record-size 1000 --topic becket_test_3_replicas_4_partition --
throughput 100000 --num-threads 1 --value-bound 50000 --producer-props bootstrap.servers=localhost:9092 compression.
type=gzip max.in.flight.requests.per.connection=1
1000000 records sent, 10444.300545 records/sec (9.96 MB/sec), 4.19 ms avg latency, 154.00 ms max latency, 4 ms 50th,
6 ms 95th, 6 ms 99th, 22 ms 99.9th.
Select_Rate_Avg: 3114.67
Request_Rate_Avg: 1448.53
Request_Latency_Avg: 2.73
Request_Size_Avg: 5034.47
Batch_Size_Avg: 4941.93
Records_Per_Request_Avg: 7.05
Record_Queue_Time_Avg: 2.45
Compression_Rate_Avg: 0.68
1448.53 * 5034.47 / 0.68 = 10.22 MB/sec
(The gap is due to the request_overhead)
32
Quantitative analysis using producer metrics
2. Request_Size_Avg = Records_Per_Request_Avg * Record_Size * Compression_Rate_Avg +
Request_Overhead
./kafka-producer-perf-test.sh --num-records 1000000 --record-size 1000 --topic becket_test_3_replicas_4_partition --
throughput 100000 --num-threads 1 --value-bound 50000 --producer-props bootstrap.servers=localhost:9092 compression.
type=gzip max.in.flight.requests.per.connection=1
1000000 records sent, 10444.300545 records/sec (9.96 MB/sec), 4.19 ms avg latency, 154.00 ms max latency, 4 ms 50th,
6 ms 95th, 6 ms 99th, 22 ms 99.9th.
Select_Rate_Avg: 3114.67
Request_Rate_Avg: 1448.53
Request_Latency_Avg: 2.73
Request_Size_Avg: 5034.47
Batch_Size_Avg: 4941.93
Records_Per_Request_Avg: 7.05
Record_Queue_Time_Avg: 2.45
Compression_Rate_Avg: 0.68
7.05 * 1000 * 0.68 + Request_Overhead = 4794 + Request_Overhead
The Request_Overhead:
● depends on the number of topics and partitions
● usually ranges from dozens bytes to hundreds of bytes.
33
Quantitative analysis using producer metrics
3. Request_Rate_Upper_Limit = (1000 / Request_Latency_Avg) * Num_Brokers
./kafka-producer-perf-test.sh --num-records 1000000 --record-size 1000 --topic becket_test_3_replicas_4_partition --
throughput 100000 --num-threads 1 --value-bound 50000 --producer-props bootstrap.servers=localhost:9092 compression.
type=gzip max.in.flight.requests.per.connection=1
1000000 records sent, 10444.300545 records/sec (9.96 MB/sec), 4.19 ms avg latency, 154.00 ms max latency, 4 ms 50th,
6 ms 95th, 6 ms 99th, 22 ms 99.9th.
Select_Rate_Avg: 3114.67
Request_Rate_Avg: 1448.53
Request_Latency_Avg: 2.73
Request_Size_Avg: 5034.47
Batch_Size_Avg: 4941.93
Records_Per_Request_Avg: 7.05
Record_Queue_Time_Avg: 2.45
Compression_Rate_Avg: 0.68
(1000 / 2.73) * 5 = 1813
The gap is:
● due to the producer overhead,
● larger if request rate is higher
34
Quantitative analysis using producer metrics
4. latency_avg ~= (Record_Queue_Time_Avg / 2) + Request_Latency_Avg + Callback_Latency
./kafka-producer-perf-test.sh --num-records 1000000 --record-size 1000 --topic becket_test_3_replicas_4_partition --
throughput 100000 --num-threads 1 --value-bound 50000 --producer-props bootstrap.servers=localhost:9092 compression.
type=gzip max.in.flight.requests.per.connection=1
1000000 records sent, 10444.300545 records/sec (9.96 MB/sec), 4.19 ms avg latency, 154.00 ms max latency, 4 ms 50th,
6 ms 95th, 6 ms 99th, 22 ms 99.9th.
Select_Rate_Avg: 3114.67
Request_Rate_Avg: 1448.53
Request_Latency_Avg: 2.73
Request_Size_Avg: 5034.47
Batch_Size_Avg: 4941.93
Records_Per_Request_Avg: 7.05
Record_Queue_Time_Avg: 2.45
Compression_Rate_Avg: 0.68
2.45 / 2 + 2.73 + Callback_Latency = 3.96 + Callback_Latency
(The callback latency and some other time cost in the
ProducerPerformance tool is usually small enough to ignore)
35
Play with a toy example
./kafka-producer-perf-test.sh --num-records 1000000 --record-size 1000 --topic becket_test_3_replicas_4_partition --
throughput 100000 --num-threads 1 --value-bound 50000 --producer-props bootstrap.servers=localhost:9092 compression.
type=gzip max.in.flight.requests.per.connection=1
1000000 records sent, 10444.300545 records/sec (9.96 MB/sec), 4.19 ms avg latency, 154.00 ms max latency, 4 ms 50th,
6 ms 95th, 6 ms 99th, 22 ms 99.9th.
Select_Rate_Avg: 3114.67
Request_Rate_Avg: 1448.53
Request_Latency_Avg: 2.73
Request_Size_Avg: 5034.47
Batch_Size_Avg: 4941.93
Records_Per_Request_Avg: 7.05
Record_Queue_Time_Avg: 2.45
Compression_Rate_Avg: 0.68
● RTT=1.55 ms
● 5 broker cluster
36
Play with a toy example
./kafka-producer-perf-test.sh --num-records 1000000 --record-size 1000 --topic becket_test_3_replicas_4_partition --
throughput 100000 --num-threads 1 --value-bound 50000 --producer-props bootstrap.servers=localhost:9092 compression.
type=gzip max.in.flight.requests.per.connection=1
1000000 records sent, 10444.300545 records/sec (9.96 MB/sec), 4.19 ms avg latency, 154.00 ms max latency, 4 ms 50th,
6 ms 95th, 6 ms 99th, 22 ms 99.9th.
Select_Rate_Avg: 3114.67
Request_Rate_Avg: 1448.53
Request_Latency_Avg: 2.73
Request_Size_Avg: 5034.47
Batch_Size_Avg: 4941.93
Records_Per_Request_Avg: 7.05
Record_Queue_Time_Avg: 2.45
Compression_Rate_Avg: 0.68
● Network Bandwidth = 1 Gbps:
○ Throughput can be improved
37
Play with a toy example
./kafka-producer-perf-test.sh --num-records 1000000 --record-size 1000 --topic becket_test_3_replicas_4_partition --
throughput 100000 --num-threads 1 --value-bound 50000 --producer-props bootstrap.servers=localhost:9092 compression.
type=gzip max.in.flight.requests.per.connection=1
1000000 records sent, 10444.300545 records/sec (9.96 MB/sec), 4.19 ms avg latency, 154.00 ms max latency, 4 ms 50th,
6 ms 95th, 6 ms 99th, 22 ms 99.9th.
Select_Rate_Avg: 3114.67
Request_Rate_Avg: 1448.53
Request_Latency_Avg: 2.73
Request_Size_Avg: 5034.47
Batch_Size_Avg: 4941.93
Records_Per_Request_Avg: 7.05
Record_Queue_Time_Avg: 2.45
Compression_Rate_Avg: 0.68
throughput_Avg ~= Request_Rate_Avg * Request_Size_Avg / Compression_Rate_Avg
● RTT = 1.55 ms:
○ Request Latency is not bad.
● 1448 Request rate is not bad
○ 5 brokers * (1000 / 2.73) = 1813 (theoretical upper limit)
● Each request is too small
○ Default batch size = 16KB
38
Play with a toy example
./kafka-producer-perf-test.sh --num-records 1000000 --record-size 1000 --topic becket_test_3_replicas_4_partition --
throughput 100000 --num-threads 1 --value-bound 50000 --producer-props bootstrap.servers=localhost:9092 compression.
type=gzip max.in.flight.requests.per.connection=1
1000000 records sent, 10444.300545 records/sec (9.96 MB/sec), 4.19 ms avg latency, 154.00 ms max latency, 4 ms 50th,
6 ms 95th, 6 ms 99th, 22 ms 99.9th.
Select_Rate_Avg: 3114.67
Request_Rate_Avg: 1448.53
Request_Latency_Avg: 2.73
Request_Size_Avg: 5034.47
Batch_Size_Avg: 4941.93
Records_Per_Request_Avg: 7.05
Record_Queue_Time_Avg: 2.45
Compression_Rate_Avg: 0.68
throughput_Avg ~= Request_Rate_Avg * Request_Size_Avg / Compression_Rate_Avg
Ways to increase request size:
1. Add more user threads
2. Increase number of partitions
3. Increase linger.ms (more batching)
39
Play with a toy example
./kafka-producer-perf-test.sh --num-records 1000000 --record-size 1000 --topic becket_test_3_replicas_4_partition --
throughput 100000 --num-threads 1 --value-bound 50000 --producer-props bootstrap.servers=localhost:9092 compression.
type=gzip max.in.flight.requests.per.connection=1
1000000 records sent, 10444.300545 records/sec (9.96 MB/sec), 4.19 ms avg latency, 154.00 ms max latency, 4 ms 50th,
6 ms 95th, 6 ms 99th, 22 ms 99.9th.
Select_Rate_Avg: 3114.67
Request_Rate_Avg: 1448.53
Request_Latency_Avg: 2.73
Request_Size_Avg: 5034.47
Batch_Size_Avg: 4941.93
Records_Per_Request_Avg: 7.05
Record_Queue_Time_Avg: 2.45
Compression_Rate_Avg: 0.68
throughput_Avg ~= Request_Rate_Avg * Request_Size_Avg / Compression_Rate_Avg
Ways to increase request size:
1. Add more user threads
2. Increase number of partitions
3. Increase linger.ms (more batching)?
40
More Batching
41
More batching does not help!?
More Batching
42
More batching does not help!?
Compression Ratio is not improved much!
More Batching
43
More batching does not help!?
Compression Ratio is not improved much!
But why throughput becomes worse!?
Impact of Batch Size on GZIP Compression
44
When batch size is doubled from 16K to 32K, the time needed to fill in the batch is
almost tripled!
(The results are from JMH Micro Benchmark)
batch size (KB)
Time to fill up the
batch (ns)
16 1768583.939
32 5234432.44
64 13307411.93
128 29539258.9
192 45549678.03
256 61579312.57
Impact of Batch Size on GZIP Compression
45
Batch_Size_Avg: Record_Queue_Time_Avg:
15075.84 3.86
30681.25 9.37
61687.88 21.12
124451.51 47.2
248860.43 92.14
498640.58 184.84
When batch size is doubled from 16K to 32K, the time needed to fill in the batch is
2.5x!
(The results are from ProducerPerformance tool with 1 user thread, 1 partition,
linger.ms=20000)
Impact of Batch Size on GZIP Compression
46
Different value bounds show similar results.
Impact of Batch Size on Compression
47
Snappy and LZ4 has similar impact at different batch size.
When to increase batching
● Compression Ratio Gain > Compression Speed Loss
● Bottleneck is not in the user threads
48
Play with a toy example
OK… Let’s increase number of user threads then.
49
When there are 10 user threads:
● Throughput drops
● Latency soars
Play with a toy example
OK… Let’s increase number of user threads then.
50
● Lock contention (10 user threads V.S. 4 partitions)
● batches are piling up!
When there are 10 user threads:
● Throughput drops
● Latency soars
Records Queue Time = 3323.85 ms
Play with a toy example
When topic has 16 partitions
51
Batches are still piling up, but it
seems much better than before.
Records Queue Time = 252.69 ms
Play with a toy example
Let’s try tweak the batch size.
--num-threads 10, batch.size=16K, 16 partitions
2000000 records sent, 39791.492579 records/sec (37.95 MB/sec), 152.77 ms avg latency, 1182.00 ms max latency, 14 ms
50th, 841 ms 95th, 1128 ms 99th, 1162 ms 99.9th.
(Requests are piling up, so the bottleneck is the sender thread)
--num-threads 10, batch.size=800K, 16 partitions
2000000 records sent, 35647.446752 records/sec (34.00 MB/sec), 20.31 ms avg latency, 502.00 ms max latency, 17 ms
50th, 37 ms 95th, 68 ms 99th, 325 ms 99.9th.
(Requests are no longer piling up, the bottleneck shifted to user threads)
Usually bigger batch leads to bigger latency.
But increasing batch size can improve latency by preventing the batches from piling up!
52
Play with a toy example
To improve both latency & throughput? Increase number of partitions again.
--num-threads 10, batch.size=16K
2000000 records sent, 39791.492579 records/sec (37.95 MB/sec), 152.77 ms avg latency, 1182.00 ms max latency, 14 ms
50th, 841 ms 95th, 1128 ms 99th, 1162 ms 99.9th.
--num-threads 10, batch.size=800K
2000000 records sent, 35647.446752 records/sec (34.00 MB/sec), 20.31 ms avg latency, 502.00 ms max latency, 17 ms
50th, 37 ms 95th, 68 ms 99th, 325 ms 99.9th.
--num-threads 10, batch.size=16K, 32 partitions.
2000000 records sent, 43432.939541 records/sec (41.42 MB/sec), 47.29 ms avg latency, 291.00 ms max latency, 22 ms
50th, 225 ms 95th, 246 ms 99th, 270 ms 99.9th.
53
Find the throughput bottleneck
Is the bottleneck in user thread?
● Increase --num-threads and see if throughput increases accordingly
● Pay attention to lock contention
Is the bottleneck in sender thread?
● Is throughput (MB/sec) << network bandwidth
● Is Record_Queue_Time_Avg large?
● Is Batch_Size_Avg almost equals to batch.size?
Is the bottleneck in broker?
● Is the request latency very large?
54
Agenda
● The goal of producer performance tuning
● Understand KafkaProducer
● Producer performance tuning
○ ProducerPerformance tool
○ Quantitative analysis using producer metrics
○ Play with a toy example
● Some real world examples
○ Latency when acks=-1
○ Produce when RTT is long
● Q & A
55
Latency when acks=-1
Broker 0 Broker 1
Partition 0
Partition 1
Partition 2
p0 p1 p2
ProduceRequest
Partition 0
Partition 1
Partition 2
1
2
Producer 3
4
ProduceResponse
5
1. [Network] ProduceRequest Send Time
2. [Broker] ProduceRequest Queue Time
3. [Broker] ProduceRequest Local Time
4. [Broker] ProduceRequest Remote Time
5. [Broker] ProduceResponse Queue Time
6. [Broker] ProduceResponse Send Time
6
56
Latency when acks=-1
Broker 0 Broker 1
Partition 0
Partition 1
Partition 2
p0 p1 p2
ProduceRequest
Partition 0
Partition 1
Partition 2
1
2
Producer 3
4
ProduceResponse
5
1. [Network] ProduceRequest Send Time
2. [Broker] ProduceRequest Queue Time
3. [Broker] ProduceRequest Local Time
4. [Broker] ProduceRequest Remote Time (Replication Time)
5. [Broker] ProduceResponse Queue Time
6. [Broker] ProduceResponse Send Time
6
57
Latency when acks=-1
Broker 0 Broker 1
Partition 0
Partition 1
Partition 2
p0 p1 p2
ProduceRequest
p0
high watermark fetch (p0,100; p1,200; p2,50)
100 105
● The followers fetches data of the partitions from the leader.
● The leader uses high watermarks to the In Sync Replicas
(ISR) of the all partitions
58
200
50
200
50
Partition 0
Partition 1
Partition 2
100
Latency when acks=-1
Broker 0 Broker 1
Partition 0
Partition 1
Partition 2
p0 p1 p2
ProduceRequest
Partition 0
Partition 1
Partition 2
p0
high watermark
100 105
p0
The high watermarks are not updated after the data is sent.
100
fetch (p0,100; p1,200; p2,50)
59
200
50
200
50
Latency when acks=-1
Broker 0 Broker 1
Partition 0
Partition 1
Partition 2
p0 p1 p2
ProduceRequest
Partition 0
Partition 1
Partition 2
p0
high watermark
100 105
p0
p0
The high watermarks are not updated after the data is sent.
100 105
fetch (p0,100; p1,200; p2,50)
60
200
50
200
50
Latency when acks=-1
Broker 0 Broker 1
Partition 0
Partition 1
Partition 2
p0 p1 p2
ProduceRequest
Partition 0
Partition 1
Partition 2
p0
high watermark
100 105
p0
p0
The high watermarks are not updated after the data is sent.
100 105
fetch (p0,100; p1,200; p2,50)
61
200
50
200
50
p1
p2
203
60
fetch (p0,105; p1,200; p2,50)
Latency when acks=-1
Broker 0
Partition 0
Partition 1
Partition 2
p0 p1 p2
ProduceRequest
p0
100 105
p0
Broker 1
Partition 0
Partition 1
Partition 2
p0
The high watermark increases lazily. There is one fetch delay.
100 105
fetch (p0,100; p1,200; p2,50)
200
50
200
50
62
p1
p2
203
60
high watermark
fetch (p0,105; p1,200; p2,50)
Latency when acks=-1
Broker 0
Partition 0
Partition 1
Partition 2
p0 p1 p2
ProduceRequest
p0
100 105
p0
Broker 1
Partition 0
Partition 1
Partition 2
p0
The high watermark increases lazily. There is one fetch delay.
100 105
fetch (p0,100; p1,200; p2,50)
200
50
200
50
63
p1
p2
203
60
high watermark
fetch (p0,105; p1,200; p2,50)
Latency when acks=-1
Broker 0
Partition 0
Partition 1
Partition 2
p0 p1 p2
ProduceRequest
p0
100 105
p0
Broker 1
Partition 0
Partition 1
Partition 2
p0
ProduceResponse
p1 p1
p2 p2
The replication is not ProduceRequest aware.
● The messages produced in the same ProduceRequest may
be replicated in multiple fetches.
● ProduceRequests interfere with each other.
100 105
p1 p2
fetch (p0,100; p1,200; p2,50)
200 203
50 60
200 203
50 60
64
high watermark
fetch (p0,105; p1,200; p2,50)
Latency when acks=-1
Broker 0
Partition 0
Partition 1
Partition 2
p0 p1 p2
ProduceRequest
p0
100 105
p0
Broker 1
Partition 0
Partition 1
Partition 2
p0
ProduceResponse
p1 p1
p2 p2
Only when the high watermarks of all the partitions has passed the
offset of the appended messages in the ProduceRequest, the
ProduceResponse will be sent.
100 105
p1 p2
fetch (p0,100; p1,200; p2,50)
fetch (p0,105; p1,203; p2,60)
200 203
50 60
200 203
50 60
65
high watermark
fetch (p0,105; p1,200; p2,50)
Latency when acks=-1
Broker 0
Partition 0
Partition 1
Partition 2
p0 p1 p2
ProduceRequest
p0
100 105
p0
Broker 1
Partition 0
Partition 1
Partition 2
p0
ProduceResponse
p1 p1
p2 p2
Only when the high watermarks of all the partitions has passed the
offset of the appended messages in the ProduceRequest, the
ProduceResponse will be sent.
100 105
p1 p2
fetch (p0,100; p1,200; p2,50)
fetch (p0,105; p1,203; p2,60)
200 203
50 60
200 203
50 60
66
high watermark
fetch (p0,105; p1,200; p2,50)
Latency when acks=-1
Broker 0
Partition 0
Partition 1
Partition 2
p0 p1 p2
ProduceRequest
p0
100 105
p0
Broker 1
Partition 0
Partition 1
Partition 2
p0
ProduceResponse
p1 p1
p2 p2
Assuming broker 1 only has one replication thread,
Replication Time ~= Num_Fetches * (Local_Time_On_The_Follower +
Fetch_Request_Total_Time_On_The_Leader)
100 105
p1 p2
fetch (p0,100; p1,200; p2,50)
fetch (p0,105; p1,203; p2,60)
200 203
50 60
200 203
50 60
67
high watermark
Latency when acks=-1
Replication Time ~= Num_Fetches * (Local_Time_On_The_Follower +
Fetch_Request_Total_Time_On_The_Leader)
/ num.replica.fetchers
● Increase num.replica.fetchers
○ Parallel fetch
○ Each replica fetcher fetches from a distinct set of partitions.
● Not perfect solution
○ Diminishing effect
○ Scalability concern
■ Replica fetchers per broker = (Cluster_Size - 1 ) * num.replica.fetchers
68
Latency when acks=-1
How many replica fetchers are enough?
● The latency target is met
● If Replica FetchRequest Remote Time > 0
○ The replica fetch requests are waiting for the messages to arrive.
○ Increasing num.replica.fetchers won’t improve latency.
● Partitions per replica fetcher is low
69
Agenda
● The goal of producer performance tuning
● Understand KafkaProducer
● Producer performance tuning
○ ProducerPerformance tool
○ Quantitative analysis using producer metrics
○ Play with a toy example
● Some real world examples
○ Latency when acks=-1
○ Produce when RTT is long
● Q & A
70
Produce when RTT is long
We have a cross-ocean pipeline using remote produce
● RTT is big (~200 ms)
● Bandwidth = 1 Gb/s
● Batch size 800K
● Linger.ms 30ms
● 64 Partitions
● 8 user threads
71
Produce when RTT is long
We have a cross-ocean pipeline using remote produce
● RTT is big (~200 ms)
● Bandwidth = 1 Gb/s
● Batch size 800K
● Linger.ms 30ms
● 64 Partitions
● 8 user threads
● Throughput < 1 MB/s
72
Produce when RTT is long
The TCP connection needs more send and receive buffer.
Broker default: socket.receive.buffer.bytes = 100K
Producer default: send.buffer.bytes = 128K
Theoretical throughput with default setting = 100K / RTT = 500KB
Theoretical best buffer size = RTT * Bandwidth = 0.2s * 1 Gb/s = 25 MB
73
Produce when RTT is long
Changing socket buffer size may require OS TCP buffer limit.
74
Produce when RTT is long
Changing socket buffer size may require OS TCP buffer limit.
# The default setting of the socket receive buffer in bytes.
net.core.rmem_default = 124928
# The maximum receive socket buffer size in bytes.
net.core.rmem_max = 2048000
# The default setting (in bytes) of the socket send buffer.
net.core.wmem_default = 124928
# The maximum send socket buffer size in bytes.
net.core.wmem_max = 2048000
75
Q&A
76
Backup slides are following.
Producer Metrics With 4 Partitions
77
1 thread 2 threads 4 threads 10 threads
Select_Rate_Avg: 3114.67 682.55 1359.05 2641.75
Request_Rate_Avg: 1448.53 1282.76 840.36 634.22
Request_Latency_Avg: 2.73 3.11 4.62 6.09
Request_Size_Avg: 5034.47 8703.1 13192.99 14931.51
Batch_Size_Avg: 4941.93 8607.87 13098.74 14837.54
Records_Per_Request_Avg: 7.05 12.46 19.08 21.63
Record_Queue_Time_Avg: 2.45 2.79 5.17 3323.85
Compression_Rate_Avg: 0.68 0.67 0.66 0.66
Producer Metrics With 16 Partitions
78
1 Thread 2 Threads 4 Threads 10 Threads
Select_Rate_Avg: 2746.74 1948.27 1241.82 2199.14
Request_Rate_Avg: 1270.49 1093.21 812.54 568.09
Request_Latency_Avg: 3.91 4.53 6.07 8.16
Request_Size_Avg: 8758.02 15447.04 27688.3 45652.14
Batch_Size_Avg: 2706.87 4808.15 8638.38 14283.30
Records_Per_Request_Avg: 12.01 21.82 39.86 66.33
Record_Queue_Time_Avg: 3.13 3.86 6.42 252.69
Compression_Rate_Avg: 0.68 0.67 0.66 0.66
Lock contention for sender thread
Threads 2 4 8 10
linger.ms 50 30 20 15
Record_Queue_Time_Avg 50 31.08 21.21 17.27
Difference 0 1.08 1.21 2.27
This table shows some evidence of lock contention in the Kafka producer.
For a topic with 16 partitions, we do the following:
● Set linger.ms to make them almost the generating the similar size of batch.
● Compare the difference between linger.ms and Record_Queue_Time_Avg
● The bigger the difference is, the worse the lock contention is between the
sender thread and the user threads.
79

More Related Content

What's hot (20)

PDF
Apache Kafka Introduction
Amita Mirajkar
 
PDF
A Deep Dive into Kafka Controller
confluent
 
PDF
An Introduction to Apache Kafka
Amir Sedighi
 
PPTX
Improving Kafka at-least-once performance at Uber
Ying Zheng
 
PPTX
A visual introduction to Apache Kafka
Paul Brebner
 
PPTX
Introduction to Apache Kafka
Jeff Holoman
 
PDF
Troubleshooting Kafka's socket server: from incident to resolution
Joel Koshy
 
PPTX
Apache kafka
Viswanath J
 
PPTX
Deep Dive into Apache Kafka
confluent
 
PDF
Apache kafka
NexThoughts Technologies
 
PPTX
Kafka presentation
Mohammed Fazuluddin
 
PPTX
Apache Kafka 0.8 basic training - Verisign
Michael Noll
 
PDF
Fundamentals of Apache Kafka
Chhavi Parasher
 
PPTX
Evening out the uneven: dealing with skew in Flink
Flink Forward
 
PPTX
Kafka 101
Aparna Pillai
 
PPTX
Introduction to Apache Kafka
AIMDek Technologies
 
PDF
Kafka 101 and Developer Best Practices
confluent
 
PPTX
Apache Kafka
Saroj Panyasrivanit
 
PPTX
Introduction to Kafka Cruise Control
Jiangjie Qin
 
PDF
Apache kafka 모니터링을 위한 Metrics 이해 및 최적화 방안
SANG WON PARK
 
Apache Kafka Introduction
Amita Mirajkar
 
A Deep Dive into Kafka Controller
confluent
 
An Introduction to Apache Kafka
Amir Sedighi
 
Improving Kafka at-least-once performance at Uber
Ying Zheng
 
A visual introduction to Apache Kafka
Paul Brebner
 
Introduction to Apache Kafka
Jeff Holoman
 
Troubleshooting Kafka's socket server: from incident to resolution
Joel Koshy
 
Apache kafka
Viswanath J
 
Deep Dive into Apache Kafka
confluent
 
Kafka presentation
Mohammed Fazuluddin
 
Apache Kafka 0.8 basic training - Verisign
Michael Noll
 
Fundamentals of Apache Kafka
Chhavi Parasher
 
Evening out the uneven: dealing with skew in Flink
Flink Forward
 
Kafka 101
Aparna Pillai
 
Introduction to Apache Kafka
AIMDek Technologies
 
Kafka 101 and Developer Best Practices
confluent
 
Apache Kafka
Saroj Panyasrivanit
 
Introduction to Kafka Cruise Control
Jiangjie Qin
 
Apache kafka 모니터링을 위한 Metrics 이해 및 최적화 방안
SANG WON PARK
 

Viewers also liked (8)

PDF
HBaseCon2017 Improving HBase availability in a multi tenant environment
HBaseCon
 
PPTX
HBaseCon 2015: Analyzing HBase Data with Apache Hive
HBaseCon
 
PDF
[WSO2Con EU 2017] Keynote: Mobile Identity in the Digital Economy
WSO2
 
PDF
Leveraging federation capabilities of Identity Server for API gateway
WSO2
 
PDF
Identity Federation Patterns with WSO2 Identity Server​
WSO2
 
PPTX
The Impala Cookbook
Cloudera, Inc.
 
PDF
[WSO2Con EU 2017] The Win-Win-Win of Water Authority HHNK
WSO2
 
PDF
Java Clientで入門する Apache Kafka #jjug_ccc #ccc_e2
Yahoo!デベロッパーネットワーク
 
HBaseCon2017 Improving HBase availability in a multi tenant environment
HBaseCon
 
HBaseCon 2015: Analyzing HBase Data with Apache Hive
HBaseCon
 
[WSO2Con EU 2017] Keynote: Mobile Identity in the Digital Economy
WSO2
 
Leveraging federation capabilities of Identity Server for API gateway
WSO2
 
Identity Federation Patterns with WSO2 Identity Server​
WSO2
 
The Impala Cookbook
Cloudera, Inc.
 
[WSO2Con EU 2017] The Win-Win-Win of Water Authority HHNK
WSO2
 
Java Clientで入門する Apache Kafka #jjug_ccc #ccc_e2
Yahoo!デベロッパーネットワーク
 
Ad

Similar to Producer Performance Tuning for Apache Kafka (20)

PDF
SFBigAnalytics_20190724: Monitor kafka like a Pro
Chester Chen
 
PDF
TDEA 2018 Kafka EOS (Exactly-once)
Erhwen Kuo
 
PDF
Exactly-Once Made Easy: Transactional Messaging Improvement for Usability and...
HostedbyConfluent
 
PDF
Exactly-Once Made Easy: Transactional Messaging Improvement for Usability and...
Guozhang Wang
 
PDF
Uber Real Time Data Analytics
Ankur Bansal
 
PDF
Introduction to Apache Kafka
Shiao-An Yuan
 
PDF
Streaming millions of Contact Center interactions in (near) real-time with Pu...
Frank Kelly
 
PDF
Streaming Millions of Contact Center Interactions in (Near) Real-Time with Pu...
StreamNative
 
PDF
Kafka to the Maxka - (Kafka Performance Tuning)
DataWorks Summit
 
PPTX
Citi TechTalk Session 2: Kafka Deep Dive
confluent
 
PDF
Introduction to apache kafka
Samuel Kerrien
 
PDF
Introducing KRaft: Kafka Without Zookeeper With Colin McCabe | Current 2022
HostedbyConfluent
 
PPTX
Kubernetes @ Squarespace: Kubernetes in the Datacenter
Kevin Lynch
 
PDF
Apache Kafka Women Who Code Meetup
Snehal Nagmote
 
PDF
Cost Dimensions of Kafka - Opti Owl Cloud
SrinivasDevaki
 
PDF
Netflix Keystone Pipeline at Big Data Bootcamp, Santa Clara, Nov 2015
Monal Daxini
 
PPTX
Instaclustr Kafka Meetup Sydney Presentation
Ben Slater
 
PDF
Nexmark with beam
Etienne Chauchot
 
PDF
Tips & Tricks for Apache Kafka®
confluent
 
PDF
Free GitOps Workshop + Intro to Kubernetes & GitOps
Weaveworks
 
SFBigAnalytics_20190724: Monitor kafka like a Pro
Chester Chen
 
TDEA 2018 Kafka EOS (Exactly-once)
Erhwen Kuo
 
Exactly-Once Made Easy: Transactional Messaging Improvement for Usability and...
HostedbyConfluent
 
Exactly-Once Made Easy: Transactional Messaging Improvement for Usability and...
Guozhang Wang
 
Uber Real Time Data Analytics
Ankur Bansal
 
Introduction to Apache Kafka
Shiao-An Yuan
 
Streaming millions of Contact Center interactions in (near) real-time with Pu...
Frank Kelly
 
Streaming Millions of Contact Center Interactions in (Near) Real-Time with Pu...
StreamNative
 
Kafka to the Maxka - (Kafka Performance Tuning)
DataWorks Summit
 
Citi TechTalk Session 2: Kafka Deep Dive
confluent
 
Introduction to apache kafka
Samuel Kerrien
 
Introducing KRaft: Kafka Without Zookeeper With Colin McCabe | Current 2022
HostedbyConfluent
 
Kubernetes @ Squarespace: Kubernetes in the Datacenter
Kevin Lynch
 
Apache Kafka Women Who Code Meetup
Snehal Nagmote
 
Cost Dimensions of Kafka - Opti Owl Cloud
SrinivasDevaki
 
Netflix Keystone Pipeline at Big Data Bootcamp, Santa Clara, Nov 2015
Monal Daxini
 
Instaclustr Kafka Meetup Sydney Presentation
Ben Slater
 
Nexmark with beam
Etienne Chauchot
 
Tips & Tricks for Apache Kafka®
confluent
 
Free GitOps Workshop + Intro to Kubernetes & GitOps
Weaveworks
 
Ad

Recently uploaded (20)

PPTX
UI5Con 2025 - Get to Know Your UI5 Tooling
Wouter Lemaire
 
PDF
Meetup Kickoff & Welcome - Rohit Yadav, CSIUG Chairman
ShapeBlue
 
PDF
Productivity Management Software | Workstatus
Lovely Baghel
 
PDF
Arcee AI - building and working with small language models (06/25)
Julien SIMON
 
PDF
Building Resilience with Digital Twins : Lessons from Korea
SANGHEE SHIN
 
PPTX
Simplifying End-to-End Apache CloudStack Deployment with a Web-Based Automati...
ShapeBlue
 
PDF
How Current Advanced Cyber Threats Transform Business Operation
Eryk Budi Pratama
 
PPTX
Machine Learning Benefits Across Industries
SynapseIndia
 
PDF
Human-centred design in online workplace learning and relationship to engagem...
Tracy Tang
 
PDF
Generative AI in Healthcare: Benefits, Use Cases & Challenges
Lily Clark
 
PDF
CloudStack GPU Integration - Rohit Yadav
ShapeBlue
 
PDF
Upskill to Agentic Automation 2025 - Kickoff Meeting
DianaGray10
 
PDF
2025-07-15 EMEA Volledig Inzicht Dutch Webinar
ThousandEyes
 
PPTX
Darren Mills The Migration Modernization Balancing Act: Navigating Risks and...
AWS Chicago
 
PDF
Ampere Offers Energy-Efficient Future For AI And Cloud
ShapeBlue
 
PDF
Market Insight : ETH Dominance Returns
CIFDAQ
 
PDF
Apache CloudStack 201: Let's Design & Build an IaaS Cloud
ShapeBlue
 
PDF
GITLAB-CICD_For_Professionals_KodeKloud.pdf
deepaktyagi0048
 
PDF
CIFDAQ'S Token Spotlight for 16th July 2025 - ALGORAND
CIFDAQ
 
PDF
visibel.ai Company Profile – Real-Time AI Solution for CCTV
visibelaiproject
 
UI5Con 2025 - Get to Know Your UI5 Tooling
Wouter Lemaire
 
Meetup Kickoff & Welcome - Rohit Yadav, CSIUG Chairman
ShapeBlue
 
Productivity Management Software | Workstatus
Lovely Baghel
 
Arcee AI - building and working with small language models (06/25)
Julien SIMON
 
Building Resilience with Digital Twins : Lessons from Korea
SANGHEE SHIN
 
Simplifying End-to-End Apache CloudStack Deployment with a Web-Based Automati...
ShapeBlue
 
How Current Advanced Cyber Threats Transform Business Operation
Eryk Budi Pratama
 
Machine Learning Benefits Across Industries
SynapseIndia
 
Human-centred design in online workplace learning and relationship to engagem...
Tracy Tang
 
Generative AI in Healthcare: Benefits, Use Cases & Challenges
Lily Clark
 
CloudStack GPU Integration - Rohit Yadav
ShapeBlue
 
Upskill to Agentic Automation 2025 - Kickoff Meeting
DianaGray10
 
2025-07-15 EMEA Volledig Inzicht Dutch Webinar
ThousandEyes
 
Darren Mills The Migration Modernization Balancing Act: Navigating Risks and...
AWS Chicago
 
Ampere Offers Energy-Efficient Future For AI And Cloud
ShapeBlue
 
Market Insight : ETH Dominance Returns
CIFDAQ
 
Apache CloudStack 201: Let's Design & Build an IaaS Cloud
ShapeBlue
 
GITLAB-CICD_For_Professionals_KodeKloud.pdf
deepaktyagi0048
 
CIFDAQ'S Token Spotlight for 16th July 2025 - ALGORAND
CIFDAQ
 
visibel.ai Company Profile – Real-Time AI Solution for CCTV
visibelaiproject
 

Producer Performance Tuning for Apache Kafka

  • 1. Producer Performance Tuning For Apache Kafka Jiangjie (Becket) Qin @ LinkedIn Streams Meetup @ LinkedIn June 15, 2015
  • 2. What is Apache Kafka? “ Kafka is a high throughput low latency ….. ” Performance tuning is ● still very important! ● a case by case process based on ○ Different data pattern ○ Performance objectives 2
  • 3. Agenda ● The goal of producer performance tuning ● Understand Kafka Producer ● Producer performance tuning ○ ProducerPerformance tool ○ Quantitative analysis using producer metrics ○ Play with a toy example ● Some real world examples ○ Latency when acks=-1 ○ Produce when RTT is long ● Q & A 3
  • 4. Agenda ● The goal of producer performance tuning ● Understand Kafka Producer ● Producer performance tuning ○ ProducerPerformance tool ○ Quantitative analysis using producer metrics ○ Play with a toy example ● Some real world examples ○ Latency when acks=-1 ○ Produce when RTT is long ● Q & A 4
  • 5. The goal of producer performance tuning With a given dataset to send: ● Achieve the throughput and latency goals with guarantees of ○ Durability ○ Ordering ● Focus on the average producer performance ○ 99 percentile performance sometimes cannot be “tuned” ○ Tuning average performance also helps 99 percentile numbers ● Today’s talk ○ Fixed data pattern (1000 bytes of integers ranging between 0 - 50000) 5
  • 6. Agenda ● The goal of producer performance tuning ● Understand the Kafka Producer ● Producer performance tuning ○ ProducerPerformance tool ○ Quantitative analysis using producer metrics ○ Play with a toy example ● Some real world examples ○ Latency when acks=-1 ○ Produce when RTT is long ● Q & A 6
  • 7. Understand the Kafka producer ● org.apache.kafka.producer.KafkaProducer ○ If you are still using OLD producer, please upgrade! ● Benchmarks in this talk use Kafka 0.10.0 ○ No broker side recompression (KIP-31) ○ 8 bytes overhead per message due to the introduction of timestamp (KIP-32) 7
  • 8. Critical Configurations ● batch.size ● linger.ms ● compression.type ● max.in.flight.requests.per.connection (affects ordering) ● acks (affects durability) 8
  • 9. Understand the Kafka producer User: producer.send(new ProducerRecord(“topic0”, “hello”), callback); ● Serialization 9 topic=“topic0” value=“hello” Serializer
  • 10. Understand the Kafka producer Topic Metadata topic=“topic0” value=“hello” PartitionerSerializer ● Serialization ● Partitioning topic=“topic0” partition =0 value=“hello” User: producer.send(new ProducerRecord(“topic0”, “hello”), callback); 10
  • 11. Understand the Kafka producer Record Accumulator batch0 batch1 topic0, 0● Serialization ● Partitioning Topic Metadata topic=“topic0” value=“hello” PartitionerSerializer topic=“topic0” partition =0 value=“hello” User: producer.send(new ProducerRecord(“topic0”, “hello”), callback); 11
  • 12. Understand the Kafka producer Record Accumulator batch0 batch1 topic0, 0● Serialization ● Partitioning freeused compressor callbacks Topic Metadata topic=“topic0” value=“hello” PartitionerSerializer topic=“topic0” partition =0 value=“hello” User: producer.send(new ProducerRecord(“topic0”, “hello”), callback); 12
  • 13. Understand the Kafka producer Record Accumulator batch0 batch1 topic0, 0● Serialization ● Partitioning ● Compression freeused compressor callbacks MTopic Metadata topic=“topic0” value=“hello” PartitionerSerializer topic=“topic0” partition =0 value=“hello” User: producer.send(new ProducerRecord(“topic0”, “hello”), callback); 13
  • 14. Understand the Kafka producer Record Accumulator batch0 batch1 topic0, 0● Serialization ● Partitioning ● Compression Tasks done by the user threads. freeused compressor callbacks M CB Topic Metadata topic=“topic0” value=“hello” PartitionerSerializer topic=“topic0” partition =0 value=“hello” User: producer.send(new ProducerRecord(“topic0”, “hello”), callback); 14
  • 15. Understand the Kafka producer Record Accumulator …... batch0 batch1 batch0 batch0 batch1 topic0, 0 topic0, 1 topic1, 0batch2 freeused compressor callbacks M CB sender thread 15 Sender: 1. polls batches from the batch queues (one batch / partition)
  • 16. Sender: 1. polls batches from the batch queues (one batch / partition) 2. groups batches based on the leader broker Understand the Kafka producer Record Accumulator …... batch1 batch1 topic0, 0 topic0, 1 topicN, Mbatch2 sender thread batch0 batch0 batch0 request 0 request 1 Broker 0 Broker 1 (one batch / partition) freeused compressor callbacks M CB 16
  • 17. Sender: 1. polls batches from the batch queues (one batch / partition) 2. groups batches based on the leader broker 3. sends the grouped batches to the brokers 4. Pipelining if max.in.flight.requests.per.connection > 1 Understand the Kafka producer Record Accumulator …... batch1 batch1 topic0, 0 topic0, 1 topicN, Mbatch2 sender thread batch0 batch0 batch0 request 0 request 1 Broker 0 Broker 1 (one batch / partition) freeused compressor callbacks M CB 17
  • 18. Sender: 1. polls batches from the batch queues (one batch / partition) 2. groups batches based on the leader broker 3. sends the grouped batches to the brokers 4. Pipelining if max.in.flight.requests.per.connection > 1 Understand the Kafka producer Record Accumulator …... batch1 batch1 topic0, 0 topic0, 1 topicN, Mbatch2 sender thread batch0 batch0 batch0 request 0 request 1 Broker 0 Broker 1 (one batch / partition) freeused compressor callbacks M CB 18 resp resp
  • 19. sender thread Sender: A batch is ready when one of the following is true: ● batch.size is reached ● linger.ms is reached ● Another batch to the same broker is ready (piggyback) ● flush() or close() is called Understand the Kafka producer Record Accumulator …... batch1 batch1 topic0, 0 topic0, 1 topicN, Mbatch2 Broker 0 Broker 1 freeused compressor callbacks M CB 19
  • 20. sender thread Understand the Kafka producer Record Accumulator …... topic0, 0 topic0, 1 topicN, Mbatch2 batch1 batch1 request 2 Broker 0 Broker 1 freeused compressor callbacks M CB 20 Sender: A batch is ready when one of the following is true: ● batch.size is reached ● linger.ms is reached ● Another batch to the same broker is ready (piggyback) ● flush() or close() is called (one batch / partition)
  • 21. sender thread Understand the Kafka producer Record Accumulator …... topic0, 0 topic0, 1 topicN, Mbatch2 batch1 batch1 request 2 Broker 0 Broker 1 freeused compressor callbacks M CB 21 Sender: A batch is ready when one of the following is true: ● batch.size is reached ● linger.ms is reached ● Another batch to the same broker is ready (piggyback) ● flush() or close() is called (one batch / partition)
  • 22. sender thread Understand the Kafka producer Record Accumulator …... topic0, 0 topic0, 1 topicN, Mbatch2 batch1 batch1 request 2 Broker 0 Broker 1 freeused compressor callbacks M CB callbacks CB resp 22 Sender: On receiving the response ● The callbacks are fired in the message sending order
  • 23. batch.size & linger.ms batch.size is size based batching linger.ms is time based batching In general, more batching ● ⇒ Better compression ratio ⇒ Higher throughput ● ⇒ Higher latency 23
  • 24. compression.type ● Compression is usually the dominant part of the producer.send() ● The speed of different compression types differs A LOT ● Compression is in user thread, so adding more user threads helps with throughput if compression is slow 24
  • 25. acks Defines different durability level for producing. acks Throughput Latency Durability 0 high low No guarantee 1 medium medium leader -1 low high ISR 25
  • 26. max.in.flight.requests.per.connection max.in.flight.requests.per.connection > 1 means pipelining. In general, pipelining ● gives better throughput ● may cause out of order delivery when retry occurs ● Excessive pipelining ⇒ Drop of throughput ○ lock contention ○ worse batching We will be using max.in.flight.requests.per.connection=1 for today’s talk. 26
  • 27. Agenda ● The goal of producer performance tuning ● Understand KafkaProducer ● Producer performance tuning ○ ProducerPerformance tool ○ Quantitative analysis using producer metrics ○ Play with a toy example ● Some real world examples ○ Latency when acks=-1 ○ Produce when RTT is long ● Q & A 27
  • 28. ProducerPerformance Tool Useful producer performance tuning tool: ● org.apache.kafka.tools.ProducerPerformance Example: ./kafka-producer-perf-test.sh --num-records 1000000 --record-size 1000 --topic becket_test_3_replicas_1_partition --throughput 1000000 --producer-props bootstrap. servers=localhost:9092 max.in.flight.requests.per.connection=1 batch.size=100000 compression.type=lz4 28
  • 29. ProducerPerformance Tool Useful producer performance tuning tool: ● org.apache.kafka.tools.ProducerPerformance With KAFKA-3554: ./kafka-producer-perf-test.sh --num-records 1000000 --record-size 1000 --topic becket_test_3_replicas_1_partition --throughput 1000000 --num-threads 2 --value-bound 50000 --producer-props bootstrap.servers=localhost:9092 max.in.flight.requests.per.connection=1 batch.size=100000 compression.type=lz4 ● --num-threads : The number of the user threads to send messages. ● --value-bound : The range of the random integer in the messages. This option is useful when compression is used. Different integer range simulates different compression ratio. 29
  • 30. Quantitative analysis using producer metrics The improved ProducerPerformance tool (KAFKA-3554) prints the following producer metrics. ● Select_Rate_Avg (The rate that the sender thread runs to check if it can send some messages) ● Request_Rate_Avg ● Request_Latency_Avg (Not including the callback execution time) ● Request_Size_Avg (After compression) ● Batch_Size_Avg (After compression) ● Records_Per_Request_Avg ● Record_Queue_Time_Avg ● Compression_Rate_Avg Note: The metrics need some time (~ 1 min) to become stable. 30
  • 31. Quantitative analysis using producer metrics ./kafka-producer-perf-test.sh --num-records 1000000 --record-size 1000 --topic becket_test_3_replicas_4_partition --throughput 100000 --num-threads 1 --value-bound 50000 --producer-props bootstrap.servers=localhost:9092 compression.type=gzip max.in.flight. requests.per.connection=1 1000000 records sent, 10444.300545 records/sec (9.96 MB/sec), 4.19 ms avg latency, 154.00 ms max latency, 4 ms 50th, 6 ms 95th, 6 ms 99th, 22 ms 99.9th. Select_Rate_Avg: 3114.67 Request_Rate_Avg: 1448.53 Request_Latency_Avg: 2.73 Request_Size_Avg: 5034.47 Batch_Size_Avg: 4941.93 Records_Per_Request_Avg: 7.05 Record_Queue_Time_Avg: 2.45 Compression_Rate_Avg: 0.68 31
  • 32. Quantitative analysis using producer metrics 1. throughput_Avg ~= Request_Rate_Avg * Request_Size_Avg / Compression_Rate_Avg ./kafka-producer-perf-test.sh --num-records 1000000 --record-size 1000 --topic becket_test_3_replicas_4_partition -- throughput 100000 --num-threads 1 --value-bound 50000 --producer-props bootstrap.servers=localhost:9092 compression. type=gzip max.in.flight.requests.per.connection=1 1000000 records sent, 10444.300545 records/sec (9.96 MB/sec), 4.19 ms avg latency, 154.00 ms max latency, 4 ms 50th, 6 ms 95th, 6 ms 99th, 22 ms 99.9th. Select_Rate_Avg: 3114.67 Request_Rate_Avg: 1448.53 Request_Latency_Avg: 2.73 Request_Size_Avg: 5034.47 Batch_Size_Avg: 4941.93 Records_Per_Request_Avg: 7.05 Record_Queue_Time_Avg: 2.45 Compression_Rate_Avg: 0.68 1448.53 * 5034.47 / 0.68 = 10.22 MB/sec (The gap is due to the request_overhead) 32
  • 33. Quantitative analysis using producer metrics 2. Request_Size_Avg = Records_Per_Request_Avg * Record_Size * Compression_Rate_Avg + Request_Overhead ./kafka-producer-perf-test.sh --num-records 1000000 --record-size 1000 --topic becket_test_3_replicas_4_partition -- throughput 100000 --num-threads 1 --value-bound 50000 --producer-props bootstrap.servers=localhost:9092 compression. type=gzip max.in.flight.requests.per.connection=1 1000000 records sent, 10444.300545 records/sec (9.96 MB/sec), 4.19 ms avg latency, 154.00 ms max latency, 4 ms 50th, 6 ms 95th, 6 ms 99th, 22 ms 99.9th. Select_Rate_Avg: 3114.67 Request_Rate_Avg: 1448.53 Request_Latency_Avg: 2.73 Request_Size_Avg: 5034.47 Batch_Size_Avg: 4941.93 Records_Per_Request_Avg: 7.05 Record_Queue_Time_Avg: 2.45 Compression_Rate_Avg: 0.68 7.05 * 1000 * 0.68 + Request_Overhead = 4794 + Request_Overhead The Request_Overhead: ● depends on the number of topics and partitions ● usually ranges from dozens bytes to hundreds of bytes. 33
  • 34. Quantitative analysis using producer metrics 3. Request_Rate_Upper_Limit = (1000 / Request_Latency_Avg) * Num_Brokers ./kafka-producer-perf-test.sh --num-records 1000000 --record-size 1000 --topic becket_test_3_replicas_4_partition -- throughput 100000 --num-threads 1 --value-bound 50000 --producer-props bootstrap.servers=localhost:9092 compression. type=gzip max.in.flight.requests.per.connection=1 1000000 records sent, 10444.300545 records/sec (9.96 MB/sec), 4.19 ms avg latency, 154.00 ms max latency, 4 ms 50th, 6 ms 95th, 6 ms 99th, 22 ms 99.9th. Select_Rate_Avg: 3114.67 Request_Rate_Avg: 1448.53 Request_Latency_Avg: 2.73 Request_Size_Avg: 5034.47 Batch_Size_Avg: 4941.93 Records_Per_Request_Avg: 7.05 Record_Queue_Time_Avg: 2.45 Compression_Rate_Avg: 0.68 (1000 / 2.73) * 5 = 1813 The gap is: ● due to the producer overhead, ● larger if request rate is higher 34
  • 35. Quantitative analysis using producer metrics 4. latency_avg ~= (Record_Queue_Time_Avg / 2) + Request_Latency_Avg + Callback_Latency ./kafka-producer-perf-test.sh --num-records 1000000 --record-size 1000 --topic becket_test_3_replicas_4_partition -- throughput 100000 --num-threads 1 --value-bound 50000 --producer-props bootstrap.servers=localhost:9092 compression. type=gzip max.in.flight.requests.per.connection=1 1000000 records sent, 10444.300545 records/sec (9.96 MB/sec), 4.19 ms avg latency, 154.00 ms max latency, 4 ms 50th, 6 ms 95th, 6 ms 99th, 22 ms 99.9th. Select_Rate_Avg: 3114.67 Request_Rate_Avg: 1448.53 Request_Latency_Avg: 2.73 Request_Size_Avg: 5034.47 Batch_Size_Avg: 4941.93 Records_Per_Request_Avg: 7.05 Record_Queue_Time_Avg: 2.45 Compression_Rate_Avg: 0.68 2.45 / 2 + 2.73 + Callback_Latency = 3.96 + Callback_Latency (The callback latency and some other time cost in the ProducerPerformance tool is usually small enough to ignore) 35
  • 36. Play with a toy example ./kafka-producer-perf-test.sh --num-records 1000000 --record-size 1000 --topic becket_test_3_replicas_4_partition -- throughput 100000 --num-threads 1 --value-bound 50000 --producer-props bootstrap.servers=localhost:9092 compression. type=gzip max.in.flight.requests.per.connection=1 1000000 records sent, 10444.300545 records/sec (9.96 MB/sec), 4.19 ms avg latency, 154.00 ms max latency, 4 ms 50th, 6 ms 95th, 6 ms 99th, 22 ms 99.9th. Select_Rate_Avg: 3114.67 Request_Rate_Avg: 1448.53 Request_Latency_Avg: 2.73 Request_Size_Avg: 5034.47 Batch_Size_Avg: 4941.93 Records_Per_Request_Avg: 7.05 Record_Queue_Time_Avg: 2.45 Compression_Rate_Avg: 0.68 ● RTT=1.55 ms ● 5 broker cluster 36
  • 37. Play with a toy example ./kafka-producer-perf-test.sh --num-records 1000000 --record-size 1000 --topic becket_test_3_replicas_4_partition -- throughput 100000 --num-threads 1 --value-bound 50000 --producer-props bootstrap.servers=localhost:9092 compression. type=gzip max.in.flight.requests.per.connection=1 1000000 records sent, 10444.300545 records/sec (9.96 MB/sec), 4.19 ms avg latency, 154.00 ms max latency, 4 ms 50th, 6 ms 95th, 6 ms 99th, 22 ms 99.9th. Select_Rate_Avg: 3114.67 Request_Rate_Avg: 1448.53 Request_Latency_Avg: 2.73 Request_Size_Avg: 5034.47 Batch_Size_Avg: 4941.93 Records_Per_Request_Avg: 7.05 Record_Queue_Time_Avg: 2.45 Compression_Rate_Avg: 0.68 ● Network Bandwidth = 1 Gbps: ○ Throughput can be improved 37
  • 38. Play with a toy example ./kafka-producer-perf-test.sh --num-records 1000000 --record-size 1000 --topic becket_test_3_replicas_4_partition -- throughput 100000 --num-threads 1 --value-bound 50000 --producer-props bootstrap.servers=localhost:9092 compression. type=gzip max.in.flight.requests.per.connection=1 1000000 records sent, 10444.300545 records/sec (9.96 MB/sec), 4.19 ms avg latency, 154.00 ms max latency, 4 ms 50th, 6 ms 95th, 6 ms 99th, 22 ms 99.9th. Select_Rate_Avg: 3114.67 Request_Rate_Avg: 1448.53 Request_Latency_Avg: 2.73 Request_Size_Avg: 5034.47 Batch_Size_Avg: 4941.93 Records_Per_Request_Avg: 7.05 Record_Queue_Time_Avg: 2.45 Compression_Rate_Avg: 0.68 throughput_Avg ~= Request_Rate_Avg * Request_Size_Avg / Compression_Rate_Avg ● RTT = 1.55 ms: ○ Request Latency is not bad. ● 1448 Request rate is not bad ○ 5 brokers * (1000 / 2.73) = 1813 (theoretical upper limit) ● Each request is too small ○ Default batch size = 16KB 38
  • 39. Play with a toy example ./kafka-producer-perf-test.sh --num-records 1000000 --record-size 1000 --topic becket_test_3_replicas_4_partition -- throughput 100000 --num-threads 1 --value-bound 50000 --producer-props bootstrap.servers=localhost:9092 compression. type=gzip max.in.flight.requests.per.connection=1 1000000 records sent, 10444.300545 records/sec (9.96 MB/sec), 4.19 ms avg latency, 154.00 ms max latency, 4 ms 50th, 6 ms 95th, 6 ms 99th, 22 ms 99.9th. Select_Rate_Avg: 3114.67 Request_Rate_Avg: 1448.53 Request_Latency_Avg: 2.73 Request_Size_Avg: 5034.47 Batch_Size_Avg: 4941.93 Records_Per_Request_Avg: 7.05 Record_Queue_Time_Avg: 2.45 Compression_Rate_Avg: 0.68 throughput_Avg ~= Request_Rate_Avg * Request_Size_Avg / Compression_Rate_Avg Ways to increase request size: 1. Add more user threads 2. Increase number of partitions 3. Increase linger.ms (more batching) 39
  • 40. Play with a toy example ./kafka-producer-perf-test.sh --num-records 1000000 --record-size 1000 --topic becket_test_3_replicas_4_partition -- throughput 100000 --num-threads 1 --value-bound 50000 --producer-props bootstrap.servers=localhost:9092 compression. type=gzip max.in.flight.requests.per.connection=1 1000000 records sent, 10444.300545 records/sec (9.96 MB/sec), 4.19 ms avg latency, 154.00 ms max latency, 4 ms 50th, 6 ms 95th, 6 ms 99th, 22 ms 99.9th. Select_Rate_Avg: 3114.67 Request_Rate_Avg: 1448.53 Request_Latency_Avg: 2.73 Request_Size_Avg: 5034.47 Batch_Size_Avg: 4941.93 Records_Per_Request_Avg: 7.05 Record_Queue_Time_Avg: 2.45 Compression_Rate_Avg: 0.68 throughput_Avg ~= Request_Rate_Avg * Request_Size_Avg / Compression_Rate_Avg Ways to increase request size: 1. Add more user threads 2. Increase number of partitions 3. Increase linger.ms (more batching)? 40
  • 42. More Batching 42 More batching does not help!? Compression Ratio is not improved much!
  • 43. More Batching 43 More batching does not help!? Compression Ratio is not improved much! But why throughput becomes worse!?
  • 44. Impact of Batch Size on GZIP Compression 44 When batch size is doubled from 16K to 32K, the time needed to fill in the batch is almost tripled! (The results are from JMH Micro Benchmark) batch size (KB) Time to fill up the batch (ns) 16 1768583.939 32 5234432.44 64 13307411.93 128 29539258.9 192 45549678.03 256 61579312.57
  • 45. Impact of Batch Size on GZIP Compression 45 Batch_Size_Avg: Record_Queue_Time_Avg: 15075.84 3.86 30681.25 9.37 61687.88 21.12 124451.51 47.2 248860.43 92.14 498640.58 184.84 When batch size is doubled from 16K to 32K, the time needed to fill in the batch is 2.5x! (The results are from ProducerPerformance tool with 1 user thread, 1 partition, linger.ms=20000)
  • 46. Impact of Batch Size on GZIP Compression 46 Different value bounds show similar results.
  • 47. Impact of Batch Size on Compression 47 Snappy and LZ4 has similar impact at different batch size.
  • 48. When to increase batching ● Compression Ratio Gain > Compression Speed Loss ● Bottleneck is not in the user threads 48
  • 49. Play with a toy example OK… Let’s increase number of user threads then. 49 When there are 10 user threads: ● Throughput drops ● Latency soars
  • 50. Play with a toy example OK… Let’s increase number of user threads then. 50 ● Lock contention (10 user threads V.S. 4 partitions) ● batches are piling up! When there are 10 user threads: ● Throughput drops ● Latency soars Records Queue Time = 3323.85 ms
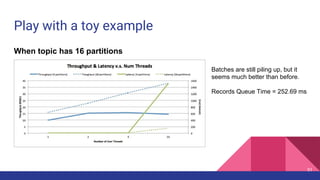
  • 51. Play with a toy example When topic has 16 partitions 51 Batches are still piling up, but it seems much better than before. Records Queue Time = 252.69 ms
  • 52. Play with a toy example Let’s try tweak the batch size. --num-threads 10, batch.size=16K, 16 partitions 2000000 records sent, 39791.492579 records/sec (37.95 MB/sec), 152.77 ms avg latency, 1182.00 ms max latency, 14 ms 50th, 841 ms 95th, 1128 ms 99th, 1162 ms 99.9th. (Requests are piling up, so the bottleneck is the sender thread) --num-threads 10, batch.size=800K, 16 partitions 2000000 records sent, 35647.446752 records/sec (34.00 MB/sec), 20.31 ms avg latency, 502.00 ms max latency, 17 ms 50th, 37 ms 95th, 68 ms 99th, 325 ms 99.9th. (Requests are no longer piling up, the bottleneck shifted to user threads) Usually bigger batch leads to bigger latency. But increasing batch size can improve latency by preventing the batches from piling up! 52
  • 53. Play with a toy example To improve both latency & throughput? Increase number of partitions again. --num-threads 10, batch.size=16K 2000000 records sent, 39791.492579 records/sec (37.95 MB/sec), 152.77 ms avg latency, 1182.00 ms max latency, 14 ms 50th, 841 ms 95th, 1128 ms 99th, 1162 ms 99.9th. --num-threads 10, batch.size=800K 2000000 records sent, 35647.446752 records/sec (34.00 MB/sec), 20.31 ms avg latency, 502.00 ms max latency, 17 ms 50th, 37 ms 95th, 68 ms 99th, 325 ms 99.9th. --num-threads 10, batch.size=16K, 32 partitions. 2000000 records sent, 43432.939541 records/sec (41.42 MB/sec), 47.29 ms avg latency, 291.00 ms max latency, 22 ms 50th, 225 ms 95th, 246 ms 99th, 270 ms 99.9th. 53
  • 54. Find the throughput bottleneck Is the bottleneck in user thread? ● Increase --num-threads and see if throughput increases accordingly ● Pay attention to lock contention Is the bottleneck in sender thread? ● Is throughput (MB/sec) << network bandwidth ● Is Record_Queue_Time_Avg large? ● Is Batch_Size_Avg almost equals to batch.size? Is the bottleneck in broker? ● Is the request latency very large? 54
  • 55. Agenda ● The goal of producer performance tuning ● Understand KafkaProducer ● Producer performance tuning ○ ProducerPerformance tool ○ Quantitative analysis using producer metrics ○ Play with a toy example ● Some real world examples ○ Latency when acks=-1 ○ Produce when RTT is long ● Q & A 55
  • 56. Latency when acks=-1 Broker 0 Broker 1 Partition 0 Partition 1 Partition 2 p0 p1 p2 ProduceRequest Partition 0 Partition 1 Partition 2 1 2 Producer 3 4 ProduceResponse 5 1. [Network] ProduceRequest Send Time 2. [Broker] ProduceRequest Queue Time 3. [Broker] ProduceRequest Local Time 4. [Broker] ProduceRequest Remote Time 5. [Broker] ProduceResponse Queue Time 6. [Broker] ProduceResponse Send Time 6 56
  • 57. Latency when acks=-1 Broker 0 Broker 1 Partition 0 Partition 1 Partition 2 p0 p1 p2 ProduceRequest Partition 0 Partition 1 Partition 2 1 2 Producer 3 4 ProduceResponse 5 1. [Network] ProduceRequest Send Time 2. [Broker] ProduceRequest Queue Time 3. [Broker] ProduceRequest Local Time 4. [Broker] ProduceRequest Remote Time (Replication Time) 5. [Broker] ProduceResponse Queue Time 6. [Broker] ProduceResponse Send Time 6 57
  • 58. Latency when acks=-1 Broker 0 Broker 1 Partition 0 Partition 1 Partition 2 p0 p1 p2 ProduceRequest p0 high watermark fetch (p0,100; p1,200; p2,50) 100 105 ● The followers fetches data of the partitions from the leader. ● The leader uses high watermarks to the In Sync Replicas (ISR) of the all partitions 58 200 50 200 50 Partition 0 Partition 1 Partition 2 100
  • 59. Latency when acks=-1 Broker 0 Broker 1 Partition 0 Partition 1 Partition 2 p0 p1 p2 ProduceRequest Partition 0 Partition 1 Partition 2 p0 high watermark 100 105 p0 The high watermarks are not updated after the data is sent. 100 fetch (p0,100; p1,200; p2,50) 59 200 50 200 50
  • 60. Latency when acks=-1 Broker 0 Broker 1 Partition 0 Partition 1 Partition 2 p0 p1 p2 ProduceRequest Partition 0 Partition 1 Partition 2 p0 high watermark 100 105 p0 p0 The high watermarks are not updated after the data is sent. 100 105 fetch (p0,100; p1,200; p2,50) 60 200 50 200 50
  • 61. Latency when acks=-1 Broker 0 Broker 1 Partition 0 Partition 1 Partition 2 p0 p1 p2 ProduceRequest Partition 0 Partition 1 Partition 2 p0 high watermark 100 105 p0 p0 The high watermarks are not updated after the data is sent. 100 105 fetch (p0,100; p1,200; p2,50) 61 200 50 200 50 p1 p2 203 60
  • 62. fetch (p0,105; p1,200; p2,50) Latency when acks=-1 Broker 0 Partition 0 Partition 1 Partition 2 p0 p1 p2 ProduceRequest p0 100 105 p0 Broker 1 Partition 0 Partition 1 Partition 2 p0 The high watermark increases lazily. There is one fetch delay. 100 105 fetch (p0,100; p1,200; p2,50) 200 50 200 50 62 p1 p2 203 60 high watermark
  • 63. fetch (p0,105; p1,200; p2,50) Latency when acks=-1 Broker 0 Partition 0 Partition 1 Partition 2 p0 p1 p2 ProduceRequest p0 100 105 p0 Broker 1 Partition 0 Partition 1 Partition 2 p0 The high watermark increases lazily. There is one fetch delay. 100 105 fetch (p0,100; p1,200; p2,50) 200 50 200 50 63 p1 p2 203 60 high watermark
  • 64. fetch (p0,105; p1,200; p2,50) Latency when acks=-1 Broker 0 Partition 0 Partition 1 Partition 2 p0 p1 p2 ProduceRequest p0 100 105 p0 Broker 1 Partition 0 Partition 1 Partition 2 p0 ProduceResponse p1 p1 p2 p2 The replication is not ProduceRequest aware. ● The messages produced in the same ProduceRequest may be replicated in multiple fetches. ● ProduceRequests interfere with each other. 100 105 p1 p2 fetch (p0,100; p1,200; p2,50) 200 203 50 60 200 203 50 60 64 high watermark
  • 65. fetch (p0,105; p1,200; p2,50) Latency when acks=-1 Broker 0 Partition 0 Partition 1 Partition 2 p0 p1 p2 ProduceRequest p0 100 105 p0 Broker 1 Partition 0 Partition 1 Partition 2 p0 ProduceResponse p1 p1 p2 p2 Only when the high watermarks of all the partitions has passed the offset of the appended messages in the ProduceRequest, the ProduceResponse will be sent. 100 105 p1 p2 fetch (p0,100; p1,200; p2,50) fetch (p0,105; p1,203; p2,60) 200 203 50 60 200 203 50 60 65 high watermark
  • 66. fetch (p0,105; p1,200; p2,50) Latency when acks=-1 Broker 0 Partition 0 Partition 1 Partition 2 p0 p1 p2 ProduceRequest p0 100 105 p0 Broker 1 Partition 0 Partition 1 Partition 2 p0 ProduceResponse p1 p1 p2 p2 Only when the high watermarks of all the partitions has passed the offset of the appended messages in the ProduceRequest, the ProduceResponse will be sent. 100 105 p1 p2 fetch (p0,100; p1,200; p2,50) fetch (p0,105; p1,203; p2,60) 200 203 50 60 200 203 50 60 66 high watermark
  • 67. fetch (p0,105; p1,200; p2,50) Latency when acks=-1 Broker 0 Partition 0 Partition 1 Partition 2 p0 p1 p2 ProduceRequest p0 100 105 p0 Broker 1 Partition 0 Partition 1 Partition 2 p0 ProduceResponse p1 p1 p2 p2 Assuming broker 1 only has one replication thread, Replication Time ~= Num_Fetches * (Local_Time_On_The_Follower + Fetch_Request_Total_Time_On_The_Leader) 100 105 p1 p2 fetch (p0,100; p1,200; p2,50) fetch (p0,105; p1,203; p2,60) 200 203 50 60 200 203 50 60 67 high watermark
  • 68. Latency when acks=-1 Replication Time ~= Num_Fetches * (Local_Time_On_The_Follower + Fetch_Request_Total_Time_On_The_Leader) / num.replica.fetchers ● Increase num.replica.fetchers ○ Parallel fetch ○ Each replica fetcher fetches from a distinct set of partitions. ● Not perfect solution ○ Diminishing effect ○ Scalability concern ■ Replica fetchers per broker = (Cluster_Size - 1 ) * num.replica.fetchers 68
  • 69. Latency when acks=-1 How many replica fetchers are enough? ● The latency target is met ● If Replica FetchRequest Remote Time > 0 ○ The replica fetch requests are waiting for the messages to arrive. ○ Increasing num.replica.fetchers won’t improve latency. ● Partitions per replica fetcher is low 69
  • 70. Agenda ● The goal of producer performance tuning ● Understand KafkaProducer ● Producer performance tuning ○ ProducerPerformance tool ○ Quantitative analysis using producer metrics ○ Play with a toy example ● Some real world examples ○ Latency when acks=-1 ○ Produce when RTT is long ● Q & A 70
  • 71. Produce when RTT is long We have a cross-ocean pipeline using remote produce ● RTT is big (~200 ms) ● Bandwidth = 1 Gb/s ● Batch size 800K ● Linger.ms 30ms ● 64 Partitions ● 8 user threads 71
  • 72. Produce when RTT is long We have a cross-ocean pipeline using remote produce ● RTT is big (~200 ms) ● Bandwidth = 1 Gb/s ● Batch size 800K ● Linger.ms 30ms ● 64 Partitions ● 8 user threads ● Throughput < 1 MB/s 72
  • 73. Produce when RTT is long The TCP connection needs more send and receive buffer. Broker default: socket.receive.buffer.bytes = 100K Producer default: send.buffer.bytes = 128K Theoretical throughput with default setting = 100K / RTT = 500KB Theoretical best buffer size = RTT * Bandwidth = 0.2s * 1 Gb/s = 25 MB 73
  • 74. Produce when RTT is long Changing socket buffer size may require OS TCP buffer limit. 74
  • 75. Produce when RTT is long Changing socket buffer size may require OS TCP buffer limit. # The default setting of the socket receive buffer in bytes. net.core.rmem_default = 124928 # The maximum receive socket buffer size in bytes. net.core.rmem_max = 2048000 # The default setting (in bytes) of the socket send buffer. net.core.wmem_default = 124928 # The maximum send socket buffer size in bytes. net.core.wmem_max = 2048000 75
  • 77. Producer Metrics With 4 Partitions 77 1 thread 2 threads 4 threads 10 threads Select_Rate_Avg: 3114.67 682.55 1359.05 2641.75 Request_Rate_Avg: 1448.53 1282.76 840.36 634.22 Request_Latency_Avg: 2.73 3.11 4.62 6.09 Request_Size_Avg: 5034.47 8703.1 13192.99 14931.51 Batch_Size_Avg: 4941.93 8607.87 13098.74 14837.54 Records_Per_Request_Avg: 7.05 12.46 19.08 21.63 Record_Queue_Time_Avg: 2.45 2.79 5.17 3323.85 Compression_Rate_Avg: 0.68 0.67 0.66 0.66
  • 78. Producer Metrics With 16 Partitions 78 1 Thread 2 Threads 4 Threads 10 Threads Select_Rate_Avg: 2746.74 1948.27 1241.82 2199.14 Request_Rate_Avg: 1270.49 1093.21 812.54 568.09 Request_Latency_Avg: 3.91 4.53 6.07 8.16 Request_Size_Avg: 8758.02 15447.04 27688.3 45652.14 Batch_Size_Avg: 2706.87 4808.15 8638.38 14283.30 Records_Per_Request_Avg: 12.01 21.82 39.86 66.33 Record_Queue_Time_Avg: 3.13 3.86 6.42 252.69 Compression_Rate_Avg: 0.68 0.67 0.66 0.66
  • 79. Lock contention for sender thread Threads 2 4 8 10 linger.ms 50 30 20 15 Record_Queue_Time_Avg 50 31.08 21.21 17.27 Difference 0 1.08 1.21 2.27 This table shows some evidence of lock contention in the Kafka producer. For a topic with 16 partitions, we do the following: ● Set linger.ms to make them almost the generating the similar size of batch. ● Compare the difference between linger.ms and Record_Queue_Time_Avg ● The bigger the difference is, the worse the lock contention is between the sender thread and the user threads. 79