SlideShare a Scribd company logo
Colonel Zulfiquer Ahmed Amin
M Phil, MPH, PGD (Health Economics), MBBS
Armed Forces Medical Institute (AFMI)
Project Management?
Project management is the application of processes, methods,
knowledge, skills and experience to achieve the project objectives.
A key factor that distinguishes project management from just
'management' is that it has this final deliverable and a finite
timespan, unlike management which is usually an ongoing process.
Because of this a project professional needs a wide range of skills;
often technical skills, and certainly people management skills and
good business awareness.
Project management is the practice of initiating, planning,
executing, controlling, and closing the work of a team to achieve
specific goals and meet specific success criteria at the specified time.
A project is a temporary endeavor designed to produce a unique
product, service or result with a defined beginning and end (usually
time-constrained, and often constrained by funding or staffing)
undertaken to meet unique goals and objectives, typically to bring
about beneficial change or added value. The temporary nature of
projects stands in contrast with business as usual (or operations),
which are repetitive, permanent, or semi-permanent functional
activities to produce products or services.
A project is unique in that it is not a routine operation, but a
specific set of operations designed to accomplish a singular goal. So
a project team often includes people who don’t usually work
together – sometimes from different organizations and across
multiple geographies.
And all must be expertly managed to deliver the right quality, on-
time, on-budget results.
Scope of a Project
Program
A project is a singular effort of defined duration, whereas a program
is comprised of a collection of projects.
Project
Project is defined as “A temporary organization that is created for
the purpose of delivering one or more business products according
to a specified Business Case”.
Program
Program is defined as “A group of related projects managed in a
coordinated way to obtain benefits and control not available from
managing them individually”.
Project management is a challenging task with many complex
responsibilities. Fortunately, there are many tools available to assist
with accomplishing the tasks and executing the responsibilities.
Some require a computer with supporting software, while others
can be used manually. Project managers should choose a project
management tool that best suits their management style. No one
tool addresses all project management needs.
Project management tools and techniques are precisely what make
managing projects easier and more effective.
Planning tools and techniques in management include CPM, PERT,
KANBAN, SWOT Analysis and the Gantt-chat etc.
PERT
The Project Evaluation and Review Technique, commonly
abbreviated PERT, is a statistical tool, used in project management. It
was developed for the U.S. Navy Special Projects Office in 1957 to
support the U.S. Navy's Polaris nuclear submarine project. An early
example was, it was used for the 1968 Winter Olympics in Grenoble
which applied PERT from 1965 until the opening of the 1968 Games.
Project Management Tools and Techniques (PERT- Project Evaluation and Review Technique; CPM- Critical Path Method))
It is used more in projects where time is the major factor rather than
cost. It is applied to very large-scale, one-time, complex, non-routine
infrastructure and Research and Development projects.
PERT and CPM are complementary tools, because "CPM employs
one time estimate and one cost estimate for each activity; PERT may
utilize three time estimates (optimistic, expected, and pessimistic)
and no costs for each activity.
A PERT network chart for a seven-month project with five
milestones (Nodes: 10 through 50) and six activities (Arrows: A
through F)
Components of PERT Network
Project Management Tools and Techniques (PERT- Project Evaluation and Review Technique; CPM- Critical Path Method))
Steps in PERT
PERT planning involves the following steps:
1. Identify the specific activities and milestones.
2. Determine the proper sequence of the activities.
3. Construct a network diagram.
4. Estimate the time required for each activity.
5. Determine the critical path.
6. Update the PERT chart as the project progresses.
1. Identify the specific activities and milestones.
The activities are the tasks required to complete a project. The
milestones are the events marking the beginning and the end of one
or more activities.
2. Determine the proper sequence of the activities.
This step may be combined with the activity identification step since
the activity sequence is evident for some tasks. Other tasks may
require more analysis to determine the exact order in which they
must be performed.
3. Construct a network diagram.
Using the activity sequence information, a network diagram can be
drawn showing the sequence of the serial and parallel activities.
Software packages simplify this step by automatically converting
tabular activity information into a network diagram.
Example
In the following example there are seven tasks, labeled A through G.
Some tasks can be done concurrently (A and B) while others cannot
be done until their predecessor task is complete (C cannot begin
until A is complete). Additionally, each task has three time
estimates: the optimistic time estimate (o), the most likely or
normal time estimate (m), and the pessimistic time estimate (p).
The expected time (te) is computed using the formula (o + 4m + p) ÷
6.
Activity Predecessor
Time estimates Expected
time
te = (o + 4m + p) ÷ 6
Opt. (o) Normal (m) Pess. (p)
A — 2 4 6 4.00
B — 3 5 9 5.33
C A 4 5 7 5.17
D A 4 6 10 6.33
E B, C 4 5 7 5.17
F D 3 4 8 4.50
G E 3 5 8 5.17
4. Estimate the time required for each activity.
Weeks are a commonly used unit of time for activity completion, but any
consistent unit of time can be used. A distinguishing feature of PERT is its
ability to deal with uncertainty in activity completion time.
5. Determine the critical path.
The critical path is determined by adding the times for the activities in
each sequence and determining the longest path in the project. The critical
path determines the total calendar time required for the project. If
activities outside the critical path speed up or slow down (within limits),
the total project time does not change.
6. Update the PERT chart as the project progresses.
Make adjustments in the PERT chart as the project progresses. As the
project unfolds, the estimated times can be replaced with actual times. In
cases where there are delays, additional resources may be needed to stay
on schedule and the PERT chart may be modified to reflect the new
situation.
Time
PERT has defined four types of time required to accomplish an activity:
optimistic time: the minimum possible time required to accomplish an
activity (o) or a path (O), assuming everything proceeds better than is
normally expected
pessimistic time: the maximum possible time required to accomplish an
activity (p) or a path (P), assuming everything goes wrong (but
excluding major catastrophes).
most likely time: the best estimate of the time required to accomplish
an activity (m) or a path (M), assuming everything proceeds as normal.
expected time: the best estimate of the time required to accomplish an
activity (te) or a path (TE), accounting for the fact that things don't
always proceed as normal (the implication being that the expected
time is the average time the task would require if the task were
repeated on a number of occasions over an extended period of time.
te = (o + 4m + p) ÷ 6
Project Management Tools and Techniques (PERT- Project Evaluation and Review Technique; CPM- Critical Path Method))
The time estimates managers provide for the various activities
comprising a project involve different degrees of certainty. When
time estimates can be made with a high degree of certainty, they
are called deterministic estimates. When they are subject to
variation, they are called probabilistic estimates. In using the
probabilistic approach, managers provide three estimates for each
activity: an optimistic or best case estimate; a pessimistic or worst
case estimate; and the most likely estimate.
Management tools
PERT supplies a number of tools for management with determination
of concepts, such as:
float or slack is a measure of the excess time and resources available
to complete a task. It is the amount of time that a project task can be
delayed without causing a delay in any subsequent tasks (free float)
or the whole project (total float). Positive slack would indicate ahead
of schedule; negative slack would indicate behind schedule; and zero
slack would indicate on schedule.
critical path: the longest possible continuous pathway taken from the
initial event to the terminal event. It determines the total calendar
time required for the project; and, therefore, any time delays along
the critical path will delay the reaching of the terminal event by at
least the same amount.
critical activity: An activity that has total float equal to zero. An
activity with zero float is not necessarily on the critical path since
its path may not be the longest.
Fast tracking –
A schedule compression technique in which activities or phases
normally done in sequence are performed in parallel for at least
a portion of their duration. To do more things in the same time in
order to finish a job earlier than normal or planned.
Crashing: A technique used to shorten the schedule duration for
the least incremental cost by adding resources. Shortening the
durations of critical path activities by adding resources.
Additional resources doesn’t only mean additional number of heads
but it can be any of below:
- Approving overtime
- Paying extra
- Adding more resources
Lead Time
When the first activity is still running and second activity starts, this
is called Lead. The balance of time for the first activity is known as
Lead Time. Lead Time is the overlap between the first and second
activity.
For example, let us say that the time duration for the first activity is
20 days, and for the second activity it is 15 days. As the first activity
completes its first 15 days, you start working on the second activity.
(Please note that the first activity still has 5 days to finish itself
completely.)
Lag Time
When the first activity completes, if there is then a delay or wait
period before the second activity starts, this is called lag and the
delay is known as the Lag Time. Lag Time is the delay between the
first and second activity.
For example, the time duration for the first activity is 3 days, and for
the second activity it is 2 days. After completing the first activity you
wait for one day, and then you start the second activity. (Please note
that here you start second activity after one day of completing the
first activity.)
In this case, we say that Lag Time is one day, or Finish to Start
activity with one day delay or lag.
NETWORK DIAGRAMS
The chief feature of PERT analysis is a network diagram that provides
a visual depiction of the major project activities and the sequence in
which they must be completed. Activities are defined as distinct
steps toward completion of the project that consume either time or
resources. The network diagram consists of arrows and nodes. For
each activity, managers provide an estimate of the time required to
complete it.
The sequence of activities leading from the starting point of the
diagram to the finishing point of the diagram is called a path. The
amount of time required to complete the work involved in any path
can be figured by adding up the estimated times of all activities
along that path. The path with the longest total time is then called
the "critical path". The critical path is the most important part of the
diagram for managers: it determines the completion date of the
project. Delays in completing activities along the critical path
necessitate an extension of the final deadline for the project. If a
manager hopes to shorten the time required to complete the
project, he or she must focus on finding ways to reduce the time
involved in activities along the critical path.
PERT ANALYSIS
Managers can obtain a great deal of information by analyzing
network diagrams of projects. For example, network diagrams show
the sequence of activities involved in a project. From this sequence,
managers can determine which activities must take place before
others can begin, and which can occur independently of one
another. Managers can also gain valuable insight by examining paths
other than the critical path. Since these paths require less time to
complete, they can often accommodate slippage without affecting
the project completion time.
Slack versus Float
The difference between the length of a given path and the length of
the critical path is known as slack. Knowing where slack is located
helps managers to prioritize allocation of scarce resources and
direct their efforts to control activities.
The terms "slack" and "float" are often used interchangeably.
However, the essential difference between the terms is that slack is
typically associated with inactivity, while float is associated with
activity. Slack time allows an activity to start later than originally
planned, while float time allows an activity to take longer than
originally planned.
Project Management Tools and Techniques (PERT- Project Evaluation and Review Technique; CPM- Critical Path Method))
Advantages of PERT
- PERT (Program Evaluation and Review Technique) compels
managers to plan, which helps them see how the pieces fit together.
Each subordinate manger has to plan the events for which her or she
is responsible.
- It concentrates on critical elements that may need correction.
- It makes possible a kind of forward-looking control.
- The network system with its subsystems enables managers to aim
reports and pressure for action at the right spot and level in the
organization structure at the right time.
Disadvantages of PERT
- Because of its emphasis on “activity-time” to its operation, PERT is
not useful when no reasonable estimates of time schedule can be
made.
- Another disadvantage has been its emphasis on time only but not
on costs.
Critical Path Method (CPM)
The critical path method (CPM) is a step-by-step project
management technique for process planning that defines critical
and non-critical tasks with the goal of preventing time-frame
problems and process bottlenecks. The CPM is ideally suited to
projects consisting of numerous activities that interact in a complex
manner.
Critical path project management (CPM) technique is used to
complete projects on time by focusing on key tasks. By focusing on
the tasks that make up the critical path, the project manager
maximizes the chances of completing the project on time.
The critical path can be defined in many ways including:
- The longest path in the network diagram, or
- The shortest duration in which the project can be completed.
History
The critical path method (CPM) is a project modeling technique
developed in the late 1950s by DuPont, and was first used in missile-
defense construction projects of US Navy.
Critical Path Analysis is commonly used with all forms of projects,
including construction, aerospace and defense, software
development, research projects, product development, engineering,
and plant maintenance, among others.
Any project with interdependent activities can apply this method of
mathematical analysis.
The first time CPM was used for major skyscraper development was
in 1966 while constructing the former World Trade Center Twin
Towers in New York City.
Components
The essential technique for using CPM: is to construct a model of
the project that includes the following:
1. A list of all activities required to complete the project (typically
categorized within a work breakdown structure),
2. The time (duration) that each activity will take to complete,
3. The dependencies between the activities and,
4. Logical end points such as milestones or deliverable items.
Project Management Tools and Techniques (PERT- Project Evaluation and Review Technique; CPM- Critical Path Method))
The duration of each activity is listed above each node in the
diagram. For each path, add the duration of each node to determine
it's total duration. The critical path is the one with the longest
duration.
There are three paths through this project:
Use Critical Path Analysis to find your Critical Path
Float Determination
In project management, float or slack is the amount of time that a
task in a project network can be delayed without causing a delay to:
• Subsequent tasks (“Free float")
• Project completion date (“Total float")
Float is the amount of time an activity can slip before it causes your
project to be delayed.
For the critical path, each of the activities has a float of zero. If any
of those activities slips, the project will be delayed.
Then you take the next longest path. Subtract its duration from the
duration of the critical path. That's the float for each of the
activities on that path.
You will continue doing the same for each subsequent longest path
until each activities float has been determined.
Critical Path and Float Analysis
The critical path is the sequence of activities with the longest
duration. A delay in any of these activities will result in a delay for
the whole project.
Using the Critical Path Method (CPM)
Determining Float
Activities 2, 3, and 4 are on the critical path so they have a float of
zero.
The next longest path is Activities 1, 3, and 4. Since Activities 3 and
4 are also on the critical path, their float will remain as zero. For
any remaining activities, in this case Activity 1, the float will be the
duration of the critical path minus the duration of this path. 14 - 12
= 2. So Activity 1 has a float of 2.
The next longest path is Activities 2 and 5. Activity 2 is on the
critical path so it will have a float of zero. Activity 5 has a float of 14
- 9, which is 5. So as long as Activity 5 doesn't slip more than 5
days, it won't cause a delay to the project.
Procedure for Finding the Critical Path in a
Network Diagram
The following is the procedure to find the critical path on a network
diagram:
- Draw the network diagram.
- Identify all paths in the network diagram.
- Find the duration of each path.
- The path with the largest duration is the critical path.
Critical Path= A – B – C (Longest 31 Days)
Calculate Early Start (ES) and Early Finish (EF)
To calculate the Early Start and Early Finish dates, we use forward
pass; we will start from the beginning and proceed to the end.
The formula used for calculating Early Start and Early Finish dates:
● Early Start of the activity = (Early Finish of predecessor activity + 1).
- Early Start (ES) for the first activity on any path will be 1, because no
activity can be started before the first day[ (0+1)= 1].
- The start point for any activity or step along the path is the end
point of the predecessor activity on the path plus one.
● Early Finish of the activity = (Activity duration + Early Start of
activity – 1)
Easy to Remember: Start= (+1). Finish= (-1)
Early Start of activity A = 1 (Since this is the first activity of the path)
Early Finish of activity A = ES of activity A + activity duration – 1
= 1 + 10 – 1 = 10
Early Start of activity B = EF of predecessor activity + 1
= 10 +1 = 11
Early Finish of activity B = ES of activity B + activity duration – 1
= 11 + 12 – 1 = 22
Early Start of activity C = EF of predecessor activity + 1
= 22 +1 = 23
Early Finish of activity C = ES of activity C + activity duration – 1
= 23 + 9 – 1 = 31
Early Start and Early Finish Dates for the path Start -> A -> B -> C -> End
Early Start of activity D = 1 (Since this is the first activity of the path)
Early Finish of activity D = 1 + 5 – 1 = 5
Early Start of activity E = EF of predecessor activity + 1
Since the Activity E has two predecessor activities, which one will you select? You will select
the activity with the greater Early Finish date. Early Finish of activity D is 5, and Early Finish of
activity G is 3. (With 2 predecessor activities- Easy to remember: Greater will be for Early start
and Early Finish)
Therefore, we will select the Early Finish of activity D to find the Early Start of activity E.
Early Start of activity E = EF of predecessor activity + 1 = 5 + 1 = 6
Early Finish of activity E = 6 + 7 – 1 = 12
Early Start of activity F = 12 + 1 = 13
Early Finish of activity F = 13 + 6 -1 = 18
Early Start and Early Finish Dates for the path Start -> D -> E -> F -> End
Early Start and Early Finish Dates for the path Start -> G -> H -> I -> End
Early Start of activity G = 1 (Since this is the first activity of the path)
Early Finish of activity G = 1 + 3 – 1 = 3
Early Start of activity H = 3 + 1 = 4
Early Finish of activity H = 4 + 4 – 1 = 7
Early Start of activity I = 7 +1 = 8
Early Finish of activity I = 8 + 6 – 1 = 13
Calculating Late Start (LS) and Late Finish (LF)
We have calculated Early Start and Early Finish dates of all activities.
Now it is time to calculate the Late Start and Late Finish dates.
To calculate the Late Start and Late Finish, we use backward pass; i.e.
we will start from the last activity and move back towards the first
activity.
The formula used for Late Start and Late Finish dates:
● Late Start of Activity = Late Finish of activity – activity duration + 1
● Late Finish of Activity = Late Start of successor activity – 1
Late Finish of the last activity in any path will be the same as the Last
Finish of the last activity on the critical path, because you cannot
continue any activity once the project is completed.
Late Start and Late Finish Dates for the path Start -> A -> B -> C -> End
On a critical path, Early Start, and Early Finish dates will be the same
as Late Start and Late Finish dates.
Late Start and Late Finish Dates for the path Start -> D -> E -> F -> End
Late Finish of activity F = 31 (because you cannot allow any activity to cross the project
completion date)
Late Start of activity F = LF of activity F – activity duration + 1
= 31 – 6 +1 = 26
Late Finish of activity E = LS of successor activity – 1
= LS of activity F – 1
= 26 – 1 = 25
Late Start of Activity E = LF of activity E – activity duration + 1
= 25 – 7 + 1 = 19
If you look at the network diagram, you will notice that activity D has
two successor activities, B and E. So, which activity will you select?
You will select the activity with the earlier (Least) Late Start date.
Here, Late Start of activity B is 11, and Late Start of activity E is 19.
Therefore, you will select activity B which has the earlier Late Start
date.
Hence, Late Finish of activity D = LS of activity B – 1 = 11 – 1 = 10
Late Start of Activity D = LF of activity D – activity duration + 1 = 10 –
5 + 1 = 6
(With 2 successor activities - Easy to remember: Least will be for
Late start and Late Finish)
Late Start and Late Finish Dates for the path Start -> G -> H -> I -> End
Late Finish of activity I = 31 (because you cannot allow any activity to cross the project
completion date)
Late Start of activity I = 31 – 6 + 1 = 26
Late Finish of activity H = 26 – 1 = 25
Late Start of activity H = 25 – 4 + 1 = 22
Late Finish of Activity G = 19 – 1= 18 (we will choose the late start of activity E, not activity
H, because the Late Start of activity E is earlier than the Late Start of activity H)
Late Start of activity G = 18 – 3 + 1 = 16
Project Management Tools and Techniques (PERT- Project Evaluation and Review Technique; CPM- Critical Path Method))
Data Entry Window
Output of the Package
Benefits of the Critical Path Method
- It shows the graphical view of the project.
- It discovers and makes dependencies visible.
- It helps in project planning, scheduling, and controlling.
- It helps in contingency planning.
- It shows the critical path, and identifies critical activities requiring special
attention.
- It helps you assign the float to activities and flexibility to float activities.
- It shows you where you need to take action to bring project back on
track.
- To shorten the planned critical path of a project by:
● Pruning (Trimming and cutting) critical path activities
†● “Fast tracking" (To do more things in the same time in order to finish a job
earlier than normal or planned.)
†● “Crashing the critical path" (Shortening the durations of critical path
activities by adding resources).
Limitations and drawbacks of the Critical Path
Method
Because the critical path method is an optimal planning tool,
it always assumes that all resources are available for the project at
all times.
It does not consider resource dependencies.
There are chances of misusing float or slack.
Less attention on non-critical activities, though sometimes they may
also become critical activities.
Projects based on the critical path often fail to be completed within
the approved time duration.
Project Management Tools and Techniques (PERT- Project Evaluation and Review Technique; CPM- Critical Path Method))
Basis for
Comparison
PERT CPM
Meaning
PERT is a project management
technique, used to manage
uncertain activities of a project.
CPM is a statistical
technique of project
management that
manages well defined
activities of a project.
What is it?
A technique of planning and
control of time.
A method to control
cost and time.
Orientation Event-oriented Activity-oriented
Evolution
Evolved as Research &
Development project
Evolved as Construction
project
Model Probabilistic Model Deterministic Model
Comparison Chart
Basis for Comparison PERT CPM
Focuses on Time Time-cost trade-off
Estimates Three time estimates One time estimate
Appropriate for
High precision time
estimate
Reasonable time
estimate
Management of Unpredictable Activities Predictable activities
Nature of jobs Non-repetitive nature Repetitive nature
Critical and Non-critical
activities
No differentiation Differentiated
Suitable for
Research and
Development Project
Non-research projects
like civil construction,
ship building etc.
KANBAN
‘Kanban’ is Japanese for “visual signal” or “card.” When visually or
through inventory card, it seemed that an item is about to stock-out, a
demand used to be placed, ‘Just-in-Time’ (JIT), which helped to reduce
waste and maximize value.
‘Kanban’ helps harness the power of visual information by using sticky
notes on a whiteboard to create a “picture” of our work. A goal of the
kanban system is to limit the buildup of excess inventory at any point in
production.
Project Management Tools and Techniques (PERT- Project Evaluation and Review Technique; CPM- Critical Path Method))

More Related Content

What's hot (20)

Critical path method
Dushyant Nasit
 
PROJECT SCHEDULE
PROJECT SCHEDULE
Ajeesh Mk
 
Project planning
Project planning
Dipnarayan Thakur
 
CPM AND PERT
CPM AND PERT
SimranGrewal33
 
Project management PPT
Raj Sampat
 
crashing of project
crashing of project
Mir Zafarullah
 
Introduction-to-project-management
Savaş Şakar
 
Project Planning
Project Planning
Srinivasan Rengasamy
 
Project life cycle
Project life cycle
Jennifer Banzon
 
Project Management
Project Management
Titiksha Chaturvedi
 
Critical Path Method: Activities And Events, Float/Slacks
Prasad Thanthratey
 
Network Problem CPM & PERT
Pulchowk Campus
 
Project management techniques
Ragjni Govindaraju
 
Critical Path Method
Mr. Ramesh Nayaka
 
Pert, cpm & gert
Pert, cpm & gert
Pranav Krishna
 
Project management
Project management
Satish Yadavalli
 
Pert Cpm Nis
Pert Cpm Nis
Naveed Salman
 
5 phases of project management
Jared C. Powell
 
Cost benefit analysis
lekshmik
 
Pert cpm
Pert cpm
Jyoti Mamtani
 

Similar to Project Management Tools and Techniques (PERT- Project Evaluation and Review Technique; CPM- Critical Path Method)) (20)

PERT-CPM : PROJECT MANAGEMENT TOOLS
Zulfiquer Ahmed Amin
 
pert and crm examples full class course.pdf
samblazeobaseemo
 
Chapter 3.pptx
Chapter 3.pptx
BetshaTizazu2
 
PERT/CPM
PERT/CPM
Mayuri Bhole
 
Pert and mbo
Pert and mbo
angel90thomas
 
(PROGRAM EVALUATION AND REVIE TECHNIQUE)
hannahpepino1
 
Project management
Project management
Kwesi Kissiedu
 
project management-cpm and pert methods for managers
Naganna Chetty
 
Seminar on pert
Seminar on pert
Santosh Kumari
 
Network analysis cpm module3 ppt
ahsanrabbani
 
Unit v mha project evaluation review technique (pert)
anjalatchi
 
Programme Evaluation and Review Technique
DrAsifMohammad
 
Control techniques
Control techniques
Adnan Shakir
 
Unit IV-Project Management
SSN College of Engineering, Kalavakkam
 
porject management
porject management
BANDJO Chabrel
 
Project management. Module 4 ktu sem 6.pptx
GraceMariaGeorge
 
project managment lesson mechanical engineering
ahmedtce2122284
 
EMGT5220 C8uhuuhuhuuuuuuuhuhuhuhuh-6.ppt
NayanaMN8
 
MPA/BPA/TU-Project managemen PERT VS CPM
PadamNepal1
 
06 pert cpm
06 pert cpm
Nitin Kapoor
 
PERT-CPM : PROJECT MANAGEMENT TOOLS
Zulfiquer Ahmed Amin
 
pert and crm examples full class course.pdf
samblazeobaseemo
 
(PROGRAM EVALUATION AND REVIE TECHNIQUE)
hannahpepino1
 
project management-cpm and pert methods for managers
Naganna Chetty
 
Network analysis cpm module3 ppt
ahsanrabbani
 
Unit v mha project evaluation review technique (pert)
anjalatchi
 
Programme Evaluation and Review Technique
DrAsifMohammad
 
Control techniques
Control techniques
Adnan Shakir
 
Project management. Module 4 ktu sem 6.pptx
GraceMariaGeorge
 
project managment lesson mechanical engineering
ahmedtce2122284
 
EMGT5220 C8uhuuhuhuuuuuuuhuhuhuhuh-6.ppt
NayanaMN8
 
MPA/BPA/TU-Project managemen PERT VS CPM
PadamNepal1
 
Ad

More from Zulfiquer Ahmed Amin (20)

Grievance and Conflict Management at Workplacex
Zulfiquer Ahmed Amin
 
Corruption in Health Sector - Causes and Consequences.pptx
Zulfiquer Ahmed Amin
 
Fundamentals of Clinical Governance.pptx
Zulfiquer Ahmed Amin
 
Fundamental Psychological Basics of Leadership.pptx
Zulfiquer Ahmed Amin
 
Leadership Style - Fundamentals and Concepts.pptx
Zulfiquer Ahmed Amin
 
Leadership Theories - Fundamentals and Concepts.pptx
Zulfiquer Ahmed Amin
 
Fundamentals of Leadership and Its Concepts.pptx
Zulfiquer Ahmed Amin
 
Understanding Leadership and Governance.pptx
Zulfiquer Ahmed Amin
 
Remedial Measures Against Health Sector Corruption
Zulfiquer Ahmed Amin
 
Leadership Theory - An Introduction.pptx
Zulfiquer Ahmed Amin
 
Health Insurance - To ensure Accessibility and Equity in Healthcare Services....
Zulfiquer Ahmed Amin
 
Economic Evaluation in Health Economics.pptx
Zulfiquer Ahmed Amin
 
Healthcare Financing- Context of Bangladesh.pptx
Zulfiquer Ahmed Amin
 
Leadership- Introduction and Concepts.pptx
Zulfiquer Ahmed Amin
 
Leadership and Governance- Introduction.pptx
Zulfiquer Ahmed Amin
 
Leadership and Governance in Healthcare-Introduction.pptx
Zulfiquer Ahmed Amin
 
Healthcare Outcome Measurement - Health Economics.pptx
Zulfiquer Ahmed Amin
 
Healthcare Market - Health Economicspptx
Zulfiquer Ahmed Amin
 
Supply of Healthcare - Health Economics.pptx
Zulfiquer Ahmed Amin
 
Demand for Healthcare and Suppliers' Induced Demand (SID).pptx
Zulfiquer Ahmed Amin
 
Ad

Recently uploaded (20)

Basic English for Communication - Dr Hj Euis Eti Rohaeti Mpd
Restu Bias Primandhika
 
SPENT QUIZ NQL JR FEST 5.0 BY SOURAV.pptx
Sourav Kr Podder
 
Exploring Ocean Floor Features for Middle School
Marie
 
Overview of Employee in Odoo 18 - Odoo Slides
Celine George
 
GEOGRAPHY-Study Material [ Class 10th] .pdf
SHERAZ AHMAD LONE
 
PEST OF WHEAT SORGHUM BAJRA and MINOR MILLETS.pptx
Arshad Shaikh
 
How to Configure Vendor Management in Lunch App of Odoo 18
Celine George
 
Black and White Illustrative Group Project Presentation.pdf (1).pdf
AnnasofiaUrsini
 
Ray Dalio How Countries go Broke the Big Cycle
Dadang Solihin
 
Webcrawler_Mule_AIChain_MuleSoft_Meetup_Hyderabad
Veera Pallapu
 
ABCs of Bookkeeping for Nonprofits TechSoup.pdf
TechSoup
 
Paper 109 | Archetypal Journeys in ‘Interstellar’: Exploring Universal Themes...
Rajdeep Bavaliya
 
Sustainable Innovation with Immersive Learning
Leonel Morgado
 
Allomorps and word formation.pptx - Google Slides.pdf
Abha Pandey
 
MATERI PPT TOPIK 4 LANDASAN FILOSOFIS PENDIDIKAN
aditya23173
 
THERAPEUTIC COMMUNICATION included definition, characteristics, nurse patient...
parmarjuli1412
 
Rai dyansty Chach or Brahamn dynasty, History of Dahir History of Sindh NEP.pptx
Dr. Ravi Shankar Arya Mahila P. G. College, Banaras Hindu University, Varanasi, India.
 
LDMMIA Free Reiki Yoga S9 Grad Level Intuition II
LDM & Mia eStudios
 
How to Manage Multi Language for Invoice in Odoo 18
Celine George
 
Publishing Your Memoir with Brooke Warner
Brooke Warner
 
Basic English for Communication - Dr Hj Euis Eti Rohaeti Mpd
Restu Bias Primandhika
 
SPENT QUIZ NQL JR FEST 5.0 BY SOURAV.pptx
Sourav Kr Podder
 
Exploring Ocean Floor Features for Middle School
Marie
 
Overview of Employee in Odoo 18 - Odoo Slides
Celine George
 
GEOGRAPHY-Study Material [ Class 10th] .pdf
SHERAZ AHMAD LONE
 
PEST OF WHEAT SORGHUM BAJRA and MINOR MILLETS.pptx
Arshad Shaikh
 
How to Configure Vendor Management in Lunch App of Odoo 18
Celine George
 
Black and White Illustrative Group Project Presentation.pdf (1).pdf
AnnasofiaUrsini
 
Ray Dalio How Countries go Broke the Big Cycle
Dadang Solihin
 
Webcrawler_Mule_AIChain_MuleSoft_Meetup_Hyderabad
Veera Pallapu
 
ABCs of Bookkeeping for Nonprofits TechSoup.pdf
TechSoup
 
Paper 109 | Archetypal Journeys in ‘Interstellar’: Exploring Universal Themes...
Rajdeep Bavaliya
 
Sustainable Innovation with Immersive Learning
Leonel Morgado
 
Allomorps and word formation.pptx - Google Slides.pdf
Abha Pandey
 
MATERI PPT TOPIK 4 LANDASAN FILOSOFIS PENDIDIKAN
aditya23173
 
THERAPEUTIC COMMUNICATION included definition, characteristics, nurse patient...
parmarjuli1412
 
LDMMIA Free Reiki Yoga S9 Grad Level Intuition II
LDM & Mia eStudios
 
How to Manage Multi Language for Invoice in Odoo 18
Celine George
 
Publishing Your Memoir with Brooke Warner
Brooke Warner
 

Project Management Tools and Techniques (PERT- Project Evaluation and Review Technique; CPM- Critical Path Method))

  • 1. Colonel Zulfiquer Ahmed Amin M Phil, MPH, PGD (Health Economics), MBBS Armed Forces Medical Institute (AFMI)
  • 2. Project Management? Project management is the application of processes, methods, knowledge, skills and experience to achieve the project objectives. A key factor that distinguishes project management from just 'management' is that it has this final deliverable and a finite timespan, unlike management which is usually an ongoing process. Because of this a project professional needs a wide range of skills; often technical skills, and certainly people management skills and good business awareness.
  • 3. Project management is the practice of initiating, planning, executing, controlling, and closing the work of a team to achieve specific goals and meet specific success criteria at the specified time. A project is a temporary endeavor designed to produce a unique product, service or result with a defined beginning and end (usually time-constrained, and often constrained by funding or staffing) undertaken to meet unique goals and objectives, typically to bring about beneficial change or added value. The temporary nature of projects stands in contrast with business as usual (or operations), which are repetitive, permanent, or semi-permanent functional activities to produce products or services.
  • 4. A project is unique in that it is not a routine operation, but a specific set of operations designed to accomplish a singular goal. So a project team often includes people who don’t usually work together – sometimes from different organizations and across multiple geographies. And all must be expertly managed to deliver the right quality, on- time, on-budget results.
  • 5. Scope of a Project
  • 6. Program A project is a singular effort of defined duration, whereas a program is comprised of a collection of projects.
  • 7. Project Project is defined as “A temporary organization that is created for the purpose of delivering one or more business products according to a specified Business Case”. Program Program is defined as “A group of related projects managed in a coordinated way to obtain benefits and control not available from managing them individually”.
  • 8. Project management is a challenging task with many complex responsibilities. Fortunately, there are many tools available to assist with accomplishing the tasks and executing the responsibilities. Some require a computer with supporting software, while others can be used manually. Project managers should choose a project management tool that best suits their management style. No one tool addresses all project management needs. Project management tools and techniques are precisely what make managing projects easier and more effective. Planning tools and techniques in management include CPM, PERT, KANBAN, SWOT Analysis and the Gantt-chat etc.
  • 9. PERT The Project Evaluation and Review Technique, commonly abbreviated PERT, is a statistical tool, used in project management. It was developed for the U.S. Navy Special Projects Office in 1957 to support the U.S. Navy's Polaris nuclear submarine project. An early example was, it was used for the 1968 Winter Olympics in Grenoble which applied PERT from 1965 until the opening of the 1968 Games.
  • 11. It is used more in projects where time is the major factor rather than cost. It is applied to very large-scale, one-time, complex, non-routine infrastructure and Research and Development projects. PERT and CPM are complementary tools, because "CPM employs one time estimate and one cost estimate for each activity; PERT may utilize three time estimates (optimistic, expected, and pessimistic) and no costs for each activity.
  • 12. A PERT network chart for a seven-month project with five milestones (Nodes: 10 through 50) and six activities (Arrows: A through F)
  • 15. Steps in PERT PERT planning involves the following steps: 1. Identify the specific activities and milestones. 2. Determine the proper sequence of the activities. 3. Construct a network diagram. 4. Estimate the time required for each activity. 5. Determine the critical path. 6. Update the PERT chart as the project progresses.
  • 16. 1. Identify the specific activities and milestones. The activities are the tasks required to complete a project. The milestones are the events marking the beginning and the end of one or more activities. 2. Determine the proper sequence of the activities. This step may be combined with the activity identification step since the activity sequence is evident for some tasks. Other tasks may require more analysis to determine the exact order in which they must be performed. 3. Construct a network diagram. Using the activity sequence information, a network diagram can be drawn showing the sequence of the serial and parallel activities. Software packages simplify this step by automatically converting tabular activity information into a network diagram.
  • 17. Example In the following example there are seven tasks, labeled A through G. Some tasks can be done concurrently (A and B) while others cannot be done until their predecessor task is complete (C cannot begin until A is complete). Additionally, each task has three time estimates: the optimistic time estimate (o), the most likely or normal time estimate (m), and the pessimistic time estimate (p). The expected time (te) is computed using the formula (o + 4m + p) ÷ 6.
  • 18. Activity Predecessor Time estimates Expected time te = (o + 4m + p) ÷ 6 Opt. (o) Normal (m) Pess. (p) A — 2 4 6 4.00 B — 3 5 9 5.33 C A 4 5 7 5.17 D A 4 6 10 6.33 E B, C 4 5 7 5.17 F D 3 4 8 4.50 G E 3 5 8 5.17
  • 19. 4. Estimate the time required for each activity. Weeks are a commonly used unit of time for activity completion, but any consistent unit of time can be used. A distinguishing feature of PERT is its ability to deal with uncertainty in activity completion time. 5. Determine the critical path. The critical path is determined by adding the times for the activities in each sequence and determining the longest path in the project. The critical path determines the total calendar time required for the project. If activities outside the critical path speed up or slow down (within limits), the total project time does not change. 6. Update the PERT chart as the project progresses. Make adjustments in the PERT chart as the project progresses. As the project unfolds, the estimated times can be replaced with actual times. In cases where there are delays, additional resources may be needed to stay on schedule and the PERT chart may be modified to reflect the new situation.
  • 20. Time PERT has defined four types of time required to accomplish an activity: optimistic time: the minimum possible time required to accomplish an activity (o) or a path (O), assuming everything proceeds better than is normally expected pessimistic time: the maximum possible time required to accomplish an activity (p) or a path (P), assuming everything goes wrong (but excluding major catastrophes). most likely time: the best estimate of the time required to accomplish an activity (m) or a path (M), assuming everything proceeds as normal. expected time: the best estimate of the time required to accomplish an activity (te) or a path (TE), accounting for the fact that things don't always proceed as normal (the implication being that the expected time is the average time the task would require if the task were repeated on a number of occasions over an extended period of time. te = (o + 4m + p) ÷ 6
  • 22. The time estimates managers provide for the various activities comprising a project involve different degrees of certainty. When time estimates can be made with a high degree of certainty, they are called deterministic estimates. When they are subject to variation, they are called probabilistic estimates. In using the probabilistic approach, managers provide three estimates for each activity: an optimistic or best case estimate; a pessimistic or worst case estimate; and the most likely estimate.
  • 23. Management tools PERT supplies a number of tools for management with determination of concepts, such as: float or slack is a measure of the excess time and resources available to complete a task. It is the amount of time that a project task can be delayed without causing a delay in any subsequent tasks (free float) or the whole project (total float). Positive slack would indicate ahead of schedule; negative slack would indicate behind schedule; and zero slack would indicate on schedule. critical path: the longest possible continuous pathway taken from the initial event to the terminal event. It determines the total calendar time required for the project; and, therefore, any time delays along the critical path will delay the reaching of the terminal event by at least the same amount.
  • 24. critical activity: An activity that has total float equal to zero. An activity with zero float is not necessarily on the critical path since its path may not be the longest. Fast tracking – A schedule compression technique in which activities or phases normally done in sequence are performed in parallel for at least a portion of their duration. To do more things in the same time in order to finish a job earlier than normal or planned.
  • 25. Crashing: A technique used to shorten the schedule duration for the least incremental cost by adding resources. Shortening the durations of critical path activities by adding resources. Additional resources doesn’t only mean additional number of heads but it can be any of below: - Approving overtime - Paying extra - Adding more resources
  • 26. Lead Time When the first activity is still running and second activity starts, this is called Lead. The balance of time for the first activity is known as Lead Time. Lead Time is the overlap between the first and second activity. For example, let us say that the time duration for the first activity is 20 days, and for the second activity it is 15 days. As the first activity completes its first 15 days, you start working on the second activity. (Please note that the first activity still has 5 days to finish itself completely.)
  • 27. Lag Time When the first activity completes, if there is then a delay or wait period before the second activity starts, this is called lag and the delay is known as the Lag Time. Lag Time is the delay between the first and second activity. For example, the time duration for the first activity is 3 days, and for the second activity it is 2 days. After completing the first activity you wait for one day, and then you start the second activity. (Please note that here you start second activity after one day of completing the first activity.) In this case, we say that Lag Time is one day, or Finish to Start activity with one day delay or lag.
  • 28. NETWORK DIAGRAMS The chief feature of PERT analysis is a network diagram that provides a visual depiction of the major project activities and the sequence in which they must be completed. Activities are defined as distinct steps toward completion of the project that consume either time or resources. The network diagram consists of arrows and nodes. For each activity, managers provide an estimate of the time required to complete it.
  • 29. The sequence of activities leading from the starting point of the diagram to the finishing point of the diagram is called a path. The amount of time required to complete the work involved in any path can be figured by adding up the estimated times of all activities along that path. The path with the longest total time is then called the "critical path". The critical path is the most important part of the diagram for managers: it determines the completion date of the project. Delays in completing activities along the critical path necessitate an extension of the final deadline for the project. If a manager hopes to shorten the time required to complete the project, he or she must focus on finding ways to reduce the time involved in activities along the critical path.
  • 30. PERT ANALYSIS Managers can obtain a great deal of information by analyzing network diagrams of projects. For example, network diagrams show the sequence of activities involved in a project. From this sequence, managers can determine which activities must take place before others can begin, and which can occur independently of one another. Managers can also gain valuable insight by examining paths other than the critical path. Since these paths require less time to complete, they can often accommodate slippage without affecting the project completion time.
  • 31. Slack versus Float The difference between the length of a given path and the length of the critical path is known as slack. Knowing where slack is located helps managers to prioritize allocation of scarce resources and direct their efforts to control activities. The terms "slack" and "float" are often used interchangeably. However, the essential difference between the terms is that slack is typically associated with inactivity, while float is associated with activity. Slack time allows an activity to start later than originally planned, while float time allows an activity to take longer than originally planned.
  • 33. Advantages of PERT - PERT (Program Evaluation and Review Technique) compels managers to plan, which helps them see how the pieces fit together. Each subordinate manger has to plan the events for which her or she is responsible. - It concentrates on critical elements that may need correction. - It makes possible a kind of forward-looking control. - The network system with its subsystems enables managers to aim reports and pressure for action at the right spot and level in the organization structure at the right time.
  • 34. Disadvantages of PERT - Because of its emphasis on “activity-time” to its operation, PERT is not useful when no reasonable estimates of time schedule can be made. - Another disadvantage has been its emphasis on time only but not on costs.
  • 35. Critical Path Method (CPM) The critical path method (CPM) is a step-by-step project management technique for process planning that defines critical and non-critical tasks with the goal of preventing time-frame problems and process bottlenecks. The CPM is ideally suited to projects consisting of numerous activities that interact in a complex manner.
  • 36. Critical path project management (CPM) technique is used to complete projects on time by focusing on key tasks. By focusing on the tasks that make up the critical path, the project manager maximizes the chances of completing the project on time. The critical path can be defined in many ways including: - The longest path in the network diagram, or - The shortest duration in which the project can be completed.
  • 37. History The critical path method (CPM) is a project modeling technique developed in the late 1950s by DuPont, and was first used in missile- defense construction projects of US Navy. Critical Path Analysis is commonly used with all forms of projects, including construction, aerospace and defense, software development, research projects, product development, engineering, and plant maintenance, among others. Any project with interdependent activities can apply this method of mathematical analysis. The first time CPM was used for major skyscraper development was in 1966 while constructing the former World Trade Center Twin Towers in New York City.
  • 38. Components The essential technique for using CPM: is to construct a model of the project that includes the following: 1. A list of all activities required to complete the project (typically categorized within a work breakdown structure), 2. The time (duration) that each activity will take to complete, 3. The dependencies between the activities and, 4. Logical end points such as milestones or deliverable items.
  • 41. The duration of each activity is listed above each node in the diagram. For each path, add the duration of each node to determine it's total duration. The critical path is the one with the longest duration. There are three paths through this project: Use Critical Path Analysis to find your Critical Path
  • 42. Float Determination In project management, float or slack is the amount of time that a task in a project network can be delayed without causing a delay to: • Subsequent tasks (“Free float") • Project completion date (“Total float") Float is the amount of time an activity can slip before it causes your project to be delayed. For the critical path, each of the activities has a float of zero. If any of those activities slips, the project will be delayed. Then you take the next longest path. Subtract its duration from the duration of the critical path. That's the float for each of the activities on that path. You will continue doing the same for each subsequent longest path until each activities float has been determined.
  • 43. Critical Path and Float Analysis The critical path is the sequence of activities with the longest duration. A delay in any of these activities will result in a delay for the whole project. Using the Critical Path Method (CPM)
  • 45. Activities 2, 3, and 4 are on the critical path so they have a float of zero. The next longest path is Activities 1, 3, and 4. Since Activities 3 and 4 are also on the critical path, their float will remain as zero. For any remaining activities, in this case Activity 1, the float will be the duration of the critical path minus the duration of this path. 14 - 12 = 2. So Activity 1 has a float of 2. The next longest path is Activities 2 and 5. Activity 2 is on the critical path so it will have a float of zero. Activity 5 has a float of 14 - 9, which is 5. So as long as Activity 5 doesn't slip more than 5 days, it won't cause a delay to the project.
  • 46. Procedure for Finding the Critical Path in a Network Diagram The following is the procedure to find the critical path on a network diagram: - Draw the network diagram. - Identify all paths in the network diagram. - Find the duration of each path. - The path with the largest duration is the critical path.
  • 47. Critical Path= A – B – C (Longest 31 Days)
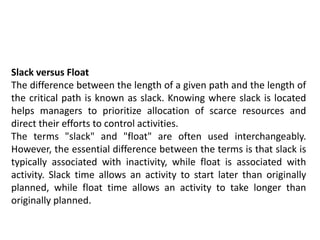
  • 48. Calculate Early Start (ES) and Early Finish (EF) To calculate the Early Start and Early Finish dates, we use forward pass; we will start from the beginning and proceed to the end. The formula used for calculating Early Start and Early Finish dates: ● Early Start of the activity = (Early Finish of predecessor activity + 1). - Early Start (ES) for the first activity on any path will be 1, because no activity can be started before the first day[ (0+1)= 1]. - The start point for any activity or step along the path is the end point of the predecessor activity on the path plus one. ● Early Finish of the activity = (Activity duration + Early Start of activity – 1) Easy to Remember: Start= (+1). Finish= (-1)
  • 49. Early Start of activity A = 1 (Since this is the first activity of the path) Early Finish of activity A = ES of activity A + activity duration – 1 = 1 + 10 – 1 = 10 Early Start of activity B = EF of predecessor activity + 1 = 10 +1 = 11 Early Finish of activity B = ES of activity B + activity duration – 1 = 11 + 12 – 1 = 22 Early Start of activity C = EF of predecessor activity + 1 = 22 +1 = 23 Early Finish of activity C = ES of activity C + activity duration – 1 = 23 + 9 – 1 = 31 Early Start and Early Finish Dates for the path Start -> A -> B -> C -> End
  • 50. Early Start of activity D = 1 (Since this is the first activity of the path) Early Finish of activity D = 1 + 5 – 1 = 5 Early Start of activity E = EF of predecessor activity + 1 Since the Activity E has two predecessor activities, which one will you select? You will select the activity with the greater Early Finish date. Early Finish of activity D is 5, and Early Finish of activity G is 3. (With 2 predecessor activities- Easy to remember: Greater will be for Early start and Early Finish) Therefore, we will select the Early Finish of activity D to find the Early Start of activity E. Early Start of activity E = EF of predecessor activity + 1 = 5 + 1 = 6 Early Finish of activity E = 6 + 7 – 1 = 12 Early Start of activity F = 12 + 1 = 13 Early Finish of activity F = 13 + 6 -1 = 18 Early Start and Early Finish Dates for the path Start -> D -> E -> F -> End
  • 51. Early Start and Early Finish Dates for the path Start -> G -> H -> I -> End Early Start of activity G = 1 (Since this is the first activity of the path) Early Finish of activity G = 1 + 3 – 1 = 3 Early Start of activity H = 3 + 1 = 4 Early Finish of activity H = 4 + 4 – 1 = 7 Early Start of activity I = 7 +1 = 8 Early Finish of activity I = 8 + 6 – 1 = 13
  • 52. Calculating Late Start (LS) and Late Finish (LF) We have calculated Early Start and Early Finish dates of all activities. Now it is time to calculate the Late Start and Late Finish dates. To calculate the Late Start and Late Finish, we use backward pass; i.e. we will start from the last activity and move back towards the first activity. The formula used for Late Start and Late Finish dates: ● Late Start of Activity = Late Finish of activity – activity duration + 1 ● Late Finish of Activity = Late Start of successor activity – 1 Late Finish of the last activity in any path will be the same as the Last Finish of the last activity on the critical path, because you cannot continue any activity once the project is completed.
  • 53. Late Start and Late Finish Dates for the path Start -> A -> B -> C -> End On a critical path, Early Start, and Early Finish dates will be the same as Late Start and Late Finish dates.
  • 54. Late Start and Late Finish Dates for the path Start -> D -> E -> F -> End Late Finish of activity F = 31 (because you cannot allow any activity to cross the project completion date) Late Start of activity F = LF of activity F – activity duration + 1 = 31 – 6 +1 = 26 Late Finish of activity E = LS of successor activity – 1 = LS of activity F – 1 = 26 – 1 = 25 Late Start of Activity E = LF of activity E – activity duration + 1 = 25 – 7 + 1 = 19
  • 55. If you look at the network diagram, you will notice that activity D has two successor activities, B and E. So, which activity will you select? You will select the activity with the earlier (Least) Late Start date. Here, Late Start of activity B is 11, and Late Start of activity E is 19. Therefore, you will select activity B which has the earlier Late Start date. Hence, Late Finish of activity D = LS of activity B – 1 = 11 – 1 = 10 Late Start of Activity D = LF of activity D – activity duration + 1 = 10 – 5 + 1 = 6 (With 2 successor activities - Easy to remember: Least will be for Late start and Late Finish)
  • 56. Late Start and Late Finish Dates for the path Start -> G -> H -> I -> End Late Finish of activity I = 31 (because you cannot allow any activity to cross the project completion date) Late Start of activity I = 31 – 6 + 1 = 26 Late Finish of activity H = 26 – 1 = 25 Late Start of activity H = 25 – 4 + 1 = 22 Late Finish of Activity G = 19 – 1= 18 (we will choose the late start of activity E, not activity H, because the Late Start of activity E is earlier than the Late Start of activity H) Late Start of activity G = 18 – 3 + 1 = 16
  • 59. Output of the Package
  • 60. Benefits of the Critical Path Method - It shows the graphical view of the project. - It discovers and makes dependencies visible. - It helps in project planning, scheduling, and controlling. - It helps in contingency planning. - It shows the critical path, and identifies critical activities requiring special attention. - It helps you assign the float to activities and flexibility to float activities. - It shows you where you need to take action to bring project back on track. - To shorten the planned critical path of a project by: ● Pruning (Trimming and cutting) critical path activities †● “Fast tracking" (To do more things in the same time in order to finish a job earlier than normal or planned.) †● “Crashing the critical path" (Shortening the durations of critical path activities by adding resources).
  • 61. Limitations and drawbacks of the Critical Path Method Because the critical path method is an optimal planning tool, it always assumes that all resources are available for the project at all times. It does not consider resource dependencies. There are chances of misusing float or slack. Less attention on non-critical activities, though sometimes they may also become critical activities. Projects based on the critical path often fail to be completed within the approved time duration.
  • 64. Basis for Comparison PERT CPM Meaning PERT is a project management technique, used to manage uncertain activities of a project. CPM is a statistical technique of project management that manages well defined activities of a project. What is it? A technique of planning and control of time. A method to control cost and time. Orientation Event-oriented Activity-oriented Evolution Evolved as Research & Development project Evolved as Construction project Model Probabilistic Model Deterministic Model Comparison Chart
  • 65. Basis for Comparison PERT CPM Focuses on Time Time-cost trade-off Estimates Three time estimates One time estimate Appropriate for High precision time estimate Reasonable time estimate Management of Unpredictable Activities Predictable activities Nature of jobs Non-repetitive nature Repetitive nature Critical and Non-critical activities No differentiation Differentiated Suitable for Research and Development Project Non-research projects like civil construction, ship building etc.
  • 66. KANBAN ‘Kanban’ is Japanese for “visual signal” or “card.” When visually or through inventory card, it seemed that an item is about to stock-out, a demand used to be placed, ‘Just-in-Time’ (JIT), which helped to reduce waste and maximize value. ‘Kanban’ helps harness the power of visual information by using sticky notes on a whiteboard to create a “picture” of our work. A goal of the kanban system is to limit the buildup of excess inventory at any point in production.