SlideShare a Scribd company logo
Workshop Overview 
• Module 1: Data 
• Module 2: Model and Estimation 
• Module 3: Sample Output and Empirical Generalization
Outline 
• Ideal Data for Promotion/Pricing Analytics: Scanner 
Data (in CPG) 
• Data and Inference: What Can Go Wrong? 
• Challenges and Common Mistakes in Consumer 
Electronics 
• Data Requirement and Potential Data Source
Scanner Data (Store Audit Data) 
How is Data Collected? 
• Syndicated data providers: IRI and A.C. Nielsen 
• Sample of stores (Grocery, Drug, Convenience, Mass 
Merchandiser, Warehouse stores) 
• Scanner data 
– UPC info (product features), (Retail) price, Quantity (Volume) 
all recorded 
• Features 
– Centrally collected and coded (daily) 
• Displays 
– Collected by store auditors (1X/week)
4 Data Dimensions 
• The Data Cube 
– Geography (Market) x Product x Time x Variable (Measure) 
– G x P x T x V > 1,000,000 even for one category 
• Aggregation (chain/regions, SKU groups, temporal)
Scanner Data: Advantages 
• Completeness 
– Linking aggregate sales movements to marketing instruments 
(price, feature, display, etc) 
– Obtaining a richer set of performance measures beyond market 
share and factory shipments 
• Timeliness 
– Getting the data within a window that allows for meaningful 
managerial action (i.e. less than old lag time of 8 weeks or 
more) 
• Accuracy
Scanner Data: Limitations 
• Not a complete sampling frame: excluded stores 
– Small shops, Walmart! 
• Hard to make causal statements without careful modeling: non-random 
assignment 
• No information on consumer behaviors before purchases (e.g. 
search, consideration) and consumption after purchases 
• No information on psychographics
Promotion Analytics from Scanner Data 
5 % 
Week 
8 % 
4.5 % 
4.8 % 
1 2 3 4 5 6 7 
8 
Promotion Week 
Purchase 
Deceleration 
Purchase 
Acceleration 
Net Effect = (8 - 5) - .2 - .5 = 2.3% 
• A simplistic picture
Promotions: Actual data 
5 10 15 20 25 30 
Week 
1 
0.8 
0.6 
0.4 
0.2 
Market Share 
1 
0.75 
0.5 
0.25 
Price 
F 
D 
C 
F 
D 
C 
F 
D 
F 
D 
C 
F 
D 
C 
F 
D 
F 
D 
F = Feature, D = Display, C = Store Coupon
Promotion Types 
(End of Aisle) 
Display 
Feature 
Price-cut 
(BOGO) 
Coupon
1. Size of Data Information in Data 
• Consider the following two options: 
(1) Wal-Mart with 4,000 stores, 52 weeks of data, 500 SKUs (104 million observations!) 
(2) Best-buy with 1,500 stores, 52 weeks of data, 500 SKUs (39 million observations) 
• Which dataset would be more useful to measure price responses? 
25 
20 
15 
10 
5 
0 
Wal-Mart (EDLP) 
1 3 5 7 9 11 13 15 17 19 21 23 25 27 29 31 33 35 37 39 41 43 45 47 49 51 
P1 P2 P3 
25 
20 
15 
10 
5 
0 
Best-Buy (Hi-Lo) 
1 3 5 7 9 11 13 15 17 19 21 23 25 27 29 31 33 35 37 39 41 43 45 47 49 51 
P1 P2 P3
2. Pay Attention to Signal-to-Noise Ratio 
• Consider the following measurement. Is there significant impact from marketing event? 
Revenue Before Event After Event % Change 
Average 10 13 30 
• Well, it depends on signal-to-noise ratio! 
16 
14 
12 
10 
8 
6 
4 
2 
0 
Revenue before/after Event 
0 20 40 60 80 100 120 
120 
100 
80 
60 
40 
20 
0 
Revenue before/after event 
0 20 40 60 80 100 120
3. Careful about Reverse Causality 
• Imagine the following data generating process. 
– 푆푎푙푒푠푚,푡 = 퐼푛푡푒푟푐푒푝푡푚 + 0 ∙ 퐴푑푣푚,푡 + 휀푚,푡 
– 퐴푑푚,푡 = 0.1 ∙ 푆푎푙푒푠푚,푡−1 + 휔푚,푡 
• If you do analysis ignoring the reverse causality, you may conclude the following. 
60 
50 
40 
30 
20 
10 
0 
Sales (m,t) vs. Adv (m,t) 
0 1 2 3 4 5 6 
Sales (m,t) 
Adv (m,t) 
Coefficients Standard Error P-value 
Intercept -3.357941562 1.121241507 0.004875 
Advertising (t) 9.716546286 0.354635984 3.58E-26 
Significant impact of advertising? 
R square: 0.95 -> Good fit!
4. Omitted Variables Can Be Dangerous 
• Oftentimes, we don’t have data on some important variables, which can impact sales, 
revenue, or profits. 
– Doing analytics ignoring these “omitted variables” can lead to “biased” estimates of 
marketing mix effects. 
• Think about the graph below (from NYT). Is the family income really responsible for better 
academic achievement? What would be potential omitted variable bias here?
5. Selection by Outcome: Bad Idea! 
• Problem: Often times, two groups, which are conditioned by outcome variables, are 
compared to infer the causal impact of marketing mix 
• Example 
– To calculate the ROI of paid search campaign, advertisers compare the “conversion 
rates” of each “search” keyword. Usually, branded keywords are shown to have high 
conversion rates (> 6%) compared to generic keywords (~ 1%). 
• How to fix the problems? 
– Use proper “control” condition! 
– In the paid search example, all the traffics/conversions from consumers who click on 
branded keywords are attributed to the resulting sales and profit. An implicit 
assumption here is that all the sales/profits are lost without paid search. Really? 
– It’s possible that consumers who use branded keywords are already quite committed to 
purchase, and they may simply substitute to unpaid (organic) search links if paid 
searches are turned off. 
– A proper control in this case is “halting selected search engine marketing keywords”
Key Challenges 
• There are no syndicated data providers such as IRI and Nielsen in Consumer 
Electronics 
• Slightly better situation in North America or Europe 
– NPD (U.S.), GfK (Europe) provides market (or retail channel) level unit sales 
and price data by SKUs 
– However, they do not provide promotion details 
– Even with promotion data, the use of market (or channel) level data can cause 
aggregation bias (i.e. overestimation of promotion effects) 
• You have to assemble multiple datasets on your own 
– At least 2 ~ 3 datasets need to be merged 
– SKU-level unit sales data from ERP + External tracking service data (on price 
and promotion): half-blind (no sales info for competitors) 
– Better data access if you are a category captain 
– Most painful and time-consuming step: organizational silo
Common Mistakes: For Discussion 
• Use factory shipment data instead of retail sales data 
– Biased promotion effect estimates due to forward buying from retailers 
• Use cross-sectional data to measure price/promotion effects 
– Biased price or promotion effect estimates due to omitted variable bias 
– Better to use panel data and identify effects from within-store (or within chain) variation 
• Use market (or channel) level data 
– Promotion effects are not homogeneous within a market (or channel) 
– Due to aggregation bias, promotion effects will be overstated 
– Better to use store, account, or chain-level data where promotion activities do not vary 
across units 
• Use data with short history (1 year or less) 
– At least, 2 ~ 3 years of data are required to properly measure seasonality 
• Ignore price changes and promotion from competitors 
– Biased estimates of baseline sales and price/promotion effects
Consumer Sales vs. Factory Shipments 
100,000 
80,000 
60,000 
40,000 
20,000 
Promotion 
Shipment 
Retail sales 
1978 1979 1980 1981 1982
Data Requirement 
• Key elements of data 
– Unit sales by SKUs (outcome): ideally for the entire category (including competitors), but 
feasible only with data for focal company‘s own SKUs 
– Price measures by SKU(causal): focal company + competitors 
– Promotion measures by SKU/product line/brand (causal): focal company + competitors 
• Duration 
– Ideally 3 years (of weekly data); At least 2 years of data 
– To properly control seasonality 
• Level of aggregation 
– Ideally store-level data; chain or account (chain-market combination) data can be used 
as long as promotion/price policies are uniform (within chain or account) 
– Using market or channel-level data can cause overstating of promotion effects due to 
aggregation bias 
• Type of response data: Retail sales data (Do not use factory shipment data) 
– Due to forward buying from retailers
Potential Data Source: For Discussion 
• Key elements of data 
– Unit sales by SKUs (outcome) 
– Price measures by SKU(causal) 
– Promotion measures by SKU/product line/brand (causal)

More Related Content

What's hot (20)

PPT
The marketing game2
Anand Sarsambi
 
PPT
Pricing Understanding and Capturing Customer Value - Marketing
FaHaD .H. NooR
 
PPTX
Retail Pricing 1
Holostik India Ltd.
 
PPTX
How should a company set prices initially for products or services?
Vaishnavi Ketharnathan
 
PPTX
Lecture9 conjoint analysis
Jameson Watts
 
PDF
Retail analytics - Improvising pricing strategy using markup/markdown
Smitha Mysore Lokesh
 
PPTX
Business Marketing VTU,Module 6
Galgotias University
 
PPT
Pricing As A Strategic Marketing Tool
Thomas (Tom) Smith, III
 
PPTX
Pricing - Marketing(783) CBSE Class 12
Lovell Menezes
 
PPT
Conjoint Analysis
cclayne21
 
PPT
Retail pricing
Tribhuvan University
 
PPTX
conjoint analysis
Karan Bhandari
 
PPTX
Williamson trade off model
Pratima Patil
 
PPT
Pricing
amitgurus
 
PPT
V49 gerardjoelabonadopricingchapter14questions
Gerard Joel Abonado, MD, MBAH
 
PDF
Retail pricing
Tribhuvan University
 
PPTX
Statistics applied to the interdisciplinary areas of marketing
Carol Hargreaves
 
PPTX
Conjoint analysis advance marketing research
Lal Sivaraj
 
PPTX
IMP
Soumit Biswas
 
PPTX
Intro to Conjoint Analysis and MaxDiff: How JetBlue Learns What Passengers Re...
Qualtrics
 
The marketing game2
Anand Sarsambi
 
Pricing Understanding and Capturing Customer Value - Marketing
FaHaD .H. NooR
 
Retail Pricing 1
Holostik India Ltd.
 
How should a company set prices initially for products or services?
Vaishnavi Ketharnathan
 
Lecture9 conjoint analysis
Jameson Watts
 
Retail analytics - Improvising pricing strategy using markup/markdown
Smitha Mysore Lokesh
 
Business Marketing VTU,Module 6
Galgotias University
 
Pricing As A Strategic Marketing Tool
Thomas (Tom) Smith, III
 
Pricing - Marketing(783) CBSE Class 12
Lovell Menezes
 
Conjoint Analysis
cclayne21
 
Retail pricing
Tribhuvan University
 
conjoint analysis
Karan Bhandari
 
Williamson trade off model
Pratima Patil
 
Pricing
amitgurus
 
V49 gerardjoelabonadopricingchapter14questions
Gerard Joel Abonado, MD, MBAH
 
Retail pricing
Tribhuvan University
 
Statistics applied to the interdisciplinary areas of marketing
Carol Hargreaves
 
Conjoint analysis advance marketing research
Lal Sivaraj
 
Intro to Conjoint Analysis and MaxDiff: How JetBlue Learns What Passengers Re...
Qualtrics
 

Similar to Promotion Analytics in Consumer Electronics - Module 1: Data (20)

PPTX
Is Your Marketing Database "Model Ready"?
Vivastream
 
PPTX
Is Your Marketing Database "Model Ready"?
Vivastream
 
PPTX
Understanding the Lifecycle of a Data Analysis Project
Level Education
 
PPTX
Attribution
Barendra Kumar Bisoyi
 
PDF
Statistical Discovery for Consumer and Marketing Research
JMP software from SAS
 
PPTX
Promotion Analytics - Module 2: Model and Estimation
Minha Hwang
 
PPTX
Data Insight Leaders Summit Barcelona 2017
Harvinder Atwal
 
PDF
Promotional analytics
TrustRobin
 
PDF
Marketing optimization
Anene Wealth
 
PPSX
Data Refinement: The missing link between data collection and decisions
Vivastream
 
PDF
CapstoneProjectPresentation.pdf
VineetGupta76987
 
PPTX
bigmartsalespridictionproject-220813050638-8e9c4c31 (1).pptx
Harshavardhan851231
 
PPT
Intro to mktg_itm_sept-2012_session-2
NANDA KISHORE SETHURAMAN
 
PPTX
Data analytics in retail
tanyazyabkina
 
PDF
Business and Data Analytics Collaborative April Meetup
Ken Tucker
 
PPTX
BIG MART SALES.pptx
LSURYAPRAKASHREDDY
 
PPTX
BIG MART SALES PRIDICTION PROJECT.pptx
LSURYAPRAKASHREDDY
 
PDF
I.liiv gaining shopper_insights_using_market_basket_analysis
ECR Community
 
PDF
Art Halls Data Analytics PowerPoint
Arthur Hall, D.Min.
 
PPTX
Analytics in Functional Areas
GokilavaniS3
 
Is Your Marketing Database "Model Ready"?
Vivastream
 
Is Your Marketing Database "Model Ready"?
Vivastream
 
Understanding the Lifecycle of a Data Analysis Project
Level Education
 
Statistical Discovery for Consumer and Marketing Research
JMP software from SAS
 
Promotion Analytics - Module 2: Model and Estimation
Minha Hwang
 
Data Insight Leaders Summit Barcelona 2017
Harvinder Atwal
 
Promotional analytics
TrustRobin
 
Marketing optimization
Anene Wealth
 
Data Refinement: The missing link between data collection and decisions
Vivastream
 
CapstoneProjectPresentation.pdf
VineetGupta76987
 
bigmartsalespridictionproject-220813050638-8e9c4c31 (1).pptx
Harshavardhan851231
 
Intro to mktg_itm_sept-2012_session-2
NANDA KISHORE SETHURAMAN
 
Data analytics in retail
tanyazyabkina
 
Business and Data Analytics Collaborative April Meetup
Ken Tucker
 
BIG MART SALES.pptx
LSURYAPRAKASHREDDY
 
BIG MART SALES PRIDICTION PROJECT.pptx
LSURYAPRAKASHREDDY
 
I.liiv gaining shopper_insights_using_market_basket_analysis
ECR Community
 
Art Halls Data Analytics PowerPoint
Arthur Hall, D.Min.
 
Analytics in Functional Areas
GokilavaniS3
 
Ad

More from Minha Hwang (12)

PPTX
Marketing Experiment - Part II: Analysis
Minha Hwang
 
PPTX
Marketing Experimentation - Part I
Minha Hwang
 
PPTX
Introduction to Recommendation System
Minha Hwang
 
PPTX
Dummy Variable Regression Analysis
Minha Hwang
 
PPTX
Multiple Regression Analysis
Minha Hwang
 
PPTX
Introduction to Regression Analysis
Minha Hwang
 
PPTX
Introduction to Text Mining
Minha Hwang
 
PPTX
Conjoint Analysis Part 3/3 - Market Simulator
Minha Hwang
 
PPTX
Conjoint Analysis - Part 2/3
Minha Hwang
 
PPTX
Marketing Research - Perceptual Map
Minha Hwang
 
PDF
Channel capabilities, product characteristics, and impacts of mobile channel ...
Minha Hwang
 
PPTX
From Online to Mobile - Impact of Consumers' Online Purchase Behaviors on Mob...
Minha Hwang
 
Marketing Experiment - Part II: Analysis
Minha Hwang
 
Marketing Experimentation - Part I
Minha Hwang
 
Introduction to Recommendation System
Minha Hwang
 
Dummy Variable Regression Analysis
Minha Hwang
 
Multiple Regression Analysis
Minha Hwang
 
Introduction to Regression Analysis
Minha Hwang
 
Introduction to Text Mining
Minha Hwang
 
Conjoint Analysis Part 3/3 - Market Simulator
Minha Hwang
 
Conjoint Analysis - Part 2/3
Minha Hwang
 
Marketing Research - Perceptual Map
Minha Hwang
 
Channel capabilities, product characteristics, and impacts of mobile channel ...
Minha Hwang
 
From Online to Mobile - Impact of Consumers' Online Purchase Behaviors on Mob...
Minha Hwang
 
Ad

Recently uploaded (20)

PDF
Why Digital Marketing is the Future of Business Growth
Elysium Aviation Academy
 
PDF
AI & Automation: The Future of Marketing or the End of Creativity - Brian Fle...
DigiMarCon - Digital Marketing, Media and Advertising Conferences & Exhibitions
 
DOCX
360% Marketing Strategy – Bihar Panchayati Raj
himanshisharma2499
 
PDF
Digital Marketing Landscape for Beginners (Nepali Case Study Included) – Day ...
Dipendra Poudel | The Digital Dipendra
 
PPTX
Free SEO Tips to Rank on Google Organic
hrithiksrivastava683
 
PDF
Join our community of inspired thinkers today!
Rich Vibes Publication
 
PDF
How to Maximise Social Media Benefits with Digitale.pdf
Digitale
 
PPTX
Empowering Startups with Digital at Ashesi
Eli Daniel-Wilson
 
PPTX
Unlocking Smarter Growth A Performance Marketing Guide in 2025.pptx
Orage Technologies
 
PPTX
The Ultimate Social Media Guide for Marketers and Business Owners
hrithiksrivastava683
 
PDF
The AI-Powered Paid Media Playbook | Amsive Webinar
Amsive
 
PDF
Best Digital Marketing Course in Jaipur | DAAC
Daac
 
PDF
The New SEO Playbook: How AI Is Reshaping Search And Content
Search Engine Journal
 
PDF
HoangThiNgocThien_ProfessionalPortfolio_2025.pdf
Thien Hoang Thi Ngoc
 
PDF
Digital Marketing Trends to Watch in 2025
thedigitalfoot
 
PPTX
DISSERTATION For management students.pptx
ganesh831732
 
PDF
First Thought Agency - all you need to know about us!
knownsense59
 
PDF
Partipost Vietnam Credential Deck (Influencer Marketing Agency)
scarletnguyen9
 
PPT
Mastering Microsoft PowerPoint.ppt......
satsahibsatshib9
 
PDF
Emotional Intelligence in AI: The New Marketing Superpower - Jennifer Jones-M...
DigiMarCon - Digital Marketing, Media and Advertising Conferences & Exhibitions
 
Why Digital Marketing is the Future of Business Growth
Elysium Aviation Academy
 
AI & Automation: The Future of Marketing or the End of Creativity - Brian Fle...
DigiMarCon - Digital Marketing, Media and Advertising Conferences & Exhibitions
 
360% Marketing Strategy – Bihar Panchayati Raj
himanshisharma2499
 
Digital Marketing Landscape for Beginners (Nepali Case Study Included) – Day ...
Dipendra Poudel | The Digital Dipendra
 
Free SEO Tips to Rank on Google Organic
hrithiksrivastava683
 
Join our community of inspired thinkers today!
Rich Vibes Publication
 
How to Maximise Social Media Benefits with Digitale.pdf
Digitale
 
Empowering Startups with Digital at Ashesi
Eli Daniel-Wilson
 
Unlocking Smarter Growth A Performance Marketing Guide in 2025.pptx
Orage Technologies
 
The Ultimate Social Media Guide for Marketers and Business Owners
hrithiksrivastava683
 
The AI-Powered Paid Media Playbook | Amsive Webinar
Amsive
 
Best Digital Marketing Course in Jaipur | DAAC
Daac
 
The New SEO Playbook: How AI Is Reshaping Search And Content
Search Engine Journal
 
HoangThiNgocThien_ProfessionalPortfolio_2025.pdf
Thien Hoang Thi Ngoc
 
Digital Marketing Trends to Watch in 2025
thedigitalfoot
 
DISSERTATION For management students.pptx
ganesh831732
 
First Thought Agency - all you need to know about us!
knownsense59
 
Partipost Vietnam Credential Deck (Influencer Marketing Agency)
scarletnguyen9
 
Mastering Microsoft PowerPoint.ppt......
satsahibsatshib9
 
Emotional Intelligence in AI: The New Marketing Superpower - Jennifer Jones-M...
DigiMarCon - Digital Marketing, Media and Advertising Conferences & Exhibitions
 

Promotion Analytics in Consumer Electronics - Module 1: Data

  • 1. Workshop Overview • Module 1: Data • Module 2: Model and Estimation • Module 3: Sample Output and Empirical Generalization
  • 2. Outline • Ideal Data for Promotion/Pricing Analytics: Scanner Data (in CPG) • Data and Inference: What Can Go Wrong? • Challenges and Common Mistakes in Consumer Electronics • Data Requirement and Potential Data Source
  • 3. Scanner Data (Store Audit Data) How is Data Collected? • Syndicated data providers: IRI and A.C. Nielsen • Sample of stores (Grocery, Drug, Convenience, Mass Merchandiser, Warehouse stores) • Scanner data – UPC info (product features), (Retail) price, Quantity (Volume) all recorded • Features – Centrally collected and coded (daily) • Displays – Collected by store auditors (1X/week)
  • 4. 4 Data Dimensions • The Data Cube – Geography (Market) x Product x Time x Variable (Measure) – G x P x T x V > 1,000,000 even for one category • Aggregation (chain/regions, SKU groups, temporal)
  • 5. Scanner Data: Advantages • Completeness – Linking aggregate sales movements to marketing instruments (price, feature, display, etc) – Obtaining a richer set of performance measures beyond market share and factory shipments • Timeliness – Getting the data within a window that allows for meaningful managerial action (i.e. less than old lag time of 8 weeks or more) • Accuracy
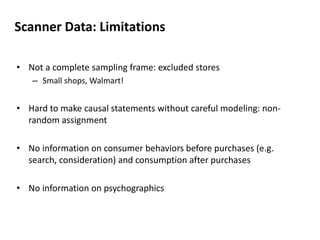
  • 6. Scanner Data: Limitations • Not a complete sampling frame: excluded stores – Small shops, Walmart! • Hard to make causal statements without careful modeling: non-random assignment • No information on consumer behaviors before purchases (e.g. search, consideration) and consumption after purchases • No information on psychographics
  • 7. Promotion Analytics from Scanner Data 5 % Week 8 % 4.5 % 4.8 % 1 2 3 4 5 6 7 8 Promotion Week Purchase Deceleration Purchase Acceleration Net Effect = (8 - 5) - .2 - .5 = 2.3% • A simplistic picture
  • 8. Promotions: Actual data 5 10 15 20 25 30 Week 1 0.8 0.6 0.4 0.2 Market Share 1 0.75 0.5 0.25 Price F D C F D C F D F D C F D C F D F D F = Feature, D = Display, C = Store Coupon
  • 9. Promotion Types (End of Aisle) Display Feature Price-cut (BOGO) Coupon
  • 10. 1. Size of Data Information in Data • Consider the following two options: (1) Wal-Mart with 4,000 stores, 52 weeks of data, 500 SKUs (104 million observations!) (2) Best-buy with 1,500 stores, 52 weeks of data, 500 SKUs (39 million observations) • Which dataset would be more useful to measure price responses? 25 20 15 10 5 0 Wal-Mart (EDLP) 1 3 5 7 9 11 13 15 17 19 21 23 25 27 29 31 33 35 37 39 41 43 45 47 49 51 P1 P2 P3 25 20 15 10 5 0 Best-Buy (Hi-Lo) 1 3 5 7 9 11 13 15 17 19 21 23 25 27 29 31 33 35 37 39 41 43 45 47 49 51 P1 P2 P3
  • 11. 2. Pay Attention to Signal-to-Noise Ratio • Consider the following measurement. Is there significant impact from marketing event? Revenue Before Event After Event % Change Average 10 13 30 • Well, it depends on signal-to-noise ratio! 16 14 12 10 8 6 4 2 0 Revenue before/after Event 0 20 40 60 80 100 120 120 100 80 60 40 20 0 Revenue before/after event 0 20 40 60 80 100 120
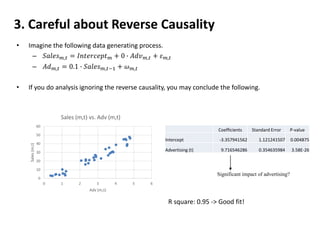
  • 12. 3. Careful about Reverse Causality • Imagine the following data generating process. – 푆푎푙푒푠푚,푡 = 퐼푛푡푒푟푐푒푝푡푚 + 0 ∙ 퐴푑푣푚,푡 + 휀푚,푡 – 퐴푑푚,푡 = 0.1 ∙ 푆푎푙푒푠푚,푡−1 + 휔푚,푡 • If you do analysis ignoring the reverse causality, you may conclude the following. 60 50 40 30 20 10 0 Sales (m,t) vs. Adv (m,t) 0 1 2 3 4 5 6 Sales (m,t) Adv (m,t) Coefficients Standard Error P-value Intercept -3.357941562 1.121241507 0.004875 Advertising (t) 9.716546286 0.354635984 3.58E-26 Significant impact of advertising? R square: 0.95 -> Good fit!
  • 13. 4. Omitted Variables Can Be Dangerous • Oftentimes, we don’t have data on some important variables, which can impact sales, revenue, or profits. – Doing analytics ignoring these “omitted variables” can lead to “biased” estimates of marketing mix effects. • Think about the graph below (from NYT). Is the family income really responsible for better academic achievement? What would be potential omitted variable bias here?
  • 14. 5. Selection by Outcome: Bad Idea! • Problem: Often times, two groups, which are conditioned by outcome variables, are compared to infer the causal impact of marketing mix • Example – To calculate the ROI of paid search campaign, advertisers compare the “conversion rates” of each “search” keyword. Usually, branded keywords are shown to have high conversion rates (> 6%) compared to generic keywords (~ 1%). • How to fix the problems? – Use proper “control” condition! – In the paid search example, all the traffics/conversions from consumers who click on branded keywords are attributed to the resulting sales and profit. An implicit assumption here is that all the sales/profits are lost without paid search. Really? – It’s possible that consumers who use branded keywords are already quite committed to purchase, and they may simply substitute to unpaid (organic) search links if paid searches are turned off. – A proper control in this case is “halting selected search engine marketing keywords”
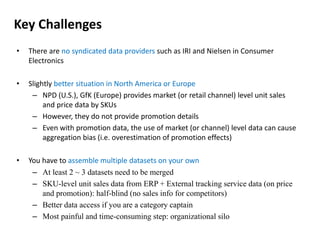
  • 15. Key Challenges • There are no syndicated data providers such as IRI and Nielsen in Consumer Electronics • Slightly better situation in North America or Europe – NPD (U.S.), GfK (Europe) provides market (or retail channel) level unit sales and price data by SKUs – However, they do not provide promotion details – Even with promotion data, the use of market (or channel) level data can cause aggregation bias (i.e. overestimation of promotion effects) • You have to assemble multiple datasets on your own – At least 2 ~ 3 datasets need to be merged – SKU-level unit sales data from ERP + External tracking service data (on price and promotion): half-blind (no sales info for competitors) – Better data access if you are a category captain – Most painful and time-consuming step: organizational silo
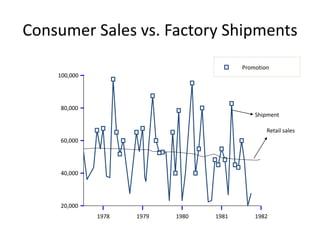
  • 16. Common Mistakes: For Discussion • Use factory shipment data instead of retail sales data – Biased promotion effect estimates due to forward buying from retailers • Use cross-sectional data to measure price/promotion effects – Biased price or promotion effect estimates due to omitted variable bias – Better to use panel data and identify effects from within-store (or within chain) variation • Use market (or channel) level data – Promotion effects are not homogeneous within a market (or channel) – Due to aggregation bias, promotion effects will be overstated – Better to use store, account, or chain-level data where promotion activities do not vary across units • Use data with short history (1 year or less) – At least, 2 ~ 3 years of data are required to properly measure seasonality • Ignore price changes and promotion from competitors – Biased estimates of baseline sales and price/promotion effects
  • 17. Consumer Sales vs. Factory Shipments 100,000 80,000 60,000 40,000 20,000 Promotion Shipment Retail sales 1978 1979 1980 1981 1982
  • 18. Data Requirement • Key elements of data – Unit sales by SKUs (outcome): ideally for the entire category (including competitors), but feasible only with data for focal company‘s own SKUs – Price measures by SKU(causal): focal company + competitors – Promotion measures by SKU/product line/brand (causal): focal company + competitors • Duration – Ideally 3 years (of weekly data); At least 2 years of data – To properly control seasonality • Level of aggregation – Ideally store-level data; chain or account (chain-market combination) data can be used as long as promotion/price policies are uniform (within chain or account) – Using market or channel-level data can cause overstating of promotion effects due to aggregation bias • Type of response data: Retail sales data (Do not use factory shipment data) – Due to forward buying from retailers
  • 19. Potential Data Source: For Discussion • Key elements of data – Unit sales by SKUs (outcome) – Price measures by SKU(causal) – Promotion measures by SKU/product line/brand (causal)