SlideShare a Scribd company logo
PROGRAMMING IN PYTHON
MCA-161
4 Credits (3-0-2)
MCA 5th Sem (2020-21)
R K Dwivedi
Assistant Professor
Department of ITCA
MMMUT Gorakhpur
UNIT IV: Advance Concepts
A. Problem solving:
• Use of Python to solve real time problems
• How Python helps to research problems
• Creating various types of graphs corresponding to any data to show different kinds of results and analysis
B. Data Analysis:
• Understanding problems of data science and machine learning
• Creating codes for data analysis problems in Python
• Other advance programs
11-11-2020 Side 3
Madan Mohan Malaviya Univ. of Technology, Gorakhpur
A. Problem solving
11-11-2020 Side 4
Madan Mohan Malaviya Univ. of Technology, Gorakhpur
1. Use of Python to solve real time problems
11-11-2020 Side 5
Madan Mohan Malaviya Univ. of Technology, Gorakhpur
1. Use of Python to solve real time problems
• Python can be used on a server to create web applications.
• It can be used to create GUI based desktop applications(Games, Scientific and Business Applications).
• It is also used to create test frameworks and multimedia applications.
• It is used to develop operating systems and programming language.
• It can be used to handle image processing, text processing and natural language processing.
• It can be used to create programs for machine learning, deep learning, data science, big data and data analytics applications.
• It can also perform complex mathematics along with all cutting edge technology in software industry.
Organizations and tech-giant companies using Python :
1) Google(Components of Google spider and Search Engine)
2) Yahoo(Maps)
3) YouTube
4) Mozilla
5) Dropbox
6) Microsoft
7) Cisco
8) Spotify
9) Quora
10) Instagram
11)Amazon
12)Facebook
13)Uber etc.
11-11-2020 Side 6
Madan Mohan Malaviya Univ. of Technology, Gorakhpur
1. Use of Python to solve real time problems …continued
Some Real Time Projects, their Python Codes and Datasets :
https://data-flair.training/blogs/python-project-ideas/
https://data-flair.training/blogs/django-project-ideas/
https://data-flair.training/blogs/data-science-project-ideas/
https://data-flair.training/blogs/artificial-intelligence-project-ideas/
https://data-flair.training/blogs/machine-learning-project-ideas/
https://data-flair.training/blogs/deep-learning-project-ideas/
https://data-flair.training/blogs/iot-project-ideas/
https://data-flair.training/blogs/computer-vision-project-ideas/
https://archive.ics.uci.edu/ml/datasets.php
https://www.kaggle.com/datasets
https://github.com/topics/covid-19
11-11-2020 Side 7
Madan Mohan Malaviya Univ. of Technology, Gorakhpur
2. How Python helps to research problems
11-11-2020 Side 8
Madan Mohan Malaviya Univ. of Technology, Gorakhpur
2. How Python helps to research problems
It can be used in various types of research areas such as:
• Image Processing
• Text Processing
• Natural Language Processing
• Machine Learning
• Deep Learning
• Data Science
• Big Data Analytics
11-11-2020 Side 9
Madan Mohan Malaviya Univ. of Technology, Gorakhpur
3. Creating various types of graphs corresponding to any data
(to show different kinds of results and analysis)
11-11-2020 Side 10
Madan Mohan Malaviya Univ. of Technology, Gorakhpur
1. Creating various types of graphs corresponding to any data (to show different kinds of results and analysis)
• Matplotlib is a graph plotting library in python that serves as a visualization utility.
• NumPy (Numerical Python) is a python library used for working with arrays.
• NumPy also has functions for working in the domain of linear algebra, fourier transform, and matrices.
• subplot( ) allows to draw multiple plots in one fig. (subplot(no of rows, no of columns, index of current plot)
• All modern browsers support 140 color names (Syntax: color=‘r’ or color=‘red’ or c=‘r’ or c=‘red’).
• A hexadecimal color is specified with: #RRGGBB (Syntax: color=‘#0000ff’ or c=‘0000ff’).
A. Line Graph:
• linestyle can be written as ls in a shorter syntax.
• linewidth can be written as lw in a shorter syntax.
• color can be written as c in a shorter syntax.
linestyle short syntax
solid' (default) '-'
'dotted' ':'
'dashed' '--'
'dashdot' '-.'
'None' '' or ' '
'r' - Red
'g' - Green
'b' - Blue
'c' - Cyan
'm' - Magenta
'y' - Yellow
'k' - Black
'w' - White
11-11-2020 Side 11
Madan Mohan Malaviya Univ. of Technology, Gorakhpur
1. Creating various types of graphs corresponding to any data (to show different kinds of results and analysis)
…continued
11-11-2020 Side 12
Madan Mohan Malaviya Univ. of Technology, Gorakhpur
1. Creating various types of graphs corresponding to any data (to show different kinds of results and analysis)
…continued
B. Bar Graph:
• The default width value of the bars is 0.8.
• bar ( ) function displays the bar graph vertically and barh( ) function displays the bar graph horizontally.
11-11-2020 Side 13
Madan Mohan Malaviya Univ. of Technology, Gorakhpur
1. Creating various types of graphs corresponding to any data (to show different kinds of results and analysis)
…continued
11-11-2020 Side 14
Madan Mohan Malaviya Univ. of Technology, Gorakhpur
1. Creating various types of graphs corresponding to any data (to show different kinds of results and analysis)
…continued
C. Pie Chart:
• By default the plotting of the first wedge starts from the x-axis and move counterclockwise.
• pie( ) function is used to draw the pie charts.
• pie(populationShare, labelsWedge, colors, startAngle, explode, shadow)
• legend(title = "Four Fruits:", loc='lower right')
Location String Location Code
'best' 0
'upper right' 1
'upper left' 2
'lower left' 3
'lower right' 4
'right' 5
'center left' 6
'center right' 7
'lower center' 8
'upper center' 9
'center' 10
11-11-2020 Side 15
Madan Mohan Malaviya Univ. of Technology, Gorakhpur
1. Creating various types of graphs corresponding to any data (to show different kinds of results and analysis)
…continued
11-11-2020 Side 16
Madan Mohan Malaviya Univ. of Technology, Gorakhpur
1. Creating various types of graphs corresponding to any data (to show different kinds of results and analysis)
…continued
11-11-2020 Side 17
Madan Mohan Malaviya Univ. of Technology, Gorakhpur
1. Creating various types of graphs corresponding to any data (to show different kinds of results and analysis)
…continued
D. Histogram:
• A histogram is a graph showing frequency distributions.
• It is a graph showing the number of observations within each given interval.
• hist() function to create histograms.
• Create a histogram to represent following:
❖ 2 people from 140 to 145cm
❖ 5 people from 145 to 150cm
❖ 15 people from 151 to 156cm
❖ 31 people from 157 to 162cm
❖ 46 people from 163 to 168cm
❖ 53 people from 168 to 173cm
❖ 45 people from 173 to 178cm
❖ 28 people from 179 to 184cm
❖ 21 people from 185 to 190cm
❖ 4 people from 190 to 195cm
• For this, function numpy.random.normal(170, 10, 250) can be used which shows that NumPy uses Normal
Distribution to randomly generate an array with 250 values, where the values will concentrate around 170,
and the standard deviation is 10.
11-11-2020 Side 18
Madan Mohan Malaviya Univ. of Technology, Gorakhpur
1. Creating various types of graphs corresponding to any data (to show different kinds of results and analysis)
…continued
11-11-2020 Side 19
Madan Mohan Malaviya Univ. of Technology, Gorakhpur
B. Data Analysis
11-11-2020 Side 20
Madan Mohan Malaviya Univ. of Technology, Gorakhpur
1. Understanding problems of data science and machine learning
11-11-2020 Side 21
Madan Mohan Malaviya Univ. of Technology, Gorakhpur
1. Understanding problems of data science and machine learning
A. Introduction:
11-11-2020 Side 22
Madan Mohan Malaviya Univ. of Technology, Gorakhpur
1. Understanding problems of data science and machine learning …continued
B. Procedure:
11-11-2020 Side 23
Madan Mohan Malaviya Univ. of Technology, Gorakhpur
1. Understanding problems of data science and machine learning …continued
C. Applications:
11-11-2020 Side 24
Madan Mohan Malaviya Univ. of Technology, Gorakhpur
1. Understanding problems of data science and machine learning …continued
A. Introduction:
11-11-2020 Side 25
Madan Mohan Malaviya Univ. of Technology, Gorakhpur
1. Understanding problems of data science and machine learning …continued
B. Relation among AI, ML, NN, and DL:
11-11-2020 Side 26
Madan Mohan Malaviya Univ. of Technology, Gorakhpur
1. Understanding problems of data science and machine learning …continued
C. Types of ML:
•Supervised Learning – Train Me!
•Unsupervised Learning – I am self sufficient in learning
•Reinforcement Learning – My life My rules! (Hit & Trial)
11-11-2020 Side 27
Madan Mohan Malaviya Univ. of Technology, Gorakhpur
1. Understanding problems of data science and machine learning …continued
D. Techniques used in ML:
11-11-2020 Side 28
Madan Mohan Malaviya Univ. of Technology, Gorakhpur
1. Understanding problems of data science and machine learning …continued
E. Procedure (View 1)
Usually 80% data for training, and 20% data for testing
11-11-2020 Side 29
Madan Mohan Malaviya Univ. of Technology, Gorakhpur
1. Understanding problems of data science and machine learning …continued
E. Procedure (View 2)
11-11-2020 Side 30
Madan Mohan Malaviya Univ. of Technology, Gorakhpur
1. Understanding problems of data science and machine learning …continued
E. Procedure (View 3)
11-11-2020 Side 31
Madan Mohan Malaviya Univ. of Technology, Gorakhpur
1. Understanding problems of data science and machine learning …continued
F. Applications (View 1):
11-11-2020 Side 32
Madan Mohan Malaviya Univ. of Technology, Gorakhpur
1. Understanding problems of data science and machine learning …continued
F. Applications (View 2):
11-11-2020 Side 33
Madan Mohan Malaviya Univ. of Technology, Gorakhpur
1. Understanding problems of data science and machine learning …continued
F. Applications (View 3):
11-11-2020 Side 34
Madan Mohan Malaviya Univ. of Technology, Gorakhpur
2. Creating codes for data analysis problems in Python
11-11-2020 Side 35
Madan Mohan Malaviya Univ. of Technology, Gorakhpur
2. Creating codes for data analysis problems in Python
First of all, import or load the dataset and then analyse it.
A. The basic process of loading data from a CSV file with Pandas
# Load the Pandas libraries with alias 'pd'
import pandas as pd
# Read data from file 'filename.csv' (in the same directory)
data = pd.read_csv("filename.csv")
# Preview the first 5 lines of the loaded data
data.head()
import pandas
filename = ‘indians-diabetes.data.csv'
names = ['preg', 'plas', 'pres', 'skin', 'test', 'mass', 'pedi', 'age', 'class']
data = pandas.read_csv(filename, names=names)
print(data.shape)
OR
11-11-2020 Side 36
Madan Mohan Malaviya Univ. of Technology, Gorakhpur
2. Creating codes for data analysis problems in Python …continued
C. The basic process of loading data from a CSV file with Python Standard Library
B. The basic process of loading data from a CSV file with NumPy
import numpy
filename = 'indians-diabetes.data.csv'
raw_data = open(filename, 'rt')
data = numpy.loadtxt(raw_data, delimiter=",")
print(data.shape)
import csv
import numpy
filename = 'indians-diabetes.data.csv'
raw_data = open(filename, 'rt')
reader = csv.reader(raw_data, delimiter=‘,’ , quoting=csv.QUOTE_NONE)
x = list(reader)
data = numpy.array(x).astype('float')
print(data.shape)
11-11-2020 Side 37
Madan Mohan Malaviya Univ. of Technology, Gorakhpur
2. Creating codes for data analysis problems in Python …continued
D. Data Analysis
11-11-2020 Side 38
Madan Mohan Malaviya Univ. of Technology, Gorakhpur
3. Other advance programs
11-11-2020 Side 39
Madan Mohan Malaviya Univ. of Technology, Gorakhpur
3. Other advance programs: Calendar (I)
11-11-2020 Side 40
Madan Mohan Malaviya Univ. of Technology, Gorakhpur
3. Other advance programs : Calendar (II) …continued
11-11-2020 Side 41
Madan Mohan Malaviya Univ. of Technology, Gorakhpur
3. Other advance programs: Calculator …continued
https://data-flair.s3.ap-south-1.amazonaws.com/python-projects/dataflair-python-calculator.zip
11-11-2020 Side 42
Madan Mohan Malaviya Univ. of Technology, Gorakhpur
3. Other advance programs: Currency Converter …continued
https://data-flair.s3.ap-south-1.amazonaws.com/python-projects/currency-converter-project.zip
11-11-2020 Side 43
Madan Mohan Malaviya Univ. of Technology, Gorakhpur
3. Other advance programs: Music Player …continued
https://project-gurukul.s3.ap-south-1.amazonaws.com/python-projects/music-player-python.zip
11-11-2020 Side 44
Madan Mohan Malaviya Univ. of Technology, Gorakhpur
3. Other advance programs: Alarm Clock …continued
https://data-flair.s3.ap-south-1.amazonaws.com/python-projects/DataFlair-Alarm-Clock.zip
Queries ?
Ad

More Related Content

Similar to Python Programming Unit 4 Problem Solving and Data Analysis (20)

Computational Methods and Data Engineering: Proceedings of ICMDE 2020, Volume...
Computational Methods and Data Engineering: Proceedings of ICMDE 2020, Volume...Computational Methods and Data Engineering: Proceedings of ICMDE 2020, Volume...
Computational Methods and Data Engineering: Proceedings of ICMDE 2020, Volume...
doielhugerpn
 
The K-12 Computer Science Imperative
The K-12 Computer Science ImperativeThe K-12 Computer Science Imperative
The K-12 Computer Science Imperative
WeTeach_CS
 
TASA/TASB 2015 Computer Science Imperative for K-12
TASA/TASB 2015 Computer Science Imperative for K-12TASA/TASB 2015 Computer Science Imperative for K-12
TASA/TASB 2015 Computer Science Imperative for K-12
Hal Speed
 
Resume
ResumeResume
Resume
Faizanur Rahman
 
Te computer-syllabus-2015-course-3-4-17
Te computer-syllabus-2015-course-3-4-17Te computer-syllabus-2015-course-3-4-17
Te computer-syllabus-2015-course-3-4-17
abc19789
 
cv
cvcv
cv
Sahil Grover
 
Ml conference slides boston june 2019
Ml conference slides boston june 2019Ml conference slides boston june 2019
Ml conference slides boston june 2019
QuantUniversity
 
CFA-NY Workshop - Final slides
CFA-NY Workshop - Final slidesCFA-NY Workshop - Final slides
CFA-NY Workshop - Final slides
QuantUniversity
 
Data Science Course In Mumbai-August
Data Science Course In Mumbai-AugustData Science Course In Mumbai-August
Data Science Course In Mumbai-August
DataMites
 
QCon conference 2019
QCon conference 2019QCon conference 2019
QCon conference 2019
QuantUniversity
 
Programing Slicing and Its applications
Programing Slicing and Its applicationsPrograming Slicing and Its applications
Programing Slicing and Its applications
Ankur Jain
 
Machine Learning and AI: An Intuitive Introduction - CFA Institute Masterclass
Machine Learning and AI: An Intuitive Introduction - CFA Institute MasterclassMachine Learning and AI: An Intuitive Introduction - CFA Institute Masterclass
Machine Learning and AI: An Intuitive Introduction - CFA Institute Masterclass
QuantUniversity
 
Fdp ppt
Fdp pptFdp ppt
Fdp ppt
jayaramb
 
A New Paradigm on Analytic-Driven Information and Automation V2.pdf
A New Paradigm on Analytic-Driven Information and Automation V2.pdfA New Paradigm on Analytic-Driven Information and Automation V2.pdf
A New Paradigm on Analytic-Driven Information and Automation V2.pdf
ArmyTrilidiaDevegaSK
 
Te computer syllabus 2015 course 3-4-17 3-5-17
Te computer syllabus 2015 course 3-4-17 3-5-17Te computer syllabus 2015 course 3-4-17 3-5-17
Te computer syllabus 2015 course 3-4-17 3-5-17
VishalButkar2
 
Resume
ResumeResume
Resume
Piyush Tiwary
 
Ntegra 20180523 v10 copy.pptx
Ntegra 20180523 v10 copy.pptxNtegra 20180523 v10 copy.pptx
Ntegra 20180523 v10 copy.pptx
home
 
Data Science and Machine Learning Power Pack
Data Science and Machine Learning Power PackData Science and Machine Learning Power Pack
Data Science and Machine Learning Power Pack
Kennedy Kamande Wangari
 
battery pa report.docx
battery pa report.docxbattery pa report.docx
battery pa report.docx
deependerdeshwal
 
L2 DS Tools and Application.pptx
L2 DS Tools and Application.pptxL2 DS Tools and Application.pptx
L2 DS Tools and Application.pptx
Shambhavi Vats
 
Computational Methods and Data Engineering: Proceedings of ICMDE 2020, Volume...
Computational Methods and Data Engineering: Proceedings of ICMDE 2020, Volume...Computational Methods and Data Engineering: Proceedings of ICMDE 2020, Volume...
Computational Methods and Data Engineering: Proceedings of ICMDE 2020, Volume...
doielhugerpn
 
The K-12 Computer Science Imperative
The K-12 Computer Science ImperativeThe K-12 Computer Science Imperative
The K-12 Computer Science Imperative
WeTeach_CS
 
TASA/TASB 2015 Computer Science Imperative for K-12
TASA/TASB 2015 Computer Science Imperative for K-12TASA/TASB 2015 Computer Science Imperative for K-12
TASA/TASB 2015 Computer Science Imperative for K-12
Hal Speed
 
Te computer-syllabus-2015-course-3-4-17
Te computer-syllabus-2015-course-3-4-17Te computer-syllabus-2015-course-3-4-17
Te computer-syllabus-2015-course-3-4-17
abc19789
 
Ml conference slides boston june 2019
Ml conference slides boston june 2019Ml conference slides boston june 2019
Ml conference slides boston june 2019
QuantUniversity
 
CFA-NY Workshop - Final slides
CFA-NY Workshop - Final slidesCFA-NY Workshop - Final slides
CFA-NY Workshop - Final slides
QuantUniversity
 
Data Science Course In Mumbai-August
Data Science Course In Mumbai-AugustData Science Course In Mumbai-August
Data Science Course In Mumbai-August
DataMites
 
Programing Slicing and Its applications
Programing Slicing and Its applicationsPrograming Slicing and Its applications
Programing Slicing and Its applications
Ankur Jain
 
Machine Learning and AI: An Intuitive Introduction - CFA Institute Masterclass
Machine Learning and AI: An Intuitive Introduction - CFA Institute MasterclassMachine Learning and AI: An Intuitive Introduction - CFA Institute Masterclass
Machine Learning and AI: An Intuitive Introduction - CFA Institute Masterclass
QuantUniversity
 
A New Paradigm on Analytic-Driven Information and Automation V2.pdf
A New Paradigm on Analytic-Driven Information and Automation V2.pdfA New Paradigm on Analytic-Driven Information and Automation V2.pdf
A New Paradigm on Analytic-Driven Information and Automation V2.pdf
ArmyTrilidiaDevegaSK
 
Te computer syllabus 2015 course 3-4-17 3-5-17
Te computer syllabus 2015 course 3-4-17 3-5-17Te computer syllabus 2015 course 3-4-17 3-5-17
Te computer syllabus 2015 course 3-4-17 3-5-17
VishalButkar2
 
Ntegra 20180523 v10 copy.pptx
Ntegra 20180523 v10 copy.pptxNtegra 20180523 v10 copy.pptx
Ntegra 20180523 v10 copy.pptx
home
 
Data Science and Machine Learning Power Pack
Data Science and Machine Learning Power PackData Science and Machine Learning Power Pack
Data Science and Machine Learning Power Pack
Kennedy Kamande Wangari
 
L2 DS Tools and Application.pptx
L2 DS Tools and Application.pptxL2 DS Tools and Application.pptx
L2 DS Tools and Application.pptx
Shambhavi Vats
 

Recently uploaded (20)

The Gaussian Process Modeling Module in UQLab
The Gaussian Process Modeling Module in UQLabThe Gaussian Process Modeling Module in UQLab
The Gaussian Process Modeling Module in UQLab
Journal of Soft Computing in Civil Engineering
 
Value Stream Mapping Worskshops for Intelligent Continuous Security
Value Stream Mapping Worskshops for Intelligent Continuous SecurityValue Stream Mapping Worskshops for Intelligent Continuous Security
Value Stream Mapping Worskshops for Intelligent Continuous Security
Marc Hornbeek
 
Data Structures_Linear data structures Linked Lists.pptx
Data Structures_Linear data structures Linked Lists.pptxData Structures_Linear data structures Linked Lists.pptx
Data Structures_Linear data structures Linked Lists.pptx
RushaliDeshmukh2
 
Main cotrol jdbjbdcnxbjbjzjjjcjicbjxbcjcxbjcxb
Main cotrol jdbjbdcnxbjbjzjjjcjicbjxbcjcxbjcxbMain cotrol jdbjbdcnxbjbjzjjjcjicbjxbcjcxbjcxb
Main cotrol jdbjbdcnxbjbjzjjjcjicbjxbcjcxbjcxb
SunilSingh610661
 
New Microsoft PowerPoint Presentation.pdf
New Microsoft PowerPoint Presentation.pdfNew Microsoft PowerPoint Presentation.pdf
New Microsoft PowerPoint Presentation.pdf
mohamedezzat18803
 
DATA-DRIVEN SHOULDER INVERSE KINEMATICS YoungBeom Kim1 , Byung-Ha Park1 , Kwa...
DATA-DRIVEN SHOULDER INVERSE KINEMATICS YoungBeom Kim1 , Byung-Ha Park1 , Kwa...DATA-DRIVEN SHOULDER INVERSE KINEMATICS YoungBeom Kim1 , Byung-Ha Park1 , Kwa...
DATA-DRIVEN SHOULDER INVERSE KINEMATICS YoungBeom Kim1 , Byung-Ha Park1 , Kwa...
charlesdick1345
 
Degree_of_Automation.pdf for Instrumentation and industrial specialist
Degree_of_Automation.pdf for  Instrumentation  and industrial specialistDegree_of_Automation.pdf for  Instrumentation  and industrial specialist
Degree_of_Automation.pdf for Instrumentation and industrial specialist
shreyabhosale19
 
Structural Response of Reinforced Self-Compacting Concrete Deep Beam Using Fi...
Structural Response of Reinforced Self-Compacting Concrete Deep Beam Using Fi...Structural Response of Reinforced Self-Compacting Concrete Deep Beam Using Fi...
Structural Response of Reinforced Self-Compacting Concrete Deep Beam Using Fi...
Journal of Soft Computing in Civil Engineering
 
Metal alkyne complexes.pptx in chemistry
Metal alkyne complexes.pptx in chemistryMetal alkyne complexes.pptx in chemistry
Metal alkyne complexes.pptx in chemistry
mee23nu
 
Development of MLR, ANN and ANFIS Models for Estimation of PCUs at Different ...
Development of MLR, ANN and ANFIS Models for Estimation of PCUs at Different ...Development of MLR, ANN and ANFIS Models for Estimation of PCUs at Different ...
Development of MLR, ANN and ANFIS Models for Estimation of PCUs at Different ...
Journal of Soft Computing in Civil Engineering
 
RICS Membership-(The Royal Institution of Chartered Surveyors).pdf
RICS Membership-(The Royal Institution of Chartered Surveyors).pdfRICS Membership-(The Royal Institution of Chartered Surveyors).pdf
RICS Membership-(The Royal Institution of Chartered Surveyors).pdf
MohamedAbdelkader115
 
MAQUINARIA MINAS CEMA 6th Edition (1).pdf
MAQUINARIA MINAS CEMA 6th Edition (1).pdfMAQUINARIA MINAS CEMA 6th Edition (1).pdf
MAQUINARIA MINAS CEMA 6th Edition (1).pdf
ssuser562df4
 
Data Structures_Searching and Sorting.pptx
Data Structures_Searching and Sorting.pptxData Structures_Searching and Sorting.pptx
Data Structures_Searching and Sorting.pptx
RushaliDeshmukh2
 
new ppt artificial intelligence historyyy
new ppt artificial intelligence historyyynew ppt artificial intelligence historyyy
new ppt artificial intelligence historyyy
PianoPianist
 
IntroSlides-April-BuildWithAI-VertexAI.pdf
IntroSlides-April-BuildWithAI-VertexAI.pdfIntroSlides-April-BuildWithAI-VertexAI.pdf
IntroSlides-April-BuildWithAI-VertexAI.pdf
Luiz Carneiro
 
Artificial Intelligence introduction.pptx
Artificial Intelligence introduction.pptxArtificial Intelligence introduction.pptx
Artificial Intelligence introduction.pptx
DrMarwaElsherif
 
"Boiler Feed Pump (BFP): Working, Applications, Advantages, and Limitations E...
"Boiler Feed Pump (BFP): Working, Applications, Advantages, and Limitations E..."Boiler Feed Pump (BFP): Working, Applications, Advantages, and Limitations E...
"Boiler Feed Pump (BFP): Working, Applications, Advantages, and Limitations E...
Infopitaara
 
Smart Storage Solutions.pptx for production engineering
Smart Storage Solutions.pptx for production engineeringSmart Storage Solutions.pptx for production engineering
Smart Storage Solutions.pptx for production engineering
rushikeshnavghare94
 
How to use nRF24L01 module with Arduino
How to use nRF24L01 module with ArduinoHow to use nRF24L01 module with Arduino
How to use nRF24L01 module with Arduino
CircuitDigest
 
five-year-soluhhhhhhhhhhhhhhhhhtions.pdf
five-year-soluhhhhhhhhhhhhhhhhhtions.pdffive-year-soluhhhhhhhhhhhhhhhhhtions.pdf
five-year-soluhhhhhhhhhhhhhhhhhtions.pdf
AdityaSharma944496
 
Value Stream Mapping Worskshops for Intelligent Continuous Security
Value Stream Mapping Worskshops for Intelligent Continuous SecurityValue Stream Mapping Worskshops for Intelligent Continuous Security
Value Stream Mapping Worskshops for Intelligent Continuous Security
Marc Hornbeek
 
Data Structures_Linear data structures Linked Lists.pptx
Data Structures_Linear data structures Linked Lists.pptxData Structures_Linear data structures Linked Lists.pptx
Data Structures_Linear data structures Linked Lists.pptx
RushaliDeshmukh2
 
Main cotrol jdbjbdcnxbjbjzjjjcjicbjxbcjcxbjcxb
Main cotrol jdbjbdcnxbjbjzjjjcjicbjxbcjcxbjcxbMain cotrol jdbjbdcnxbjbjzjjjcjicbjxbcjcxbjcxb
Main cotrol jdbjbdcnxbjbjzjjjcjicbjxbcjcxbjcxb
SunilSingh610661
 
New Microsoft PowerPoint Presentation.pdf
New Microsoft PowerPoint Presentation.pdfNew Microsoft PowerPoint Presentation.pdf
New Microsoft PowerPoint Presentation.pdf
mohamedezzat18803
 
DATA-DRIVEN SHOULDER INVERSE KINEMATICS YoungBeom Kim1 , Byung-Ha Park1 , Kwa...
DATA-DRIVEN SHOULDER INVERSE KINEMATICS YoungBeom Kim1 , Byung-Ha Park1 , Kwa...DATA-DRIVEN SHOULDER INVERSE KINEMATICS YoungBeom Kim1 , Byung-Ha Park1 , Kwa...
DATA-DRIVEN SHOULDER INVERSE KINEMATICS YoungBeom Kim1 , Byung-Ha Park1 , Kwa...
charlesdick1345
 
Degree_of_Automation.pdf for Instrumentation and industrial specialist
Degree_of_Automation.pdf for  Instrumentation  and industrial specialistDegree_of_Automation.pdf for  Instrumentation  and industrial specialist
Degree_of_Automation.pdf for Instrumentation and industrial specialist
shreyabhosale19
 
Metal alkyne complexes.pptx in chemistry
Metal alkyne complexes.pptx in chemistryMetal alkyne complexes.pptx in chemistry
Metal alkyne complexes.pptx in chemistry
mee23nu
 
RICS Membership-(The Royal Institution of Chartered Surveyors).pdf
RICS Membership-(The Royal Institution of Chartered Surveyors).pdfRICS Membership-(The Royal Institution of Chartered Surveyors).pdf
RICS Membership-(The Royal Institution of Chartered Surveyors).pdf
MohamedAbdelkader115
 
MAQUINARIA MINAS CEMA 6th Edition (1).pdf
MAQUINARIA MINAS CEMA 6th Edition (1).pdfMAQUINARIA MINAS CEMA 6th Edition (1).pdf
MAQUINARIA MINAS CEMA 6th Edition (1).pdf
ssuser562df4
 
Data Structures_Searching and Sorting.pptx
Data Structures_Searching and Sorting.pptxData Structures_Searching and Sorting.pptx
Data Structures_Searching and Sorting.pptx
RushaliDeshmukh2
 
new ppt artificial intelligence historyyy
new ppt artificial intelligence historyyynew ppt artificial intelligence historyyy
new ppt artificial intelligence historyyy
PianoPianist
 
IntroSlides-April-BuildWithAI-VertexAI.pdf
IntroSlides-April-BuildWithAI-VertexAI.pdfIntroSlides-April-BuildWithAI-VertexAI.pdf
IntroSlides-April-BuildWithAI-VertexAI.pdf
Luiz Carneiro
 
Artificial Intelligence introduction.pptx
Artificial Intelligence introduction.pptxArtificial Intelligence introduction.pptx
Artificial Intelligence introduction.pptx
DrMarwaElsherif
 
"Boiler Feed Pump (BFP): Working, Applications, Advantages, and Limitations E...
"Boiler Feed Pump (BFP): Working, Applications, Advantages, and Limitations E..."Boiler Feed Pump (BFP): Working, Applications, Advantages, and Limitations E...
"Boiler Feed Pump (BFP): Working, Applications, Advantages, and Limitations E...
Infopitaara
 
Smart Storage Solutions.pptx for production engineering
Smart Storage Solutions.pptx for production engineeringSmart Storage Solutions.pptx for production engineering
Smart Storage Solutions.pptx for production engineering
rushikeshnavghare94
 
How to use nRF24L01 module with Arduino
How to use nRF24L01 module with ArduinoHow to use nRF24L01 module with Arduino
How to use nRF24L01 module with Arduino
CircuitDigest
 
five-year-soluhhhhhhhhhhhhhhhhhtions.pdf
five-year-soluhhhhhhhhhhhhhhhhhtions.pdffive-year-soluhhhhhhhhhhhhhhhhhtions.pdf
five-year-soluhhhhhhhhhhhhhhhhhtions.pdf
AdityaSharma944496
 
Ad

Python Programming Unit 4 Problem Solving and Data Analysis

  • 1. PROGRAMMING IN PYTHON MCA-161 4 Credits (3-0-2) MCA 5th Sem (2020-21) R K Dwivedi Assistant Professor Department of ITCA MMMUT Gorakhpur
  • 2. UNIT IV: Advance Concepts A. Problem solving: • Use of Python to solve real time problems • How Python helps to research problems • Creating various types of graphs corresponding to any data to show different kinds of results and analysis B. Data Analysis: • Understanding problems of data science and machine learning • Creating codes for data analysis problems in Python • Other advance programs
  • 3. 11-11-2020 Side 3 Madan Mohan Malaviya Univ. of Technology, Gorakhpur A. Problem solving
  • 4. 11-11-2020 Side 4 Madan Mohan Malaviya Univ. of Technology, Gorakhpur 1. Use of Python to solve real time problems
  • 5. 11-11-2020 Side 5 Madan Mohan Malaviya Univ. of Technology, Gorakhpur 1. Use of Python to solve real time problems • Python can be used on a server to create web applications. • It can be used to create GUI based desktop applications(Games, Scientific and Business Applications). • It is also used to create test frameworks and multimedia applications. • It is used to develop operating systems and programming language. • It can be used to handle image processing, text processing and natural language processing. • It can be used to create programs for machine learning, deep learning, data science, big data and data analytics applications. • It can also perform complex mathematics along with all cutting edge technology in software industry. Organizations and tech-giant companies using Python : 1) Google(Components of Google spider and Search Engine) 2) Yahoo(Maps) 3) YouTube 4) Mozilla 5) Dropbox 6) Microsoft 7) Cisco 8) Spotify 9) Quora 10) Instagram 11)Amazon 12)Facebook 13)Uber etc.
  • 6. 11-11-2020 Side 6 Madan Mohan Malaviya Univ. of Technology, Gorakhpur 1. Use of Python to solve real time problems …continued Some Real Time Projects, their Python Codes and Datasets : https://data-flair.training/blogs/python-project-ideas/ https://data-flair.training/blogs/django-project-ideas/ https://data-flair.training/blogs/data-science-project-ideas/ https://data-flair.training/blogs/artificial-intelligence-project-ideas/ https://data-flair.training/blogs/machine-learning-project-ideas/ https://data-flair.training/blogs/deep-learning-project-ideas/ https://data-flair.training/blogs/iot-project-ideas/ https://data-flair.training/blogs/computer-vision-project-ideas/ https://archive.ics.uci.edu/ml/datasets.php https://www.kaggle.com/datasets https://github.com/topics/covid-19
  • 7. 11-11-2020 Side 7 Madan Mohan Malaviya Univ. of Technology, Gorakhpur 2. How Python helps to research problems
  • 8. 11-11-2020 Side 8 Madan Mohan Malaviya Univ. of Technology, Gorakhpur 2. How Python helps to research problems It can be used in various types of research areas such as: • Image Processing • Text Processing • Natural Language Processing • Machine Learning • Deep Learning • Data Science • Big Data Analytics
  • 9. 11-11-2020 Side 9 Madan Mohan Malaviya Univ. of Technology, Gorakhpur 3. Creating various types of graphs corresponding to any data (to show different kinds of results and analysis)
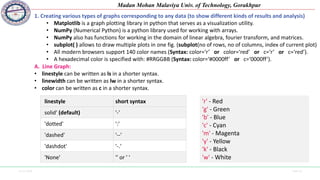
  • 10. 11-11-2020 Side 10 Madan Mohan Malaviya Univ. of Technology, Gorakhpur 1. Creating various types of graphs corresponding to any data (to show different kinds of results and analysis) • Matplotlib is a graph plotting library in python that serves as a visualization utility. • NumPy (Numerical Python) is a python library used for working with arrays. • NumPy also has functions for working in the domain of linear algebra, fourier transform, and matrices. • subplot( ) allows to draw multiple plots in one fig. (subplot(no of rows, no of columns, index of current plot) • All modern browsers support 140 color names (Syntax: color=‘r’ or color=‘red’ or c=‘r’ or c=‘red’). • A hexadecimal color is specified with: #RRGGBB (Syntax: color=‘#0000ff’ or c=‘0000ff’). A. Line Graph: • linestyle can be written as ls in a shorter syntax. • linewidth can be written as lw in a shorter syntax. • color can be written as c in a shorter syntax. linestyle short syntax solid' (default) '-' 'dotted' ':' 'dashed' '--' 'dashdot' '-.' 'None' '' or ' ' 'r' - Red 'g' - Green 'b' - Blue 'c' - Cyan 'm' - Magenta 'y' - Yellow 'k' - Black 'w' - White
  • 11. 11-11-2020 Side 11 Madan Mohan Malaviya Univ. of Technology, Gorakhpur 1. Creating various types of graphs corresponding to any data (to show different kinds of results and analysis) …continued
  • 12. 11-11-2020 Side 12 Madan Mohan Malaviya Univ. of Technology, Gorakhpur 1. Creating various types of graphs corresponding to any data (to show different kinds of results and analysis) …continued B. Bar Graph: • The default width value of the bars is 0.8. • bar ( ) function displays the bar graph vertically and barh( ) function displays the bar graph horizontally.
  • 13. 11-11-2020 Side 13 Madan Mohan Malaviya Univ. of Technology, Gorakhpur 1. Creating various types of graphs corresponding to any data (to show different kinds of results and analysis) …continued
  • 14. 11-11-2020 Side 14 Madan Mohan Malaviya Univ. of Technology, Gorakhpur 1. Creating various types of graphs corresponding to any data (to show different kinds of results and analysis) …continued C. Pie Chart: • By default the plotting of the first wedge starts from the x-axis and move counterclockwise. • pie( ) function is used to draw the pie charts. • pie(populationShare, labelsWedge, colors, startAngle, explode, shadow) • legend(title = "Four Fruits:", loc='lower right') Location String Location Code 'best' 0 'upper right' 1 'upper left' 2 'lower left' 3 'lower right' 4 'right' 5 'center left' 6 'center right' 7 'lower center' 8 'upper center' 9 'center' 10
  • 15. 11-11-2020 Side 15 Madan Mohan Malaviya Univ. of Technology, Gorakhpur 1. Creating various types of graphs corresponding to any data (to show different kinds of results and analysis) …continued
  • 16. 11-11-2020 Side 16 Madan Mohan Malaviya Univ. of Technology, Gorakhpur 1. Creating various types of graphs corresponding to any data (to show different kinds of results and analysis) …continued
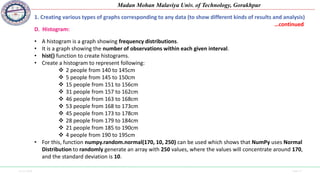
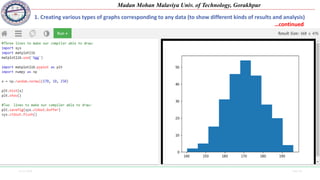
  • 17. 11-11-2020 Side 17 Madan Mohan Malaviya Univ. of Technology, Gorakhpur 1. Creating various types of graphs corresponding to any data (to show different kinds of results and analysis) …continued D. Histogram: • A histogram is a graph showing frequency distributions. • It is a graph showing the number of observations within each given interval. • hist() function to create histograms. • Create a histogram to represent following: ❖ 2 people from 140 to 145cm ❖ 5 people from 145 to 150cm ❖ 15 people from 151 to 156cm ❖ 31 people from 157 to 162cm ❖ 46 people from 163 to 168cm ❖ 53 people from 168 to 173cm ❖ 45 people from 173 to 178cm ❖ 28 people from 179 to 184cm ❖ 21 people from 185 to 190cm ❖ 4 people from 190 to 195cm • For this, function numpy.random.normal(170, 10, 250) can be used which shows that NumPy uses Normal Distribution to randomly generate an array with 250 values, where the values will concentrate around 170, and the standard deviation is 10.
  • 18. 11-11-2020 Side 18 Madan Mohan Malaviya Univ. of Technology, Gorakhpur 1. Creating various types of graphs corresponding to any data (to show different kinds of results and analysis) …continued
  • 19. 11-11-2020 Side 19 Madan Mohan Malaviya Univ. of Technology, Gorakhpur B. Data Analysis
  • 20. 11-11-2020 Side 20 Madan Mohan Malaviya Univ. of Technology, Gorakhpur 1. Understanding problems of data science and machine learning
  • 21. 11-11-2020 Side 21 Madan Mohan Malaviya Univ. of Technology, Gorakhpur 1. Understanding problems of data science and machine learning A. Introduction:
  • 22. 11-11-2020 Side 22 Madan Mohan Malaviya Univ. of Technology, Gorakhpur 1. Understanding problems of data science and machine learning …continued B. Procedure:
  • 23. 11-11-2020 Side 23 Madan Mohan Malaviya Univ. of Technology, Gorakhpur 1. Understanding problems of data science and machine learning …continued C. Applications:
  • 24. 11-11-2020 Side 24 Madan Mohan Malaviya Univ. of Technology, Gorakhpur 1. Understanding problems of data science and machine learning …continued A. Introduction:
  • 25. 11-11-2020 Side 25 Madan Mohan Malaviya Univ. of Technology, Gorakhpur 1. Understanding problems of data science and machine learning …continued B. Relation among AI, ML, NN, and DL:
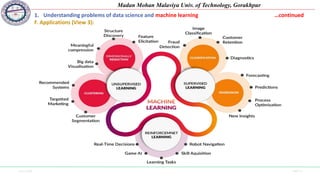
  • 26. 11-11-2020 Side 26 Madan Mohan Malaviya Univ. of Technology, Gorakhpur 1. Understanding problems of data science and machine learning …continued C. Types of ML: •Supervised Learning – Train Me! •Unsupervised Learning – I am self sufficient in learning •Reinforcement Learning – My life My rules! (Hit & Trial)
  • 27. 11-11-2020 Side 27 Madan Mohan Malaviya Univ. of Technology, Gorakhpur 1. Understanding problems of data science and machine learning …continued D. Techniques used in ML:
  • 28. 11-11-2020 Side 28 Madan Mohan Malaviya Univ. of Technology, Gorakhpur 1. Understanding problems of data science and machine learning …continued E. Procedure (View 1) Usually 80% data for training, and 20% data for testing
  • 29. 11-11-2020 Side 29 Madan Mohan Malaviya Univ. of Technology, Gorakhpur 1. Understanding problems of data science and machine learning …continued E. Procedure (View 2)
  • 30. 11-11-2020 Side 30 Madan Mohan Malaviya Univ. of Technology, Gorakhpur 1. Understanding problems of data science and machine learning …continued E. Procedure (View 3)
  • 31. 11-11-2020 Side 31 Madan Mohan Malaviya Univ. of Technology, Gorakhpur 1. Understanding problems of data science and machine learning …continued F. Applications (View 1):
  • 32. 11-11-2020 Side 32 Madan Mohan Malaviya Univ. of Technology, Gorakhpur 1. Understanding problems of data science and machine learning …continued F. Applications (View 2):
  • 33. 11-11-2020 Side 33 Madan Mohan Malaviya Univ. of Technology, Gorakhpur 1. Understanding problems of data science and machine learning …continued F. Applications (View 3):
  • 34. 11-11-2020 Side 34 Madan Mohan Malaviya Univ. of Technology, Gorakhpur 2. Creating codes for data analysis problems in Python
  • 35. 11-11-2020 Side 35 Madan Mohan Malaviya Univ. of Technology, Gorakhpur 2. Creating codes for data analysis problems in Python First of all, import or load the dataset and then analyse it. A. The basic process of loading data from a CSV file with Pandas # Load the Pandas libraries with alias 'pd' import pandas as pd # Read data from file 'filename.csv' (in the same directory) data = pd.read_csv("filename.csv") # Preview the first 5 lines of the loaded data data.head() import pandas filename = ‘indians-diabetes.data.csv' names = ['preg', 'plas', 'pres', 'skin', 'test', 'mass', 'pedi', 'age', 'class'] data = pandas.read_csv(filename, names=names) print(data.shape) OR
  • 36. 11-11-2020 Side 36 Madan Mohan Malaviya Univ. of Technology, Gorakhpur 2. Creating codes for data analysis problems in Python …continued C. The basic process of loading data from a CSV file with Python Standard Library B. The basic process of loading data from a CSV file with NumPy import numpy filename = 'indians-diabetes.data.csv' raw_data = open(filename, 'rt') data = numpy.loadtxt(raw_data, delimiter=",") print(data.shape) import csv import numpy filename = 'indians-diabetes.data.csv' raw_data = open(filename, 'rt') reader = csv.reader(raw_data, delimiter=‘,’ , quoting=csv.QUOTE_NONE) x = list(reader) data = numpy.array(x).astype('float') print(data.shape)
  • 37. 11-11-2020 Side 37 Madan Mohan Malaviya Univ. of Technology, Gorakhpur 2. Creating codes for data analysis problems in Python …continued D. Data Analysis
  • 38. 11-11-2020 Side 38 Madan Mohan Malaviya Univ. of Technology, Gorakhpur 3. Other advance programs
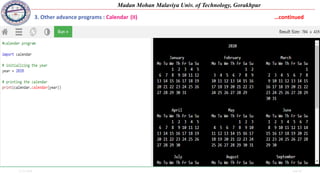
  • 39. 11-11-2020 Side 39 Madan Mohan Malaviya Univ. of Technology, Gorakhpur 3. Other advance programs: Calendar (I)
  • 40. 11-11-2020 Side 40 Madan Mohan Malaviya Univ. of Technology, Gorakhpur 3. Other advance programs : Calendar (II) …continued
  • 41. 11-11-2020 Side 41 Madan Mohan Malaviya Univ. of Technology, Gorakhpur 3. Other advance programs: Calculator …continued https://data-flair.s3.ap-south-1.amazonaws.com/python-projects/dataflair-python-calculator.zip
  • 42. 11-11-2020 Side 42 Madan Mohan Malaviya Univ. of Technology, Gorakhpur 3. Other advance programs: Currency Converter …continued https://data-flair.s3.ap-south-1.amazonaws.com/python-projects/currency-converter-project.zip
  • 43. 11-11-2020 Side 43 Madan Mohan Malaviya Univ. of Technology, Gorakhpur 3. Other advance programs: Music Player …continued https://project-gurukul.s3.ap-south-1.amazonaws.com/python-projects/music-player-python.zip
  • 44. 11-11-2020 Side 44 Madan Mohan Malaviya Univ. of Technology, Gorakhpur 3. Other advance programs: Alarm Clock …continued https://data-flair.s3.ap-south-1.amazonaws.com/python-projects/DataFlair-Alarm-Clock.zip