Basic tutorial for R programming. this video contains lot of information about r programming like
agenda
history
SOFTWARE PARADIGM
R interface
advantages of r
drawbacks of r
The goal of this workshop is to introduce fundamental capabilities of R as a tool for performing data analysis. Here, we learn about the most comprehensive statistical analysis language R, to get a basic idea how to analyze real-word data, extract patterns from data and find causality.
This document provides an introduction to using R Studio for statistical analysis. It discusses how to install both R and R Studio on Windows and Mac systems. It then covers creating scripts and files in R Studio, basic R syntax including assigning values to variables, vectors, and strings. The document also demonstrates how to install and load packages to access additional functions, and how to access built-in datasets to practice working with data in R.
R originated in the 1970s at Bell Labs and has since evolved significantly. It is an open-source programming language used widely for statistical analysis and graphics. While powerful, R has some drawbacks like poor performance for large datasets and a steep learning curve. However, its key advantages including being free, having a large community of users, and extensive libraries have made it a popular tool, especially for academic research.
This document provides an introduction to R, including what R is, how it compares to other statistical software packages, its advantages and disadvantages, how to install R, and options for R editors and graphical user interfaces (GUIs). It discusses R as a language for statistical computing and graphics, compares it to packages like SAS, Stata, and SPSS in terms of cost, usage mode, and prevalence. It outlines some of R's advantages like being free and open-source software with an active user community contributing packages, and some disadvantages like the learning curve and lack of a standard GUI.
This document provides an overview of R programming. It discusses the history and introduction of R, how to install R and R packages, key features of R including data handling and graphics, advantages such as being free and open source, and disadvantages such as average memory performance. It also outlines some real-world applications of R programming and predicts its continued importance in fields like data science, finance, and analytics.
R is a programming language and environment for statistical analysis and graphics. It has many built-in statistical and graphical techniques. R can be installed from CRAN and runs on Windows, MacOS, and UNIX systems. The basic R interface is the console, but RStudio provides an integrated development environment. In RStudio, you can write scripts, see outputs and plots, and access help and packages. Packages extend R's functionality through additional functions and data. Common data types in R include numeric, integer, character, factor, and logical. Vectors are the basic data structure, but R also supports matrices, arrays, data frames and lists.
The presentation is a brief case study of R Programming Language. In this, we discussed the scope of R, Uses of R, Advantages and Disadvantages of the R programming Language.
This hands-on R course will guide users through a variety of programming functions in the open-source statistical software program, R. Topics covered include indexing, loops, conditional branching, S3 classes, and debugging. Full workshop materials available from http://projects.iq.harvard.edu/rtc/r-prog
The R language is a project designed to create a free, open source language which can be used as a replacement for the S-PLUS language, originally developed as the S language at AT&T Bell Labs, and currently marketed by Insightful Corporation of Seattle, Washington. R is an open source implementation of S, and differs from S-plus largely in its command-line only format.
Topics Covered:
1.Introduction to R
2.Installing R
3.Why Learn R
4.The R Console
5.Basic Arithmetic and Objects
6.Program Example
7.Programming with Big Data in R
8.Big Data Strategies in R
9.Applications of R Programming
10.Companies Using R
11.What R is not so good at
12.Conclusion
This presentation discusses the following topics:
Basic features of R
Exploring R GUI
Data Frames & Lists
Handling Data in R Workspace
Reading Data Sets & Exporting Data from R
Manipulating & Processing Data in R
This document provides an overview of SPSS and how to perform basic analyses in it. It discusses the four main windows in SPSS: the data editor, output viewer, syntax editor, and script window. It then covers how to open and manage data files, define variables, sort and transform data. The document concludes by demonstrating how to conduct frequency analyses, descriptive statistics, linear regression analyses, and plot regression lines in SPSS through both the graphical user interface and syntax editor.
SPSS is a statistical software package used for data management and analysis. It allows users to enter and manage large amounts of data, perform a wide range of statistical analyses, and output results in tables and graphs. The main SPSS windows are the Data Editor, used to enter and view data, and the Viewer, which displays output of statistical analyses. Common analysis techniques demonstrated in the document include independent and paired t-tests to compare group means. The document provides guidance on using SPSS for questionnaire design and statistical analysis to efficiently analyze social science and business data.
This document discusses R data types. It explains that in R, variables are assigned objects that determine the data type. The main data types covered are scalars, vectors, matrices, factors, data frames, and lists. Vectors store one-dimensional arrays, matrices are two-dimensional arrays of the same type, factors represent categorical variables, data frames contain different data types, and lists store ordered collections of varied objects. Examples are provided for creating each type of data structure in R.
R is a language and environment for statistical computing and graphics. It provides a wide variety of statistical techniques including modeling, classical tests, time series analysis, and more. R can be considered an implementation of S and compiles on various platforms. PCA is used to select two best graduate students from four applicants. It finds principal components from the data to reduce dimensions without losing information. Based on the first principal component, students 2 and 3 would be selected.
It covers- Introduction to R language, Creating, Exploring data with Various Data Structures e.g. Vector, Array, Matrices, and Factors. Using Methods with examples.
This document provides an introduction to using R for data science and analytics. It discusses what R is, how to install R and RStudio, statistical software options, and how R can be used with other tools like Tableau, Qlik, and SAS. Examples are given of how R is used in government, telecom, insurance, finance, pharma, and by companies like ANZ bank, Bank of America, Facebook, and the Consumer Financial Protection Bureau. Key statistical concepts are also refreshed.
'Business Analytics with 'R' at Edureka will prepare you to perform analytics and build models for real world data science problems. It is the world’s most powerful programming language for statistical computing and graphics making it a must know language for the aspiring Data Scientists. 'R' wins strongly on Statistical Capability, Graphical capability, Cost and rich set of packages.
This document provides an overview of using SPSS to analyze data. It discusses opening data files in SPSS, viewing the data, entering new data values, setting up variable properties like name, type, and label. It also covers running frequency analyses and descriptive statistics, computing new variables, and concludes that SPSS is a powerful tool for statistical analysis.
The document provides instructions for launching and using the statistical software SPSS. It discusses finding the SPSS icon on the computer and launching the program. Once SPSS is open, the user can start a new data file or open an existing one. Basic steps for using SPSS are outlined, including entering data, defining variables, testing for normality, statistical analysis, and interpreting results. Specific functions and menus in SPSS are demonstrated for descriptive statistics, normality testing, and t-tests.
The document provides information about data analytics using R. It discusses how R is a widely used open-source statistical programming language and software environment for data analysis and visualization. It also discusses key concepts in R like importing and transforming data, conducting statistical analysis through functions like mean, median, and plotting graphs. The document further explains important R packages like dplyr for data manipulation and clustering algorithms for analyzing hidden patterns in data. Finally, it mentions some example projects and applications of R in areas like psychology, business, and machine learning.
This document discusses data visualization tools in Python. It introduces Matplotlib as the first and still standard Python visualization tool. It also covers Seaborn which builds on Matplotlib, Bokeh for interactive visualizations, HoloViews as a higher-level wrapper for Bokeh, and Datashader for big data visualization. Additional tools discussed include Folium for maps, and yt for volumetric data visualization. The document concludes that Python is well-suited for data science and visualization with many options available.
R as supporting tool for analytics and simulationAlvaro Gil
R is a popular open-source language and environment for statistical analysis and visualization. It allows users to perform a wide range of statistical and predictive modeling techniques on data. Many companies use R as their standard tool for analytics due to its extensive library of packages and ability to handle large datasets. R can interface with other languages and platforms, making it a versatile scripting language for data science tasks.
R is a programming language and environment for statistical analysis and graphics. It provides tools for data analysis, visualization, and machine learning. Some key features include statistical functions, graphics, probability distributions, data analysis tools, and the ability to access over 10,000 add-on packages. R can be used across platforms like Windows, Linux, and macOS. It is widely used for complex data analysis in data science and research.
R is a programming language and software environment for statistical analysis and graphics. It is widely used among statisticians and data scientists. R was created by Ross Ihaka and Robert Gentleman in the early 1990s and is currently developed by the R Core Team. Key features of R include its use as a programming language, effective data handling and storage, graphical display capabilities, and large collection of statistical and machine learning packages. R is open source, has a large user community, and is often used for statistical analysis, data mining, and creating statistical graphics.
R is an open source programming language used for data science and statistical computing. The document discusses the basics of R programming including data types, operators, control structures, functions, and data frames. It also covers R libraries, graphics, statistical analysis techniques, and how to import and export data. R can be used for tasks like classification, time series analysis, clustering, modeling, and creating visualizations. It is available free of charge and can be integrated with other programming languages.
This document discusses the programming language R and reasons for learning and using it. R is a statistical computing language that is open-source, cross-platform, and has powerful tools for data analysis, machine learning, and visualization. It has a large user community and is used by many top companies for tasks like advertising effectiveness analysis and data visualization. While R has a steep learning curve and requires more memory than some other languages, learning R provides access to cutting-edge algorithms and is valuable for mastering data science and working with large datasets. The document concludes that R offers immense benefits and tools to work with data at scale, making it a good choice for both technical fields and business applications.
Presentation given by US Chief Scientist, Mario Inchiosa, at the June 2013 Hadoop Summit in San Jose, CA.
ABSTRACT: Hadoop is rapidly being adopted as a major platform for storing and managing massive amounts of data, and for computing descriptive and query types of analytics on that data. However, it has a reputation for not being a suitable environment for high performance complex iterative algorithms such as logistic regression, generalized linear models, and decision trees. At Revolution Analytics we think that reputation is unjustified, and in this talk I discuss the approach we have taken to porting our suite of High Performance Analytics algorithms to run natively and efficiently in Hadoop. Our algorithms are written in C++ and R, and are based on a platform that automatically and efficiently parallelizes a broad class of algorithms called Parallel External Memory Algorithms (PEMA’s). This platform abstracts both the inter-process communication layer and the data source layer, so that the algorithms can work in almost any environment in which messages can be passed among processes and with almost any data source. MPI and RPC are two traditional ways to send messages, but messages can also be passed using files, as in Hadoop. I describe how we use the file-based communication choreographed by MapReduce and how we efficiently access data stored in HDFS.
R is a popular programming language for statistical analysis and visualization. It can be used with RStudio, a popular integrated development environment (IDE). The document outlines how to install R and RStudio on Windows, describes their interfaces, and provides an overview of R's features including its applications in fields like statistics, data science, and more. It also briefly discusses R alternatives and companies that use R.
R is an open-source programming language and software environment for statistical analysis, graphics, and statistical computing. It was originally developed in the early 1990s at the University of Auckland in New Zealand. The document discusses R's history and development, how to obtain R, its key features and specialties compared to other analytics software like SAS, SPSS, Stata, and Matlab. It summarizes surveys and comparisons of R's popularity in terms of downloads, number of users, email discussions, scholarly impact, and job opportunities. R is highlighted as having a large library of packages for statistical analysis, flexible and elegant data visualization capabilities, and an active open-source community of contributors and users.
R is a free and widely used program for statistical analysis that allows users to analyze data, create publication quality graphs, and utilize pre-existing packages to analyze different types of data through an importable coding language; while it has a learning curve, R has a large community of support and resources and is able to handle large data sets for most purposes; the document provides information on downloading and using basic functions in R as well as helpful links and tutorials for learning R.
This document outlines an R crash course to teach the basics of R to beginners in a short period of time. The course will cover installing R software, scripting in R, working with spatial data in R, and linking R with other programs like SAGA GIS. The document discusses what R is, why it is useful for data analysis and popular in the statistics community, and some assumptions about the course participants and format.
An introduction to R is a document usefulssuser3c3f88
R is a language and environment for statistical computing and graphics. It provides functions for data manipulation, calculation, and graphical displays. Key features of R include its ability to produce publication-quality plots, perform statistical tests, fit models to data, and develop statistical software. R has an extensive library of additional user-contributed packages that extend its capabilities. The document provides information on downloading and using R, reading data into R, customizing plots, and interactive plotting functions.
Introduction to R for Learning Analytics ResearchersVitomir Kovanovic
The slides from my 2hr tutorial organised at 2018 Learning Analytics Summer Institute (LASI) at Teachers College, Columbia University on June 11, 2018.
Data Science - Part II - Working with R & R studioDerek Kane
This tutorial will go through a basic primer for individuals who want to get started with predictive analytics through downloading the open source (FREE) language R. I will go through some tips to get up and started and building predictive models ASAP.
R is a popular open-source statistical programming language and software environment for predictive analytics. It has a large community and ecosystem of packages that allow data scientists to solve various problems. Microsoft R Server is a scalable platform that allows R to handle large datasets beyond memory capacity by distributing computations across nodes in a cluster and storing data on disk in efficient column-based formats. It provides high performance through parallelization and rewriting algorithms in C++.
This document provides an overview of a 6-week business analytics course that uses R. The course includes live online sessions, assignments, projects, and a final exam. Topics covered include introduction to business analytics, data science, R, data import, manipulation, quality, visualization, and modeling in R. The course methodology involves explaining business analytics problems and tools, the history and usage of R in corporations, comparing R to other software, and installing R and packages.
This document provides an introduction to the R programming language. It discusses reasons for using R such as its free and open-source nature, wide range of analysis methods, and growing popularity. It also covers basic R concepts like data frames, metadata, packages, and functions. The document emphasizes that R allows outputs from functions to be reused as inputs for other functions, and discusses saving and loading workspaces, managing directories, and redirecting output and graphs.
AWS Training Institute in Bangalore | Best AWS Course In BangaloreTIB Academy
TIB Academy is the best AWS Training Institute in Bangalore offering cloud computing courses like Amazon Web Services Solution Architect, AWS Developer, and AWS Sysops Admin with AWS certification assistance. We offer AWS classroom training and AWS online training based on the student's availability.( https://www.traininginbangalore.com/aws-training-in-bangalore/ )
MySQL training in Bangalore | Best MySQL Course in BangaloreTIB Academy
TIB Academy is the best place to learn MySQL where you can get training from SQL introduction until SQL certification support. We also offer training for various database courses like MySQL, MS SQL Server, Oracle and few more Database technologies. Contact us to get the best MySQL Training in Bangalore
CCNA Training in Bangalore | Best Networking course in BangaloreTIB Academy
At TIB Academy, you will get the best CCNA training in Bangalore. To clear Cisco CCNA Certification, you need to be very good in basic networking concepts like network topology and network layers. So, enroll in our Networking Course immediately to get the best CCNA training and certification assistance
Core Java Training in Bangalore | Best Core Java Class in BangaloreTIB Academy
This document provides an overview of topics covered in a Core Java training course, including Java basics, classes and objects, strings and arrays, packages, inheritance and interfaces, exceptions, Java Database Connectivity (JDBC), collections and generics, streams, files, and serialization. It also describes assessments, assignments, tasks, and resume/interview preparation activities to reinforce learning.
Advance Java Training in Bangalore | Best Java Training Institute TIB Academy
TIB Academy is the best Java training institute in Bangalore for the working Java professionals. Learn Advanced Java from our course curriculum which includes J2EE, JSP, Spring, Spring Boot MicroServices and Hibernate. This can be pursued by people who are already familiar with Core Java. It goes well with Oracle.
Best Hadoop Training in Bangalore - TIB AcademyTIB Academy
We are one of the Leading Hadoop training institutes in Bangalore. Hadoop is a Bigdata technology. Hadoop training in bangalore content is updated above.
TIB Academy is one of the best Selenium testing training institutes in Bangalore, where you can gain complete confidence from our experts who are dedicated and passionate towards teaching. Selenium is an open source, portable and platform independent testing tool which is used to detect errors and to automate the online web applications. This is one of the automation testing training courses in Bangalore. Selenium comprises of Selenium core, Selenium IDE, Selenium webdriver, Selenium RC and Selenium grid. It can be implemented in the following programming languages such as Java, Ruby, Python. Php, .Net, and C#. It supports distributed and multiple testing which can be performed simultaneously. As this tool is easily navigable, it also can be used to test mobile devices.
Python is an open source, highly interactive, object oriented, interpreted, easy programming language powered by Python Software Foundation PSF. It can be easily integrated to various IT fields such as web application programming, automation scripting, data science, machine learning, mathematical computing
TIB Academy provides best Oracal DBA classes in BangaloreTIB Academy
TIB Academy is the best Oracle DBA Training Institute in Bangalore. Oracle® is a multi-platform and evergreen database technology where we can apply our own business logic and syntax to build a DB application. This tool is primarily used for its high performance and key features such as massive storage (high availability), multi-parallelism and scalability.
Oracle has become more popular nowadays, because this DB is utilized to handle many RDBMS issues. So, there is a high demand for Oracle experts in current IT market. Before proceeding to the Oracle DBA course, some exposure to key concepts of database like basics of RDBMS, DB tuning, DB scaling, SQL knowledge and troubleshooting skills will be added advantage. Oracle Database Administrator is one of the highly stable roles in IT world as “Data” is playing a lead role of every small-scale and large-scale organization.
We are the best Oracle DBA training institute in Bangalore, where you can obtain the real-time, practical and live-classroom coaching from industrial experts. TIB Academy is the No.1 Oracle DBA institute in Marathahalli that offers high quality training with affordable course fees in Bangalore. Our Oracle DBA training course syllabus is designed by highly experienced professionals. They will help you to become a seasoned DBA within a short duration.
java tutorial for beginner - Free DownloadTIB Academy
TIB Academy offering Java tutorial with fundamental for beginner This Java Tutorial going to explain about the fundamentals of Core Java Concepts, you can download Java tutorial as PPT for free of cost
Aws tutorial for beginners- tibacademy.inTIB Academy
This document provides an overview of Amazon Web Services (AWS) including key services like Amazon Elastic Compute Cloud (EC2), Amazon Simple Storage Service (S3), and Amazon Simple Queue Service (SQS). It describes how AWS services can be used to build scalable applications and discusses common concepts like virtual servers, storage options, and security configurations. Examples are given around hosting applications in AWS and using services like S3, EC2, and CloudFront for storage, compute, and content delivery needs.
Java tutorial for beginners-tibacademy.inTIB Academy
TIB Academy is the best java training institute in Bangalore. Our Tutors will motivate you to learn and Practice on Object Oriented Programming Structures, I/O Streams, Collections, API Packages and so on.
Android tutorial for beginners-traininginbangalore.comTIB Academy
The document provides an overview of Android application development including:
1) A brief history of Android and its development as an open source platform.
2) An overview of the Android architecture including its use of Java, activities, services, and other components.
3) A guide to setting up the Android development environment in Eclipse including installing SDKs, creating Android virtual devices, and developing a sample GPS tracking application.
Hadoop tutorial for beginners-tibacademy.inTIB Academy
TIB Academy is one of the best Hadoop training institute in Bangalore. Bigdata-Hadoop is an trendy technology which is used to handle massive data and to gain clear understanding on each and every customers and competitors in the real world scenario.
TIB Academy Provides Best SoapUI Training in bangalore. This video contains following topics,
request / response
BPEL Module
XML Schema
WSDL Document
Test and Deploy
visual JSF Designer
This tutorial from TIB acdaemy is useful for both Beginners and experienced persons. this tutorial covers,
spring web stck
MVC
web frameworks
context
urlrewrite
mapping
rest
Http methods
page
handler
return types
TIB academy Offers Salesforce certification training. In this video contains
salesforce program
Adminitrator
Cloud Consultant
platform app builder
Pardot Consultant
Social specialist
juggernuat
A measles outbreak originating in West Texas has been linked to confirmed cases in New Mexico, with additional cases reported in Oklahoma and Kansas. The current case count is 817 from Texas, New Mexico, Oklahoma, and Kansas. 97 individuals have required hospitalization, and 3 deaths, 2 children in Texas and one adult in New Mexico. These fatalities mark the first measles-related deaths in the United States since 2015 and the first pediatric measles death since 2003.
The YSPH Virtual Medical Operations Center Briefs (VMOC) were created as a service-learning project by faculty and graduate students at the Yale School of Public Health in response to the 2010 Haiti Earthquake. Each year, the VMOC Briefs are produced by students enrolled in Environmental Health Science Course 581 - Public Health Emergencies: Disaster Planning and Response. These briefs compile diverse information sources – including status reports, maps, news articles, and web content– into a single, easily digestible document that can be widely shared and used interactively. Key features of this report include:
- Comprehensive Overview: Provides situation updates, maps, relevant news, and web resources.
- Accessibility: Designed for easy reading, wide distribution, and interactive use.
- Collaboration: The “unlocked" format enables other responders to share, copy, and adapt seamlessly. The students learn by doing, quickly discovering how and where to find critical information and presenting it in an easily understood manner.
CURRENT CASE COUNT: 817 (As of 05/3/2025)
• Texas: 688 (+20)(62% of these cases are in Gaines County).
• New Mexico: 67 (+1 )(92.4% of the cases are from Eddy County)
• Oklahoma: 16 (+1)
• Kansas: 46 (32% of the cases are from Gray County)
HOSPITALIZATIONS: 97 (+2)
• Texas: 89 (+2) - This is 13.02% of all TX cases.
• New Mexico: 7 - This is 10.6% of all NM cases.
• Kansas: 1 - This is 2.7% of all KS cases.
DEATHS: 3
• Texas: 2 – This is 0.31% of all cases
• New Mexico: 1 – This is 1.54% of all cases
US NATIONAL CASE COUNT: 967 (Confirmed and suspected):
INTERNATIONAL SPREAD (As of 4/2/2025)
• Mexico – 865 (+58)
‒Chihuahua, Mexico: 844 (+58) cases, 3 hospitalizations, 1 fatality
• Canada: 1531 (+270) (This reflects Ontario's Outbreak, which began 11/24)
‒Ontario, Canada – 1243 (+223) cases, 84 hospitalizations.
• Europe: 6,814
pulse ppt.pptx Types of pulse , characteristics of pulse , Alteration of pulsesushreesangita003
what is pulse ?
Purpose
physiology and Regulation of pulse
Characteristics of pulse
factors affecting pulse
Sites of pulse
Alteration of pulse
for BSC Nursing 1st semester
for Gnm Nursing 1st year
Students .
vitalsign
As of Mid to April Ending, I am building a new Reiki-Yoga Series. No worries, they are free workshops. So far, I have 3 presentations so its a gradual process. If interested visit: https://www.slideshare.net/YogaPrincess
https://ldmchapels.weebly.com
Blessings and Happy Spring. We are hitting Mid Season.
GDGLSPGCOER - Git and GitHub Workshop.pptxazeenhodekar
This presentation covers the fundamentals of Git and version control in a practical, beginner-friendly way. Learn key commands, the Git data model, commit workflows, and how to collaborate effectively using Git — all explained with visuals, examples, and relatable humor.
How to Customize Your Financial Reports & Tax Reports With Odoo 17 AccountingCeline George
The Accounting module in Odoo 17 is a complete tool designed to manage all financial aspects of a business. Odoo offers a comprehensive set of tools for generating financial and tax reports, which are crucial for managing a company's finances and ensuring compliance with tax regulations.
K12 Tableau Tuesday - Algebra Equity and Access in Atlanta Public Schoolsdogden2
Algebra 1 is often described as a “gateway” class, a pivotal moment that can shape the rest of a student’s K–12 education. Early access is key: successfully completing Algebra 1 in middle school allows students to complete advanced math and science coursework in high school, which research shows lead to higher wages and lower rates of unemployment in adulthood.
Learn how The Atlanta Public Schools is using their data to create a more equitable enrollment in middle school Algebra classes.
A measles outbreak originating in West Texas has been linked to confirmed cases in New Mexico, with additional cases reported in Oklahoma and Kansas. The current case count is 795 from Texas, New Mexico, Oklahoma, and Kansas. 95 individuals have required hospitalization, and 3 deaths, 2 children in Texas and one adult in New Mexico. These fatalities mark the first measles-related deaths in the United States since 2015 and the first pediatric measles death since 2003.
The YSPH Virtual Medical Operations Center Briefs (VMOC) were created as a service-learning project by faculty and graduate students at the Yale School of Public Health in response to the 2010 Haiti Earthquake. Each year, the VMOC Briefs are produced by students enrolled in Environmental Health Science Course 581 - Public Health Emergencies: Disaster Planning and Response. These briefs compile diverse information sources – including status reports, maps, news articles, and web content– into a single, easily digestible document that can be widely shared and used interactively. Key features of this report include:
- Comprehensive Overview: Provides situation updates, maps, relevant news, and web resources.
- Accessibility: Designed for easy reading, wide distribution, and interactive use.
- Collaboration: The “unlocked" format enables other responders to share, copy, and adapt seamlessly. The students learn by doing, quickly discovering how and where to find critical information and presenting it in an easily understood manner.
CBSE - Grade 8 - Science - Chemistry - Metals and Non Metals - WorksheetSritoma Majumder
Introduction
All the materials around us are made up of elements. These elements can be broadly divided into two major groups:
Metals
Non-Metals
Each group has its own unique physical and chemical properties. Let's understand them one by one.
Physical Properties
1. Appearance
Metals: Shiny (lustrous). Example: gold, silver, copper.
Non-metals: Dull appearance (except iodine, which is shiny).
2. Hardness
Metals: Generally hard. Example: iron.
Non-metals: Usually soft (except diamond, a form of carbon, which is very hard).
3. State
Metals: Mostly solids at room temperature (except mercury, which is a liquid).
Non-metals: Can be solids, liquids, or gases. Example: oxygen (gas), bromine (liquid), sulphur (solid).
4. Malleability
Metals: Can be hammered into thin sheets (malleable).
Non-metals: Not malleable. They break when hammered (brittle).
5. Ductility
Metals: Can be drawn into wires (ductile).
Non-metals: Not ductile.
6. Conductivity
Metals: Good conductors of heat and electricity.
Non-metals: Poor conductors (except graphite, which is a good conductor).
7. Sonorous Nature
Metals: Produce a ringing sound when struck.
Non-metals: Do not produce sound.
Chemical Properties
1. Reaction with Oxygen
Metals react with oxygen to form metal oxides.
These metal oxides are usually basic.
Non-metals react with oxygen to form non-metallic oxides.
These oxides are usually acidic.
2. Reaction with Water
Metals:
Some react vigorously (e.g., sodium).
Some react slowly (e.g., iron).
Some do not react at all (e.g., gold, silver).
Non-metals: Generally do not react with water.
3. Reaction with Acids
Metals react with acids to produce salt and hydrogen gas.
Non-metals: Do not react with acids.
4. Reaction with Bases
Some non-metals react with bases to form salts, but this is rare.
Metals generally do not react with bases directly (except amphoteric metals like aluminum and zinc).
Displacement Reaction
More reactive metals can displace less reactive metals from their salt solutions.
Uses of Metals
Iron: Making machines, tools, and buildings.
Aluminum: Used in aircraft, utensils.
Copper: Electrical wires.
Gold and Silver: Jewelry.
Zinc: Coating iron to prevent rusting (galvanization).
Uses of Non-Metals
Oxygen: Breathing.
Nitrogen: Fertilizers.
Chlorine: Water purification.
Carbon: Fuel (coal), steel-making (coke).
Iodine: Medicines.
Alloys
An alloy is a mixture of metals or a metal with a non-metal.
Alloys have improved properties like strength, resistance to rusting.
Understanding P–N Junction Semiconductors: A Beginner’s GuideGS Virdi
Dive into the fundamentals of P–N junctions, the heart of every diode and semiconductor device. In this concise presentation, Dr. G.S. Virdi (Former Chief Scientist, CSIR-CEERI Pilani) covers:
What Is a P–N Junction? Learn how P-type and N-type materials join to create a diode.
Depletion Region & Biasing: See how forward and reverse bias shape the voltage–current behavior.
V–I Characteristics: Understand the curve that defines diode operation.
Real-World Uses: Discover common applications in rectifiers, signal clipping, and more.
Ideal for electronics students, hobbyists, and engineers seeking a clear, practical introduction to P–N junction semiconductors.
World war-1(Causes & impacts at a glance) PPT by Simanchala Sarab(BABed,sem-4...larencebapu132
This is short and accurate description of World war-1 (1914-18)
It can give you the perfect factual conceptual clarity on the great war
Regards Simanchala Sarab
Student of BABed(ITEP, Secondary stage)in History at Guru Nanak Dev University Amritsar Punjab 🙏🙏
*Metamorphosis* is a biological process where an animal undergoes a dramatic transformation from a juvenile or larval stage to a adult stage, often involving significant changes in form and structure. This process is commonly seen in insects, amphibians, and some other animals.
Exploring Substances:
Acidic, Basic, and
Neutral
Welcome to the fascinating world of acids and bases! Join siblings Ashwin and
Keerthi as they explore the colorful world of substances at their school's
National Science Day fair. Their adventure begins with a mysterious white paper
that reveals hidden messages when sprayed with a special liquid.
In this presentation, we'll discover how different substances can be classified as
acidic, basic, or neutral. We'll explore natural indicators like litmus, red rose
extract, and turmeric that help us identify these substances through color
changes. We'll also learn about neutralization reactions and their applications in
our daily lives.
by sandeep swamy
How to Set warnings for invoicing specific customers in odooCeline George
Odoo 16 offers a powerful platform for managing sales documents and invoicing efficiently. One of its standout features is the ability to set warnings and block messages for specific customers during the invoicing process.
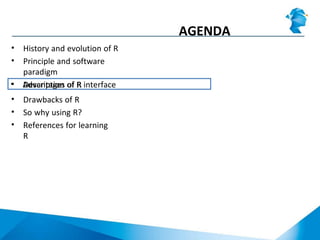
2. AGENDA
• History and evolution of R
• Principle and software
paradigm
• Description of R interface
• Advantages of R
• Drawbacks of R
• So why use R?
• References for learning R
4. R has developed from the S language
HISTORY AND EVOLUTION OF R
S Version 1
S Version 2
S Version 3
S Version 4
Developed 30 years ago for
research
applied to the high-tech industry
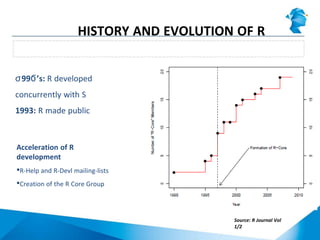
5. 99 ’s:ϭ Ϭ R developed
concurrently with S
1993: R made public
The regular development of R
HISTORY AND EVOLUTION OF R
Acceleration of R
development
R-Help and R-Devl mailing-lists
Creation of the R Core Group
Source: R Journal Vol
1/2
6. Growing number of packages
HISTORY AND EVOLUTION OF R
2001: ~100 packages
2009: Over 2000
packages
Source: R Journal Vol
1/2
2000: R version 1.0.1
Today: R version
2.14
7. Explosion of R popularity in the last decade
HISTORY AND EVOLUTION OF R
Object-oriented, growing user base, scripting
features
Free and open-source
Irrational reasons: R seen as « cool »
10. Number of Blogs
HISTORY AND EVOLUTION OF R
Data as on Mar
2012
Software Number of Blogs
R 365
SAS 40
Stata 8
Others 0-3
11. AGENDA
• History and evolution of
R• Principle and software paradigm
• Description of R
interface
• Advantages of R
• Drawbacks of R
• So why using R?
• References for learning R
12. R is rather a programming language
Limited user-friendly interfaces for data analysis
Is object oriented and almost non declarative
Similar to programming languages like Fortran, C, Java,
Python
R is not really a (statistical) software
PRINCIPLE AND SOFTWARE
PARADIGM
13. Recent endeavours to enhance R user-
friendliness Several GUIs in development
R-commander
RKWard
Rattle
R has limited Graphical User Interface (GUI) options
PRINCIPLE AND SOFTWARE
PARADIGM
19. AGENDA
• History and evolution of R
• Principle and software
paradigm• Description of R interface
• Advantages of R
• Drawbacks of R
• So why using R?
• References for learning
R
20. R console
DESCRIPTION OF R INTERFACE
R desktop
shortcut
RGui: R basic
interface
R command
line (space to
write
instructions)
21. Using the command line in R console
DESCRIPTION OF R INTERFACE
First false
sentence followed
by R’s error
message
Second correct
sentence
Declaration and
printing of the
sentence as a R
object
Simple math
computations
Basic information
about the R object
containing the
sentence
22. RGui menu: File tab
DESCRIPTION OF R INTERFACE
File tab: Usual
basic and general
operations
23. RGui menu: Edit tab
DESCRIPTION OF R INTERFACE
Edit tab: basic
and general
editing
Results of
the
data editor
Data editor:
entering the
oďjeĐt’s
name
24. RGui menu: View tab
DESCRIPTION OF R INTERFACE
View tab:
viewing Toolbar
and/or Status bar
25. RGui menu: Misc tab
DESCRIPTION OF R INTERFACE
Misc tab:
diverse
operation
s
26. RGui menu: Packages tabs
DESCRIPTION OF R INTERFACE
Packages tab:
adding functions
to R foundation
27. RGui menu: Windows tab
DESCRIPTION OF R INTERFACE
Windows tab:
usual options
to arrange the
tiles
28. RGui menu: Help tab
DESCRIPTION OF R INTERFACE
Help tab: very
important
links to help
29. AGENDA
• History and evolution of R
• Principle and software
paradigm
• Description of R interface• Advantages of R
• Drawbacks of R
• So why using R?
• References for learning
R
30. Open source code
You can access the code of the
software
In-depth understanding of what R does
Modify the code
ADVANTAGES OF R
Adress of the
« mgcv » package
Link with Package sources (.tar.gz file)
Screenshot of the CRAN webpage of the « mgcv » package. Source: CRAN
31. R access to source code
ADVANTAGES OF R
Screenshot of unzipping the « mgcv » package and browsing through the package’s
files.
Unzipping
mgcv_1.7-
13.tar.gzfile (with 7zip)
List of
directories in the
« mgcv »
package
List of functions (i.e
open code) in the « src
» (i.e code sources)
directory the « mgcv »
package1 2 3
32. R is free
ADVANTAGES OF R
Software Academics Demo Commercial
(basic)
Commercial (full)
R Free Free Free Free
SAS Free to $100s Not available $1 000s $10 000s
Statistica $100s 30 days limit ~$1 000 $10 000
Excel
(Microsoft)
Free to $10s Limited ~$100 $100s
SPSS (IBM) $100s 14 days limit ~$2 000 $1 000s
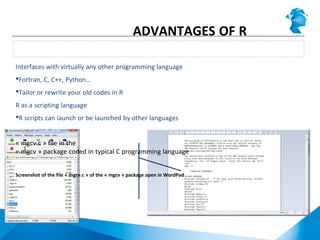
33. Interface with other languages and scripting capabilities
ADVANTAGES OF R
Interfaces with virtually any other programming language
Fortran, C, C++, Python…
Tailor or rewrite your old codes in R
R as a scripting language
R scripts can launch or be launched by other languages
« mgcv.c » file in the
« mgcv » package coded in typical C programming language
Screenshot of the file « mgcv.c » of the « mgcv » package open in WordPad
37. R ~ tool used by the finest
researchers
Top-notch analytics capabilities
R role in academia
ADVANTAGES OF R
38. Free open source philosophy
To summarize
ADVANTAGES OF R
R websites with many
examples
Free books
Free online open courses
Twitter accounts
Online help and discussion
Mailing-lists
Very active and diverse forums
Communities of developers and
helpers
39. AGENDA
• History and evolution of R
• Principle and software
paradigm
• Description of R interface
• Advantages of R• Drawbacks of R
• So why using R?
• References for learning
R
40. Poor management of large datasets
Avoid imbricated loops
Prefer R advanced language for data structure
Complicated structure of packages in R
Dozen of packages
To be loaded every time in memory
R packages to better manage memory
Rhadoop (inspiration from Google)
Ff
bigmemory
Average memory performance
DRAWBACKS OF R
41. No default parallel execution
R packages to use several cores
Top skills needed for high performance computing
A high-level programming language
Abstract and modern (Python…Ϳ
More productive coding
But further from « machine language »…
… meaning 100 times slower than C
Average computing performance
DRAWBACKS OF R
42. Difficult to inspect data
sets
Difficult data visualization and management
DRAWBACKS OF R
43. Problems for large organizations
R made of several thousands independent packages
No deployment plan for complex organizations
No installation support
Lack of code accountability
Thousands of individual independent R developers
Nobody responsible for the quality of the code
Potentially high hidden costs with R
Total cost may favour commercial solutions for complex computations made in
large
corporations
Difficult architecture management
DRAWBACKS OF R
44. Steep learning curve
R code far from undergrad computer science courses
Very complex data structures (useful if mastered)
Is R’s syntax not logical?
Relatively difficult to learn
DRAWBACKS OF R
Still, not more difficult to learn than
SAS
Both SAS and R more abstract than basic programming languages (Fortran, C…
Ϳ Difficult to learn = more rewarding professionally!!
45. AGENDA
• History and evolution of R
• Principle and software
paradigm
• Description of R interface
• Advantages of R
• Drawbacks of R• So why use R?
• References for learning
R
46. No language is perfect!!
Contradictory objectives to meet
Strengths and weaknesses of each language
Effect of legacy and the culture of the organization
Use existing solutions (system architecture, BA tools…Ϳ
Habits in business analytics
Different needs imply different tools
Large corporations + defined procedures SAS-like
Less financial resources + quick proof of concept R
More positive than negative points
SO WHY LEARN R?
47. Very appealing solution
SO WHY LEARN R?
Popularity of business analytics software (green = very popular, red = unpopular).
Over
all
Corpor
ate
Consulta
nts
Academ
ics
NGO/Go
v'tR SAS
IBM
SPSS
STATIST
ICA
Own
code
48. AGENDA
• History and evolution of R
• Principle and software
paradigm
• Description of R interface
• Advantages of R
• Drawbacks of R
• So why using R?• References for learning R
49. Many books available: choose the one that fits you!
Style, pedagogy, theory vs practice
Browse several books at local library or store
Springer’s UseR! Series
(http://www.springer.com/series/6991)
Recent, concise, good quality, affordable, diverse
Pure rookies: « A beginners’ guide to R », « R by example »
One step forward: « Business analytics for managers »
Intensive Excel users: « R through Excel »
O’Reilly R series ;for programmersͿ
« R cookbook », « R in a nuttshell »
Books
REFERENCES FOR LEARNING R
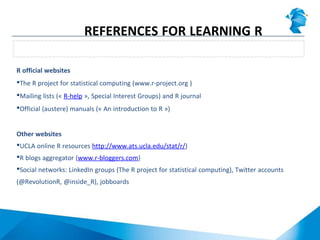
50. Websites
REFERENCES FOR LEARNING R
R official websites
The R project for statistical computing (www.r-project.org )
Mailing lists (« R-help », Special Interest Groups) and R journal
Official (austere) manuals (« An introduction to R »)
Other websites
UCLA online R resources http://www.ats.ucla.edu/stat/r/)
R blogs aggregator (www.r-bloggers.com)
Social networks: LinkedIn groups (The R project for statistical computing), Twitter accounts
(@RevolutionR, @inside_R), jobboards
51. Growing number of conferences about R Official International R UseR! conference
Annual during a few days in new venue (Google it!)
Lots of materials about many topics
Other conferences or venues
Find (or even start!) a R user group close to your location (R Wiki geographical list, map
ofgroups on « meetup.com »)
Events and news from R-bloggers blog
Conferences
REFERENCES FOR LEARNING R