Chart and graphs in R programming language CHANDAN KUMAR
This slide contains basics of charts and graphs in R programming language. I also focused on practical knowledge so I tried to give maximum example to understand the concepts.
- A vector is a sequence of same-type data elements called components or members. Vectors can contain numeric, logical, or character data.
- Vector operations like arithmetic are performed member-by-member. Two vectors can be combined if they have the same data type after coercion.
- Vector members can be retrieved using numeric indexes or logical vectors. Names can also be assigned to vector members.
It covers- Introduction to R language, Creating, Exploring data with Various Data Structures e.g. Vector, Array, Matrices, and Factors. Using Methods with examples.
This presentation educated you about R - Factors with example syntax and demo program of Factors in Data Frame, Changing the Order of Levels and Generating Factor Levels.
For more topics stay tuned with Learnbay.
This document provides a step-by-step guide to learning R. It begins with the basics of R, including downloading and installing R and R Studio, understanding the R environment and basic operations. It then covers R packages, vectors, data frames, scripts, and functions. The second section discusses data handling in R, including importing data from external files like CSV and SAS files, working with datasets, creating new variables, data manipulations, sorting, removing duplicates, and exporting data. The document is intended to guide users through the essential skills needed to work with data in R.
This hands-on R course will guide users through a variety of programming functions in the open-source statistical software program, R. Topics covered include indexing, loops, conditional branching, S3 classes, and debugging. Full workshop materials available from http://projects.iq.harvard.edu/rtc/r-prog
The presentation is a brief case study of R Programming Language. In this, we discussed the scope of R, Uses of R, Advantages and Disadvantages of the R programming Language.
This document provides an introduction and overview of using R for data visualization and analysis. It discusses installing both R and RStudio, basics of R programming including data types, vectors, matrices, data frames and control structures. Descriptive statistical analysis functions are also introduced. The document is intended to teach the fundamentals of the R programming language with a focus on data visualization and analysis.
In this tutorial, we learn to create variables in R. Followed by that, we explore the different data types including numeric, integer, character, logical and date/time.
This document discusses functions in R programming. It defines a function as a set of statements organized to perform a specific task. R has many built-in functions as well as user-defined functions. A function in R is created using the 'function' keyword and contains a name, arguments, body, and return value. Built-in functions like seq(), mean(), and max() are directly called, while user-defined functions are specific to what the user wants. Functions are called by supplying valid arguments and can have default values. Arguments are evaluated lazily. Recursive functions call themselves and are used for techniques like dynamic programming.
This document provides an overview of NoSQL databases. It begins with a brief history of early database systems and their limitations in handling big data and complex relationships. It then discusses the rise of NoSQL databases to address these limitations by providing a more scalable and flexible solution. The main sections define what a NoSQL database is, describe its key characteristics like schema-less design and horizontal scalability, categorize the different types of NoSQL databases, outline advantages like flexibility and performance for big data, and discuss challenges to consider regarding consistency and learning curves.
The document discusses importing and exporting data in R. It describes how to import data from CSV, TXT, and Excel files using functions like read.table(), read.csv(), and read_excel(). It also describes how to export data to CSV, TXT, and Excel file formats using write functions. The document also demonstrates how to check the structure and dimensions of data, modify variable names, derive new variables, and recode categorical variables in R.
Structured Query Language
SQL Commands:
• The standard SQL commands to interact with relational databases are CREATE, SELECT, INSERT, UPDATE, DELETE and DROP
Data mining primitives include task-relevant data, the kind of knowledge to be mined, background knowledge such as concept hierarchies, interestingness measures, and methods for presenting discovered patterns. A data mining query specifies these primitives to guide the knowledge discovery process. Background knowledge like concept hierarchies allow mining patterns at different levels of abstraction. Interestingness measures estimate pattern simplicity, certainty, utility, and novelty to filter uninteresting results. Discovered patterns can be presented through various visualizations including rules, tables, charts, and decision trees.
This document discusses visualizing data in R using various packages and techniques. It introduces ggplot2, a popular package for data visualization that implements Wilkinson's Grammar of Graphics. Ggplot2 can serve as a replacement for base graphics in R and contains defaults for displaying common scales online and in print. The document then covers basic visualizations like histograms, bar charts, box plots, and scatter plots that can be created in R, as well as more advanced visualizations. It also provides examples of code for creating simple time series charts, bar charts, and histograms in R.
R is a programming language and environment for statistical analysis and graphics. It has many built-in statistical and graphical techniques. R can be installed from CRAN and runs on Windows, MacOS, and UNIX systems. The basic R interface is the console, but RStudio provides an integrated development environment. In RStudio, you can write scripts, see outputs and plots, and access help and packages. Packages extend R's functionality through additional functions and data. Common data types in R include numeric, integer, character, factor, and logical. Vectors are the basic data structure, but R also supports matrices, arrays, data frames and lists.
This document discusses entity-relationship (E-R) modeling concepts including specialization, generalization, aggregation, and redundant relationships. It provides definitions and examples of each concept. Specialization defines subclasses based on distinguishing attributes. Generalization defines a superclass from common attributes of subclasses. Aggregation treats relationships as higher-level entities. An E-R diagram example shows representing aggregation. Another example shows a diagram with redundant relationships.
This document provides an outline for a presentation on data mining with R. It introduces R and why it is useful for data mining. It then outlines various data mining techniques that can be performed in R, including classification, clustering, association rule mining, text mining, time series analysis, and social network analysis. Examples are provided for classification using decision trees on the iris dataset, k-means clustering on iris data, and association rule mining on the Titanic dataset.
This document discusses various data types and structures in R. It begins by defining data types as categories of values like numeric and character. Data structures are described as how data is stored, such as vectors, factors, matrices, data frames, and lists. Examples are provided for each structure showing how to create them and access their elements. The document concludes by demonstrating how to work with built-in datasets in R, including viewing, summarizing, and accessing their columns and rows.
Introduction to Data Science, Prerequisites (tidyverse), Import Data (readr), Data Tyding (tidyr),
pivot_longer(), pivot_wider(), separate(), unite(), Data Transformation (dplyr - Grammar of Manipulation): arrange(), filter(),
select(), mutate(), summarise()m
Data Visualization (ggplot - Grammar of Graphics): Column Chart, Stacked Column Graph, Bar Graph, Line Graph, Dual Axis Chart, Area Chart, Pie Chart, Heat Map, Scatter Chart, Bubble Chart
This presentation educates you about R - data types in detail with data type syntax, the data types are - Vectors, Lists, Matrices, Arrays, Factors, Data Frames.
For more topics stay tuned with Learnbay.
Exploratory data analysis in R - Data Science ClubMartin Bago
How to analyse new dataset in R? What libraries to use, and what commands? How to understand your dataset in few minutes? Read my presentation for Data Science Club by Exponea and find out!
This document provides an overview and introduction to using the statistical software R. It outlines R's interface, workspace, help system, packages, input/output functions, and how to reuse results. It also discusses downloading and installing R, basic functions and syntax, data manipulation techniques like sorting and merging, creating graphs, and performing statistical analyses such as t-tests, regression, ANOVA, and multiple comparisons. The document recommends several tutorials that provide more in-depth information on using R for statistical modeling, data analysis, and graphics.
This document provides an overview of database system concepts and architecture. It discusses data models, schemas, instances, and states. It also describes the three-schema architecture, data independence, DBMS languages and interfaces, database system utilities and tools, and centralized and client-server architectures. Key classification of DBMSs are also covered.
In this tutorial, we explore the most basic data structure in R, the vector. We cover everything from creating vectors to subsetting them in different ways.
This document provides a practical manual on data structures for computer science students. It was prepared by Mr. Naveen Choudhary and Dr. Dharm Singh of the Computer Science and Engineering department at Maharana Pratap University of Agriculture and Technology in Udaipur. The 138-page manual contains exercises and solutions to help students understand data structures from an applied perspective. It covers topics like stacks, queues, linked lists, trees, and sorting and searching algorithms.
This document provides an overview of data types and operators in MATLAB. It discusses the main data types including matrices, vectors, strings, structures, cell arrays, and numeric precision. It describes how to create and manipulate different data types using vectors, indexing, and the colon operator. The document also covers common operators for arithmetic, relational, logical, and bitwise operations. Structures are highlighted as useful for passing arguments to functions or making code robust against changes.
The document provides an introduction to MATLAB. It discusses that MATLAB is a numerical computing environment and programming language. It can be used for matrix manipulations, plotting of functions and data, implementation of algorithms, creation of user interfaces, and interfacing with programs written in other languages. The document then covers various MATLAB basics like the MATLAB environment, matrix operations, data types, mathematical and logical operators, and plotting functions. It provides examples of creating and manipulating matrices and vectors in MATLAB.
c++ arrays and pointers grade 9 STEP curriculum.pptxJanineCallangan
A pointer in C++ is a variable that stores the memory address of another variable. Pointers allow indirect access to and manipulation of data in memory. Pointers are declared with a specific data type and initialized by assigning the address of a variable using the address-of operator (&). Pointer arithmetic allows traversing arrays efficiently by performing operations on pointers. There are normal pointers that point to a specific data type, void pointers that can point to any type, and null pointers initialized to nullptr to indicate no target.
The document describes 5 programming exercises involving object-oriented concepts like classes, inheritance, interfaces, and relationships between classes. The exercises involve creating classes for points, persons, students, grids, bounded integers, and a parking ticket system. Students are asked to write code to implement the specified classes and relationships, and write tests to demonstrate the functionality.
Deals with CSV Files operations in Pandas like reading, writing, performing joins and other operations in python using dataframes and Series in Pandas.
Linear algebra covers matrices, vectors, determinants, and linear systems. Matrices and vectors are the main tools of linear algebra and allow large amounts of data to be expressed concisely. Chapter 7 introduces matrices and vectors, focusing on addition and scalar multiplication. It also covers solving systems of linear equations using Gaussian elimination and properties of the solutions.
The document discusses various operators in C++ including arithmetic, increment/decrement, assignment, relational, logical, and bitwise operators. It also covers topics such as loops, arrays, functions, pointers, classes, and objects. Key operators and concepts covered include addition, subtraction, multiplication, division, increment, decrement, assignment, comparison, logical AND/OR/NOT, bitwise AND/OR/XOR/complement, for/while/do-while loops, one and two dimensional arrays, user-defined and recursive functions, regular and double pointers, dynamic memory allocation, and the basics of classes and objects in C++.
Matlab introductory course part 1 with the following agenda:
What is MATLAB
Manipulating Variables
Common Functions for Variables
Good Programming Practices
CIS 1403 lab 3 functions and methods in JavaHamad Odhabi
This lab discusses and provides examples of both built-in and user-defined functions. In Java function are referred to as methods. Therefore, in the rest of this lab, the term methods will be used to refer to functions. The lab will cover the type of methods, naming of functions, the scope of variables and recursion.
Abstract Data Types (a) Explain briefly what is meant by the ter.pdfkarymadelaneyrenne19
Abstract Data Types
(a) Explain briefly what is meant by the term abstract data type (ADT). Give two
reasons why use of ADTs is good programming practice.
(b) Write out a signature, or interface, that defines the operations of a stack ADT.
(c) Consider a string of characters of the form
... (.( ... ).) ...
where ... indicates an arbitrary sequence of characters (except for parentheses),
(.( indicates an arbitrary number (one or more) of opening parentheses, and
similarly ).) indicates an arbitrary number of closing parentheses.
Using only the stack abstraction operations defined above, write pseudocode for
an algorithm that determines, using a stack, whether or not the number of closing
parentheses is the same as the number of opening parentheses.
You may assume the existence of a function read(str,ch) that reads the next character
of string str into ch.
You may also assume that you can invoke a function reportFail, that will cause
termination with failure, and similarly, reportSuccess causes termination with a
success indication.
Further, you may also assume that you can call a function newStack(S) to create
a new empty stack S, and eos(str) that returns false when you reach the end of
the string.
Solution
(a) Explain briefly what is meant by the term abstract data type (ADT). Give two
reasons why use of ADTs is good programming practice.
A data type is a collection of values and a set of operations on those values. That collection and
these operations form a mathematical construct that may be implemented with the use of a
particular hardware or software data structure. The term abstract data type (ADT) refers to the
basic mathematical concept that defines the data type. We have discussed four different
implementations of the list data structure.
In case of implementation of the list with the use of an array, the size of the array gives difficulty
if increased.
To avoid this, we allocate memory dynamically for nodes before connecting these nodes with the
help of pointers.
For this purpose, we made a singly linked list and connected it with the next pointer to make a
chain.
Moving forward is easy but going back is a difficult task.
To overcome this problem, we made a doubly linked list using prev andnext pointers. With the
help of these pointers, we can move forward and backward very easily. Now we face another
problem that the prev pointer of first node and the next pointer of the last node are NULL.
Therefore, we have to be careful in case of NULL pointers. To remove the NULL pointers, we
made the circular link list by connecting the first and last node.
The program employing the list data structure is not concerned with its implementation.
We do not care how the list is being implemented whether through an array, singly linked list,
doubly linked list or circular linked list. It has been witnessed that in these four implementations
of the list, the interface remained the same i.e. it implements the same methods like add, get,
next, start a.
Learn the basics of data visualization in R. In this module, we explore the Graphics package and learn to build basic plots in R. In addition, learn to add title, axis labels and range. Modify the color, font and font size. Add text annotations and combine multiple plots. Finally, learn how to save the plots in different formats.
This document provides an overview of arrays and operations on arrays using NumPy. It discusses creating arrays, mathematical operations on arrays like basic operations, squaring arrays, indexing and slicing arrays, and shape manipulation. Mathematical operations covered include conditional operations and matrix multiplication. Indexing and slicing cover selecting single elements, counting backwards with negative indexes, and combining positive and negative indexes. Shape manipulation discusses changing an array's shape, size, combining arrays, splitting arrays, and repeating arrays.
Scala has several features that simplify programming compared to Java, such as omitting semicolons, type inference, and treating operators as methods. It supports functional programming with features like immutable collections, pattern matching, and lazy values. Classes are defined with a primary constructor and automatically generate getters/setters. Singletons are defined with objects that can extend classes or traits. Packages and imports work similarly to Java but statements can be anywhere and selectively import members. Overriding uses override and super() cannot be called from a constructor. Equality uses equals/hashCode and Unit replaces void. Files can be read/written and regex supports pattern matching.
This document describes how to perform simple linear regression analysis in Microsoft Excel using three methods: formulas, graphs, and the built-in data analysis tool. It provides examples of how to use functions like LINEST, SLOPE, INTERCEPT, and CORREL to calculate the regression line and coefficients. It also demonstrates how to add a trendline to a scatter plot graph and use the data analysis tool to output regression statistics and residuals.
This document outlines the process of creating macros using VBA in Excel. It begins with an introduction to object-oriented programming and how VBA is an OOP language that allows manipulating Excel objects. It then demonstrates recording a simple macro to shift data in a row and modifying the macro to work on any given row by adding an input argument. Loops and functions are introduced to check each row and shift data where needed. The document provides a step-by-step explanation of coding concepts like subroutines, variables, data types, conditional statements, and functions.
A comprehensive introduction to handling date and time data in R. Get an introduction to date and time manipulation in R. Learn to create, transform, extract and operate on date/time objects.
This document provides information about association rule mining on market basket analysis data. It discusses connecting with the company on various platforms, accessing resources like slides and code, and the key concepts of association rule mining including what it is, why it is used, how it works, and example use cases. It then demonstrates the process of generating, inspecting, and filtering rules from transaction data to understand common purchases and influence of products. Top rules are examined by support, confidence, and lift. Association rule mining can uncover frequently bought item sets and has applications in retail and other industries.
This document summarizes information about the governors of the Reserve Bank of India (RBI) by extracting a table from the Wikipedia page on the topic. It lists the 15 governors of the RBI in order from longest to shortest terms in office. It also analyzes the backgrounds of the governors, finding that most were economists (7) or bureaucrats from the IAS or ICS (7), with some also having a banking background (2) or being a career RBI officer (1).
Learn the grammar of data manipulation using dplyr. You will work through a case study to explore the dplyr verbs such as filter, select, mutate, arrange, summarize, group_by etc.
Learn to write readable code with pipes using the magrittr package. You will learn about the forward operator (%>%), exposition operator (%$%) and the assignment operator (%<>%).
tibbles are an alternative for dataframes. You will learn how tibbles are different from dataframes, why you should use them, how to create and modify them.
Read/Import data from flat/delimited files into RRsquared Academy
This document provides examples of using the readr package in R to read data from CSV files. It demonstrates how to handle column names, skip text lines, specify column types as numeric, integer or factor, and read specific columns. Functions used include read_csv(), read_delim(), spec_csv(), and arguments like col_names, skip, col_types, and cols_only to control reading of columns.
Learn how to install & update R packages from CRAN, GitHub, Bioconductor etc. You wlll also learn to install specific versions of a package from CRAN or GitHub.
A brief introduction to the R ecosystem for absolute beginners. You will learn about the history and capabilities of R as a modern language for data science.
In this tutorial, we learn to access MySQL database from R using the RMySQL package. The tutorial covers everything from creating tables, appending data to removing tables from the database.
This document provides an introduction to R Markdown. It explains that R Markdown combines Markdown syntax and R code chunks to create dynamic reports and documents. The document outlines the key topics that will be covered, including what Markdown and R Markdown are, Markdown syntax like headers, emphasis, lists, links and images, R code chunks and options, and RStudio settings. Resources for learning more about Markdown, R Markdown, and related tools are provided.
In this tutorial, we learn to create univariate bar plots using the Graphics package in R. We also learn to modify graphical parameters associated with the bar plot.
Data Visualization With R: Learn To Combine Multiple GraphsRsquared Academy
In this tutorial, we learn to combine multiple graphs into a single frame using the par() and layout() functions. We also compare the differences between the two functions.
Johan Lammers from Statistics Netherlands has been a business analyst and statistical researcher for almost 30 years. In their business, processes have two faces: You can produce statistics about processes and processes are needed to produce statistics. As a government-funded office, the efficiency and the effectiveness of their processes is important to spend that public money well.
Johan takes us on a journey of how official statistics are made. One way to study dynamics in statistics is to take snapshots of data over time. A special way is the panel survey, where a group of cases is followed over time. He shows how process mining could test certain hypotheses much faster compared to statistical tools like SPSS.
indonesia-gen-z-report-2024 Gen Z (born between 1997 and 2012) is currently t...disnakertransjabarda
Gen Z (born between 1997 and 2012) is currently the biggest generation group in Indonesia with 27.94% of the total population or. 74.93 million people.
GenAI for Quant Analytics: survey-analytics.aiInspirient
Pitched at the Greenbook Insight Innovation Competition as apart of IIEX North America 2025 on 30 April 2025 in Washington, D.C.
Join us at survey-analytics.ai!
Tijn van der Heijden is a business analyst with Deloitte. He learned about process mining during his studies in a BPM course at Eindhoven University of Technology and became fascinated with the fact that it was possible to get a process model and so much performance information out of automatically logged events of an information system.
Tijn successfully introduced process mining as a new standard to achieve continuous improvement for the Rabobank during his Master project. At his work at Deloitte, Tijn has now successfully been using this framework in client projects.
Mieke Jans is a Manager at Deloitte Analytics Belgium. She learned about process mining from her PhD supervisor while she was collaborating with a large SAP-using company for her dissertation.
Mieke extended her research topic to investigate the data availability of process mining data in SAP and the new analysis possibilities that emerge from it. It took her 8-9 months to find the right data and prepare it for her process mining analysis. She needed insights from both process owners and IT experts. For example, one person knew exactly how the procurement process took place at the front end of SAP, and another person helped her with the structure of the SAP-tables. She then combined the knowledge of these different persons.
保密服务多伦多都会大学英文毕业证书影本加拿大成绩单多伦多都会大学文凭【q微1954292140】办理多伦多都会大学学位证(TMU毕业证书)成绩单VOID底纹防伪【q微1954292140】帮您解决在加拿大多伦多都会大学未毕业难题(Toronto Metropolitan University)文凭购买、毕业证购买、大学文凭购买、大学毕业证购买、买文凭、日韩文凭、英国大学文凭、美国大学文凭、澳洲大学文凭、加拿大大学文凭(q微1954292140)新加坡大学文凭、新西兰大学文凭、爱尔兰文凭、西班牙文凭、德国文凭、教育部认证,买毕业证,毕业证购买,买大学文凭,购买日韩毕业证、英国大学毕业证、美国大学毕业证、澳洲大学毕业证、加拿大大学毕业证(q微1954292140)新加坡大学毕业证、新西兰大学毕业证、爱尔兰毕业证、西班牙毕业证、德国毕业证,回国证明,留信网认证,留信认证办理,学历认证。从而完成就业。多伦多都会大学毕业证办理,多伦多都会大学文凭办理,多伦多都会大学成绩单办理和真实留信认证、留服认证、多伦多都会大学学历认证。学院文凭定制,多伦多都会大学原版文凭补办,扫描件文凭定做,100%文凭复刻。
特殊原因导致无法毕业,也可以联系我们帮您办理相关材料:
1:在多伦多都会大学挂科了,不想读了,成绩不理想怎么办???
2:打算回国了,找工作的时候,需要提供认证《TMU成绩单购买办理多伦多都会大学毕业证书范本》【Q/WeChat:1954292140】Buy Toronto Metropolitan University Diploma《正式成绩单论文没过》有文凭却得不到认证。又该怎么办???加拿大毕业证购买,加拿大文凭购买,【q微1954292140】加拿大文凭购买,加拿大文凭定制,加拿大文凭补办。专业在线定制加拿大大学文凭,定做加拿大本科文凭,【q微1954292140】复制加拿大Toronto Metropolitan University completion letter。在线快速补办加拿大本科毕业证、硕士文凭证书,购买加拿大学位证、多伦多都会大学Offer,加拿大大学文凭在线购买。
加拿大文凭多伦多都会大学成绩单,TMU毕业证【q微1954292140】办理加拿大多伦多都会大学毕业证(TMU毕业证书)【q微1954292140】学位证书电子图在线定制服务多伦多都会大学offer/学位证offer办理、留信官方学历认证(永久存档真实可查)采用学校原版纸张、特殊工艺完全按照原版一比一制作。帮你解决多伦多都会大学学历学位认证难题。
主营项目:
1、真实教育部国外学历学位认证《加拿大毕业文凭证书快速办理多伦多都会大学毕业证书不见了怎么办》【q微1954292140】《论文没过多伦多都会大学正式成绩单》,教育部存档,教育部留服网站100%可查.
2、办理TMU毕业证,改成绩单《TMU毕业证明办理多伦多都会大学学历认证定制》【Q/WeChat:1954292140】Buy Toronto Metropolitan University Certificates《正式成绩单论文没过》,多伦多都会大学Offer、在读证明、学生卡、信封、证明信等全套材料,从防伪到印刷,从水印到钢印烫金,高精仿度跟学校原版100%相同.
3、真实使馆认证(即留学人员回国证明),使馆存档可通过大使馆查询确认.
4、留信网认证,国家专业人才认证中心颁发入库证书,留信网存档可查.
《多伦多都会大学学位证购买加拿大毕业证书办理TMU假学历认证》【q微1954292140】学位证1:1完美还原海外各大学毕业材料上的工艺:水印,阴影底纹,钢印LOGO烫金烫银,LOGO烫金烫银复合重叠。文字图案浮雕、激光镭射、紫外荧光、温感、复印防伪等防伪工艺。
高仿真还原加拿大文凭证书和外壳,定制加拿大多伦多都会大学成绩单和信封。学历认证证书电子版TMU毕业证【q微1954292140】办理加拿大多伦多都会大学毕业证(TMU毕业证书)【q微1954292140】毕业证书样本多伦多都会大学offer/学位证学历本科证书、留信官方学历认证(永久存档真实可查)采用学校原版纸张、特殊工艺完全按照原版一比一制作。帮你解决多伦多都会大学学历学位认证难题。
多伦多都会大学offer/学位证、留信官方学历认证(永久存档真实可查)采用学校原版纸张、特殊工艺完全按照原版一比一制作【q微1954292140】Buy Toronto Metropolitan University Diploma购买美国毕业证,购买英国毕业证,购买澳洲毕业证,购买加拿大毕业证,以及德国毕业证,购买法国毕业证(q微1954292140)购买荷兰毕业证、购买瑞士毕业证、购买日本毕业证、购买韩国毕业证、购买新西兰毕业证、购买新加坡毕业证、购买西班牙毕业证、购买马来西亚毕业证等。包括了本科毕业证,硕士毕业证。
Frank van Geffen is a Process Innovator at the Rabobank. He realized that it took a lot of different disciplines and skills working together to achieve what they have achieved. It's not only about knowing what process mining is and how to operate the process mining tool. Instead, a lot of emphasis needs to be placed on the management of stakeholders and on presenting insights in a meaningful way for them.
The results speak for themselves: In their IT service desk improvement project, they could already save 50,000 steps by reducing rework and preventing incidents from being raised. In another project, business expense claim turnaround time has been reduced from 11 days to 1.2 days. They could also analyze their cross-channel mortgage customer journey process.
2. R2
AcademyCourse Material
Slide 2
All the material related to this course are available on our website
Scripts can be downloaded from GitHub
Videos can be viewed on our Youtube Channel
4. R2
Academy
Slide 4
COLUMNS
1 2 3
R
O 4 5 6
W
S 7 8 9
10 11 12
A matrix is a rectangular array of data elements, arranged in rows and columns. Matrices in R are
homogeneous i.e. they can hold a single type of data. Matrix elements are indexed by specifying the
row and column index and the elements of a matrix can be filled by row or columns. In the first
section, we look at various methods of creating matrices in R.
5. R2
Academy
Slide 5
The easiest way to create a matrix in R is to use the function. Let us look at its
syntax:
data Data Elements of the matrix Integer/Numeric/Logical/Character
nrow Number of rows Integer
ncol Number of columns Integer
byrow Whether data should be filled by rows Logical
dimnames Names of rows and columns Character vector
6. R2
Academy
Slide 6
Now that we have understood the syntax of the function, let us create a simple
numeric matrix:
7. R2
Academy
Slide 7
In the previous example, we created a matrix of 3 rows where the data elements are filled by
columns. We need to specify either the number of or and R will automatically
calculate the other. The number of data elements should be equal to the product of number of
rows and columns, else R will return an warning message.
8. R2
Academy
Slide 8
We can follow some general rules to avoid the mistakes made in the
previous two examples:
● If the number of data elements are odd, both the number of rows
and columns must be odd and their product should equal the
number of data elements.
● If the number of data elements are even, either the number of
rows must be even or the number of columns must be even. In
certain cases, both of them must be even.
9. R2
Academy
Slide 9
Let us continue to explore the syntax of the function. Let us create two matrices, the data
elements of which are filled by rows in the first case, and columns in the second case.
10. R2
Academy
Slide 10
Either the number of rows or columns need to be specified and R will calculate the other one automatically. We create
two matrices below, the first one specified by rows and the second one by columns.
11. R2
Academy
Slide 11
If we want to specify the names of the rows and columns, we need to use a data structure called . Lists can
contain other data structures including other lists. They are heterogeneous i.e. they can contain different data types.
We will learn more about lists in the next unit. For now, let us learn to create a basic list. Lists in R can be created using
the function.
12. R2
Academy
Slide 12
Let us now create a list of row and column names and use it to name the rows and columns of a
matrix.
13. R2
Academy
Slide 13
Another method to create a matrix is to use the function. It is basically used to check or specify the dimensions
of a data structure. In case of matrices, it returns the number of rows and columns. Let us look at a few examples:
14. R2
Academy
Slide 14
In the below example, we use the function to change the dimension of the matrix.In the dim function, we need to
mention both the number of rows and columns using the function. We change the rows from 3 to 4 and the
columns from 4 to 3.
15. R2
Academy
Slide 15
In the below example, we use the function to change row from 2 to 6 and the columns from 6 to 2.
16. R2
Academy
Slide 16
Now that we have understood the function, let us use it to convert vectors to matrices. Below are a few examples:
18. R2
Academy
Slide 18
The last method that we will explore in this section is the function. It is used to coerce a
data structure to the type . Since the only other data structure that we have covered so far is
the vector, we will coerce a vector to type We will deal with other data structures as and
when we learn about them.
19. R2
Academy
Slide 19
Regardless of the data type of vector, all of them are coerced to a of dimension n x 1 i.e. they
will all have only one column.
20. R2
Academy
Slide 20
In this section, we will cover the following:
● Matrix Addition
● Matrix Subtraction
● Matrix Division
● Transpose of a Matrix
● Matrix Multiplication
● Inverse of a Matrix
The four basic operations of addition, subtraction, multiplication and division can be done by element
wise or with a scalar value. We will be looking at both cases. In the case of multiplication, we need to
compute the transpose of the matrix before we can do element wise multiplication.
26. R2
Academy
Slide 26
We need to follow the basic rules of matrix multiplication i.e. the number of columns in the first matrix
should be equal to the number of rows in the second matrix. Let us look at an example:
28. R2
Academy
Slide 28
In this section, we will focus on appending vector to matrices and combining matrices. There are two
functions that can be used for this purpose:
●
●
will combine/append the data by columns while will do the same by rows. When you
use to combine two matrices, the number of columns must match and in case of , the
number of rows must match.
33. R2
Academy
Slide 33
In this section, we will learn to index/subset elements of a matrix. The operator can be used to index
the elements as we did in case of vectors but since matrices are two dimensional, we need to specify
both the row number and the column number. Below are a few examples:
36. R2
Academy
Slide 36
In an earlier section, we learnt how to name the rows and columns of a matrix. Let us see how these
names can be used to subset matrices.
37. R2
Academy
Slide 37
When you are using names of columns or rows for subsetting data from matrices, ensure that they
are enclosed in single or double quotes.
39. R2
Academy
Slide 39
So far, we have learnt how to coerce a vector to a matrix. In this final section, we will learn to
coerce a matrix to a vector. We can use the following functions:
●
●
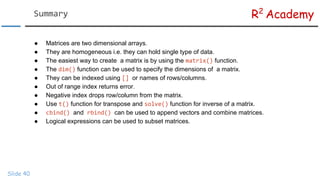
40. R2
Academy
Slide 40
● Matrices are two dimensional arrays.
● They are homogeneous i.e. they can hold single type of data.
● The easiest way to create a matrix is by using the function.
● The function can be used to specify the dimensions of a matrix.
● They can be indexed using or names of rows/columns.
● Out of range index returns error.
● Negative index drops row/column from the matrix.
● Use function for transpose and function for inverse of a matrix.
● and can be used to append vectors and combine matrices.
● Logical expressions can be used to subset matrices.
42. R2
Academy
Slide 42
Visit Rsquared Academy
for tutorials on:
→ R Programming
→ Business Analytics
→ Data Visualization
→ Web Applications
→ Package Development
→ Git & GitHub