SlideShare a Scribd company logo
Basics of Reporting: Report Setup – Part 2 (R04) 
PMs, Procedures, and Projects Track
1.Open Internet Explorer 
2.Type into the address bar: www.maintenanceconnection.com 
3.Click Log In button 
4.Enter the following: Member ID: Password: 
Note: During the seminar, please do not “Save” while following along with a specific example unless directed to do so by your course instructor. 
Wireless SSID: CHECKPOINT 
Wireless Password: CHECKPOINT 
Logon Instructions
Presenter Name: Background information: 
•Role and expertise at Maintenance Connection 
•Fun Fact 
Presenter Bio
Report Charts Defined Reporting Tips and Tricks 
Agenda
Report Charts Overview Defining Charts 
Report Charts Defined
Charts can be used to: 
•Provide visual representation of valuable factors in data 
Report Charts Overview
•Enhance appearance of reports 
Report Charts Overview (cont’d)
•Summarize data listed on reports 
Report Charts Overview (cont’d)
•Show a different side of the same data 
Report Charts Overview (cont’d)
Charts / KPIs sub-tab of Report Setup provides access to three Charts Can add one or more Charts to an individual report 
Defining Charts
Four different types of Charts: 
•Pie 
•Bar 
•Line 
•Area 
Defining Charts (cont’d)
Charts are available in two different Formats: 
•Image 
•Flash 
Defining Charts (cont’d)
Image: 
•Typically better for Pie Charts 
•Ability to alter Chart Type 
•Can be emailed or exported 
Defining Charts (cont’d)
Flash: 
•Image is enhanced 
•No cycling through formats 
Defining Charts (cont’d)
•Hover over chart sections for summary calculations 
•NOT designed for inclusion in emailed reports 
Defining Charts (cont’d)
Other Chart details can also be defined: 
•Chart Size / Position 
•Chart By 
•Chart Function 
•Chart Function For 
•Chart Name (Label) 
Defining Charts (cont’d)
Now let’s practice creating a test Report and define a Chart for the Report! 
Defining Charts: Hands-On
Select the Work Order (Open) Reports folder on the left of the Reporter screen Locate the Open Work Order List and select it Click Copy Report 
Defining Charts: Hands-On (cont’d)
Enter a unique name for your Report 
•Example: “Open Work Order List – Your Initials – Date” If necessary, specify a Repair Center for the Managed By field Click Apply 
Defining Charts: Hands-On (cont’d)
Locate your newly created Report Navigate to the Report Setup  
Charts / KPIs tab Select the Type of Chart as a Pie Chart 
Defining Charts: Hands-On (cont’d)
Select the Format of the Chart as an Image Select the Chart Size as Large and the Chart Position as displaying at the Top 
Defining Charts: Hands-On (cont’d)
Set the Chart By to [WO] Priority Desc Set the Chart Function to Count Set the Chart Function For to None 
Defining Charts: Hands-On (cont’d)
Specify a Chart Name Click Apply to save changes 
Defining Charts: Hands-On (cont’d)
Chart will appear similar to as follows and will have the ability to cycle through multiple formats: 
Defining Charts: Hands-On (cont’d)
You have now succesfully completed creating a test Report and adding a Chart! 
Defining Charts: Hands-On (cont’d)
Edit Field Labels Edit Report Description Drag and Drop Columns Report Layout Indicators 
Report Tips and Tricks
Descriptive label for each field can be modified as needed Changes only affect label for that particular report 
Edit Field Labels
Edit Label from Display field Edit dialog Field Label (Custom) field used to specify and display new label 
Edit Field Labels (cont’d)
From Layout tab, ensure “Display Report Description” indicator is enabled From Advanced tab  Report Profile sub- tab enter desired description 
Edit Report Description
Often used to provide additional explanatory information to recipients of report Appears in two places: 
•Displayed directly below report title 
•When hovering over report name 
Edit Report Description (cont’d)
Now let’s practice editing Field Labels and the Report Description for your test Report! 
Edit Field Labels and Description: Hands-On
Open your test Report Navigate to the Report Setup Locate the [Asset] Priority field in the Available Fields List 
Edit Field Labels and Description: Hands-On (cont’d)
Select [Asset] Priority and use the right arrow to move it to the Display Fields List Click on the Edit button for the [Asset] Priority field in the Display Fields List 
Edit Field Labels and Description: Hands-On (cont’d)
In the Field Label (Custom) field, enter Asset Priority Apply your changes to the Report Field Options Dialog and the Report Setup 
Edit Field Labels and Description: Hands-On (cont’d)
The Field Label will now reflect the changes: 
Edit Field Labels and Description: Hands-On (cont’d)
Now, navigate to the Report Setup of your test Report Select the Advanced tab From the Report Profile sub-tab, locate the Description field 
Edit Field Labels and Description: Hands-On (cont’d)
Enter a Description for your Report Navigate to the Layout tab Ensure the Display Report Description indicator is checked Apply your changes 
Edit Field Labels and Description: Hands-On (cont’d)
Report Description will appear under the Report Title: 
Edit Field Labels and Description: Hands-On (cont’d)
You have now successfully completed editing Field Labels and the Report Description for your test Report! 
Edit Field Labels and Description: Hands-On (cont’d)
Dynamically change field order from Report Preview window Click and hold field, and drag to new location 
Drag and Drop Columns
Quickly modify display of report using indicators on the Layout tab 
Report Layout Indicators
Display Column Lines indicator determines whether or not column or grid lines appear on report Helpful if report contains multiple numeric columns! 
Report Layout Indicators (cont’d)
Report Criteria / Format Criteria displays explanatory information Criteria from Criteria Dialog and any special formatting applied will appear 
Report Layout Indicators (cont’d)
For access to documentation and tutorials, reference www.mcuserconnect.com 
MC User Connect
MCUC Documentation / Tutorials 
Article 
PDF 
Video Tutorial 
User Guide 
Reporter Tutorial – Basic 
Additional Resources
Did you know you can take a Quiz to test your knowledge of today’s content? 
•Check it out on MC User Connect! (www.mcuserconnect.com) 
•Located in the MC eLearning folder  Reporter Course Quizzes 
Test Your Knowledge…

More Related Content

What's hot (20)

PPTX
R11 - Pivot Reports (MCU)
Maintenance Connection
 
PDF
Fsg reporting
HussAin LaLji ヅ
 
DOC
financial statements & trial balance
jyotibugade
 
PDF
Defining z cells in a report painter report
Samir Sahu
 
PPTX
R10 - Advanced Reporting Report Setup and Summary Reports (MCU)
Maintenance Connection
 
PPTX
Dashboard
Rushabh Khajuria
 
PDF
Mr20 enus a-Report Design in Management Reporter 2.0 for Microsoft Dynamics® ERP
Sami JAMMALI
 
PPT
Access 2007
heenasetpal
 
PPTX
R04 | Basics of Reporting - Report Setup Part 2 (MCUI)
Maintenance Connection
 
DOCX
How to Navigate PerformancePoint 2010 Dashboards and Explore Data - EPC Group
EPC Group
 
PDF
0417 s14 qp_22
Omniya Jay
 
PPTX
Fsg Tips And Tricks
Attiq Ahmed
 
PDF
0417 s16 qp_21
Omniya Jay
 
PDF
0417 s16 qp_22
Omniya Jay
 
DOCX
How to create a transaction code for report painter reports
Rajeev Kumar
 
PDF
MS Access 2010 tutorial 6
Khalfan Alshuaili
 
PPTX
Basic commands of ArcGIS
KU Leuven
 
PDF
ServiceNow (SNOW) Reporting Explaind
Enamul Haque
 
PPT
Lsmw by recording_method
Mahesh Bachhav
 
PDF
Obia catalog customization_guidelines
Hatakesh Potnuru
 
R11 - Pivot Reports (MCU)
Maintenance Connection
 
Fsg reporting
HussAin LaLji ヅ
 
financial statements & trial balance
jyotibugade
 
Defining z cells in a report painter report
Samir Sahu
 
R10 - Advanced Reporting Report Setup and Summary Reports (MCU)
Maintenance Connection
 
Dashboard
Rushabh Khajuria
 
Mr20 enus a-Report Design in Management Reporter 2.0 for Microsoft Dynamics® ERP
Sami JAMMALI
 
Access 2007
heenasetpal
 
R04 | Basics of Reporting - Report Setup Part 2 (MCUI)
Maintenance Connection
 
How to Navigate PerformancePoint 2010 Dashboards and Explore Data - EPC Group
EPC Group
 
0417 s14 qp_22
Omniya Jay
 
Fsg Tips And Tricks
Attiq Ahmed
 
0417 s16 qp_21
Omniya Jay
 
0417 s16 qp_22
Omniya Jay
 
How to create a transaction code for report painter reports
Rajeev Kumar
 
MS Access 2010 tutorial 6
Khalfan Alshuaili
 
Basic commands of ArcGIS
KU Leuven
 
ServiceNow (SNOW) Reporting Explaind
Enamul Haque
 
Lsmw by recording_method
Mahesh Bachhav
 
Obia catalog customization_guidelines
Hatakesh Potnuru
 

Viewers also liked (11)

PPTX
R10 | Advanced Reporting - Report Setup and Summary Reports (MCUI)
Maintenance Connection
 
PPTX
R03 | Basics of Reporting - Report Setup Part 1 (MCUI)
Maintenance Connection
 
PPT
The news production process
David Brewer
 
PPT
How Newspaper Newsrooms Work
Julie Starr
 
PPT
3. Editorial Chart[1] PM ppt
Arzoo Sahni
 
PDF
Model of communication pdf
Kriztine Viray
 
PPTX
Organization Structure of the Magazine Industry
Jawe Querimit
 
PPTX
The Future of Communication Technology
anpipt01
 
PPTX
Trends in communication technology
Vishal Langthasa
 
PPT
Communication Concepts, Theories And Models1
Suchitra Patnaik
 
R10 | Advanced Reporting - Report Setup and Summary Reports (MCUI)
Maintenance Connection
 
R03 | Basics of Reporting - Report Setup Part 1 (MCUI)
Maintenance Connection
 
The news production process
David Brewer
 
How Newspaper Newsrooms Work
Julie Starr
 
3. Editorial Chart[1] PM ppt
Arzoo Sahni
 
Model of communication pdf
Kriztine Viray
 
Organization Structure of the Magazine Industry
Jawe Querimit
 
The Future of Communication Technology
anpipt01
 
Trends in communication technology
Vishal Langthasa
 
Communication Concepts, Theories And Models1
Suchitra Patnaik
 
Ad

Similar to R04 - Basics of Reporting: Report Setup Part 2 (20)

PDF
R05 - Intermediate Reporting: Report Configuration
Maintenance Connection
 
PDF
Mr20 enus 06-Report Design in Management Reporter 2.0 for Microsoft Dynamics®...
Sami JAMMALI
 
PDF
Mr20 enus 03-Report Design in Management Reporter 2.0 for Microsoft Dynamics®...
Sami JAMMALI
 
PDF
Mr20 enus 07-Report Design in Management Reporter 2.0 for Microsoft Dynamics®...
Sami JAMMALI
 
DOC
Report exchange designer
Bhushan Rajgure
 
PPTX
MS Excel Pivot Table Reports & Charts
dnbakhan
 
PDF
Mr20 enus 08-Report Design in Management Reporter 2.0 for Microsoft Dynamics®...
Sami JAMMALI
 
PDF
Mr20 enus 10-Report Design in Management Reporter 2.0 for Microsoft Dynamics®...
Sami JAMMALI
 
PPT
Addmi 08-dashboards
odanyboy
 
PPT
Crystal tr///SAP Design Studio online training by design studio Export-24/7//...
venkat training
 
PPTX
Microsoft Dynamics GP Management Reporter 2012: Take Your Reporting to the Ne...
BDO IT Solutions
 
PDF
Datastream charting getting started
Ita Kamis
 
PPTX
Report Builder Training 7i
Dydacomp
 
PDF
Mr20 enus 09-Report Design in Management Reporter 2.0 for Microsoft Dynamics®...
Sami JAMMALI
 
PDF
Mr20 enus 01-Report Design in Management Reporter 2.0 for Microsoft Dynamics®...
Sami JAMMALI
 
PPT
Microsoft Project 2003 Configuration Training Level 2 Itvamp 2007
ITVAMP, LLC
 
DOCX
Creating a data report in visual basic 6
mrgulshansharma
 
PDF
SA04 - Managing KPIs and Dashboards
Maintenance Connection
 
PDF
Report designer
Nguyễn Chí Hiền
 
PDF
CA Cloud Service Management: Advanced Reporting
CA Technologies
 
R05 - Intermediate Reporting: Report Configuration
Maintenance Connection
 
Mr20 enus 06-Report Design in Management Reporter 2.0 for Microsoft Dynamics®...
Sami JAMMALI
 
Mr20 enus 03-Report Design in Management Reporter 2.0 for Microsoft Dynamics®...
Sami JAMMALI
 
Mr20 enus 07-Report Design in Management Reporter 2.0 for Microsoft Dynamics®...
Sami JAMMALI
 
Report exchange designer
Bhushan Rajgure
 
MS Excel Pivot Table Reports & Charts
dnbakhan
 
Mr20 enus 08-Report Design in Management Reporter 2.0 for Microsoft Dynamics®...
Sami JAMMALI
 
Mr20 enus 10-Report Design in Management Reporter 2.0 for Microsoft Dynamics®...
Sami JAMMALI
 
Addmi 08-dashboards
odanyboy
 
Crystal tr///SAP Design Studio online training by design studio Export-24/7//...
venkat training
 
Microsoft Dynamics GP Management Reporter 2012: Take Your Reporting to the Ne...
BDO IT Solutions
 
Datastream charting getting started
Ita Kamis
 
Report Builder Training 7i
Dydacomp
 
Mr20 enus 09-Report Design in Management Reporter 2.0 for Microsoft Dynamics®...
Sami JAMMALI
 
Mr20 enus 01-Report Design in Management Reporter 2.0 for Microsoft Dynamics®...
Sami JAMMALI
 
Microsoft Project 2003 Configuration Training Level 2 Itvamp 2007
ITVAMP, LLC
 
Creating a data report in visual basic 6
mrgulshansharma
 
SA04 - Managing KPIs and Dashboards
Maintenance Connection
 
Report designer
Nguyễn Chí Hiền
 
CA Cloud Service Management: Advanced Reporting
CA Technologies
 
Ad

More from Maintenance Connection (20)

PPTX
Three Easy Ways to Radically Improve Your Manufacturing Asset Management Process
Maintenance Connection
 
PPTX
3 inventory strategies to maximize your CMMS profitability
Maintenance Connection
 
PPTX
3 Ways a Mobile CMMS Strategy Can Revolutionize Your Organization
Maintenance Connection
 
PDF
How Healthcare Maintenance Pros Can Improve Operations with Preventive Mainte...
Maintenance Connection
 
PDF
Manufacturers: What's next in the ever-evolving industry?
Maintenance Connection
 
PPTX
V7.0-02 - System Administration with MC v7.0 (MCUIE)
Maintenance Connection
 
PPTX
W10 | Work Order Preferences (MCUI)
Maintenance Connection
 
PPTX
W09 | Work Order Management Tools (MCUI)
Maintenance Connection
 
PPTX
W08 | Rules Manager Notifications and Alerts (MCUI)
Maintenance Connection
 
PPTX
W07 | Tracking Time and Cost on Work Orders (MCUI)
Maintenance Connection
 
PPTX
SA07 | Rules Manager and Events Notifications (MCUI)
Maintenance Connection
 
PPTX
SA06 | Human Resource Management (MCUI)
Maintenance Connection
 
PPTX
SA05 | Customizing the User Interface (MCUI)
Maintenance Connection
 
PPTX
SA04 | Managing KPI's and Dashboards (MCUI)
Maintenance Connection
 
PPTX
Sa03 | Overview of Access Groups (MCUI)
Maintenance Connection
 
PPTX
SA02 | User and Password Management Techniques (MCUI)
Maintenance Connection
 
PPTX
R11 | Pivot Reports (MCUI)
Maintenance Connection
 
PPTX
R09 | Advanced Reporting - Custom Expressions and Criteria (MCUI)
Maintenance Connection
 
PPTX
R08 | Intermediate Reporting - Email Schedule and Reporting (MCUI)
Maintenance Connection
 
PPTX
R07 | Intermediate Reporting - Smart Reports (MCUI)
Maintenance Connection
 
Three Easy Ways to Radically Improve Your Manufacturing Asset Management Process
Maintenance Connection
 
3 inventory strategies to maximize your CMMS profitability
Maintenance Connection
 
3 Ways a Mobile CMMS Strategy Can Revolutionize Your Organization
Maintenance Connection
 
How Healthcare Maintenance Pros Can Improve Operations with Preventive Mainte...
Maintenance Connection
 
Manufacturers: What's next in the ever-evolving industry?
Maintenance Connection
 
V7.0-02 - System Administration with MC v7.0 (MCUIE)
Maintenance Connection
 
W10 | Work Order Preferences (MCUI)
Maintenance Connection
 
W09 | Work Order Management Tools (MCUI)
Maintenance Connection
 
W08 | Rules Manager Notifications and Alerts (MCUI)
Maintenance Connection
 
W07 | Tracking Time and Cost on Work Orders (MCUI)
Maintenance Connection
 
SA07 | Rules Manager and Events Notifications (MCUI)
Maintenance Connection
 
SA06 | Human Resource Management (MCUI)
Maintenance Connection
 
SA05 | Customizing the User Interface (MCUI)
Maintenance Connection
 
SA04 | Managing KPI's and Dashboards (MCUI)
Maintenance Connection
 
Sa03 | Overview of Access Groups (MCUI)
Maintenance Connection
 
SA02 | User and Password Management Techniques (MCUI)
Maintenance Connection
 
R11 | Pivot Reports (MCUI)
Maintenance Connection
 
R09 | Advanced Reporting - Custom Expressions and Criteria (MCUI)
Maintenance Connection
 
R08 | Intermediate Reporting - Email Schedule and Reporting (MCUI)
Maintenance Connection
 
R07 | Intermediate Reporting - Smart Reports (MCUI)
Maintenance Connection
 

Recently uploaded (20)

PDF
Australian Enterprises Need Project Service Automation
Navision India
 
PDF
Ready Layer One: Intro to the Model Context Protocol
mmckenna1
 
PDF
Dialora AI Voice Agent for Customer Support
Dialora. Ai
 
PDF
Troubleshooting Virtual Threads in Java!
Tier1 app
 
PDF
ESUG 2025: Pharo 13 and Beyond (Stephane Ducasse)
ESUG
 
PDF
Introduction to Apache Iceberg™ & Tableflow
Alluxio, Inc.
 
PDF
Meet in the Middle: Solving the Low-Latency Challenge for Agentic AI
Alluxio, Inc.
 
PDF
How to Download and Install ADT (ABAP Development Tools) for Eclipse IDE | SA...
SAP Vista, an A L T Z E N Company
 
PPTX
Operations Profile SPDX_Update_20250711_Example_05_03.pptx
Shane Coughlan
 
PPTX
TexSender Pro 8.9.1 Crack Full Version Download
cracked shares
 
PDF
custom development enhancement | Togglenow.pdf
aswinisuhu
 
PPTX
MiniTool Partition Wizard Crack 12.8 + Serial Key Download Latest [2025]
filmoracrack9001
 
PDF
How to get the licensing right for Microsoft Core Infrastructure Server Suite...
Q-Advise
 
PPTX
PCC IT Forum 2025 - Legislative Technology Snapshot
Gareth Oakes
 
PPTX
Function & Procedure: Function Vs Procedure in PL/SQL
Shani Tiwari
 
PPTX
Transforming Insights: How Generative AI is Revolutionizing Data Analytics
LetsAI Solutions
 
PDF
AI Image Enhancer: Revolutionizing Visual Quality”
docmasoom
 
PDF
Instantiations Company Update (ESUG 2025)
ESUG
 
PDF
Optimizing Tiered Storage for Low-Latency Real-Time Analytics at AI Scale
Alluxio, Inc.
 
PDF
How AI in Healthcare Apps Can Help You Enhance Patient Care?
Lilly Gracia
 
Australian Enterprises Need Project Service Automation
Navision India
 
Ready Layer One: Intro to the Model Context Protocol
mmckenna1
 
Dialora AI Voice Agent for Customer Support
Dialora. Ai
 
Troubleshooting Virtual Threads in Java!
Tier1 app
 
ESUG 2025: Pharo 13 and Beyond (Stephane Ducasse)
ESUG
 
Introduction to Apache Iceberg™ & Tableflow
Alluxio, Inc.
 
Meet in the Middle: Solving the Low-Latency Challenge for Agentic AI
Alluxio, Inc.
 
How to Download and Install ADT (ABAP Development Tools) for Eclipse IDE | SA...
SAP Vista, an A L T Z E N Company
 
Operations Profile SPDX_Update_20250711_Example_05_03.pptx
Shane Coughlan
 
TexSender Pro 8.9.1 Crack Full Version Download
cracked shares
 
custom development enhancement | Togglenow.pdf
aswinisuhu
 
MiniTool Partition Wizard Crack 12.8 + Serial Key Download Latest [2025]
filmoracrack9001
 
How to get the licensing right for Microsoft Core Infrastructure Server Suite...
Q-Advise
 
PCC IT Forum 2025 - Legislative Technology Snapshot
Gareth Oakes
 
Function & Procedure: Function Vs Procedure in PL/SQL
Shani Tiwari
 
Transforming Insights: How Generative AI is Revolutionizing Data Analytics
LetsAI Solutions
 
AI Image Enhancer: Revolutionizing Visual Quality”
docmasoom
 
Instantiations Company Update (ESUG 2025)
ESUG
 
Optimizing Tiered Storage for Low-Latency Real-Time Analytics at AI Scale
Alluxio, Inc.
 
How AI in Healthcare Apps Can Help You Enhance Patient Care?
Lilly Gracia
 

R04 - Basics of Reporting: Report Setup Part 2

  • 1. Basics of Reporting: Report Setup – Part 2 (R04) PMs, Procedures, and Projects Track
  • 2. 1.Open Internet Explorer 2.Type into the address bar: www.maintenanceconnection.com 3.Click Log In button 4.Enter the following: Member ID: Password: Note: During the seminar, please do not “Save” while following along with a specific example unless directed to do so by your course instructor. Wireless SSID: CHECKPOINT Wireless Password: CHECKPOINT Logon Instructions
  • 3. Presenter Name: Background information: •Role and expertise at Maintenance Connection •Fun Fact Presenter Bio
  • 4. Report Charts Defined Reporting Tips and Tricks Agenda
  • 5. Report Charts Overview Defining Charts Report Charts Defined
  • 6. Charts can be used to: •Provide visual representation of valuable factors in data Report Charts Overview
  • 7. •Enhance appearance of reports Report Charts Overview (cont’d)
  • 8. •Summarize data listed on reports Report Charts Overview (cont’d)
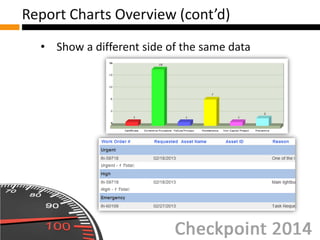
  • 9. •Show a different side of the same data Report Charts Overview (cont’d)
  • 10. Charts / KPIs sub-tab of Report Setup provides access to three Charts Can add one or more Charts to an individual report Defining Charts
  • 11. Four different types of Charts: •Pie •Bar •Line •Area Defining Charts (cont’d)
  • 12. Charts are available in two different Formats: •Image •Flash Defining Charts (cont’d)
  • 13. Image: •Typically better for Pie Charts •Ability to alter Chart Type •Can be emailed or exported Defining Charts (cont’d)
  • 14. Flash: •Image is enhanced •No cycling through formats Defining Charts (cont’d)
  • 15. •Hover over chart sections for summary calculations •NOT designed for inclusion in emailed reports Defining Charts (cont’d)
  • 16. Other Chart details can also be defined: •Chart Size / Position •Chart By •Chart Function •Chart Function For •Chart Name (Label) Defining Charts (cont’d)
  • 17. Now let’s practice creating a test Report and define a Chart for the Report! Defining Charts: Hands-On
  • 18. Select the Work Order (Open) Reports folder on the left of the Reporter screen Locate the Open Work Order List and select it Click Copy Report Defining Charts: Hands-On (cont’d)
  • 19. Enter a unique name for your Report •Example: “Open Work Order List – Your Initials – Date” If necessary, specify a Repair Center for the Managed By field Click Apply Defining Charts: Hands-On (cont’d)
  • 20. Locate your newly created Report Navigate to the Report Setup  Charts / KPIs tab Select the Type of Chart as a Pie Chart Defining Charts: Hands-On (cont’d)
  • 21. Select the Format of the Chart as an Image Select the Chart Size as Large and the Chart Position as displaying at the Top Defining Charts: Hands-On (cont’d)
  • 22. Set the Chart By to [WO] Priority Desc Set the Chart Function to Count Set the Chart Function For to None Defining Charts: Hands-On (cont’d)
  • 23. Specify a Chart Name Click Apply to save changes Defining Charts: Hands-On (cont’d)
  • 24. Chart will appear similar to as follows and will have the ability to cycle through multiple formats: Defining Charts: Hands-On (cont’d)
  • 25. You have now succesfully completed creating a test Report and adding a Chart! Defining Charts: Hands-On (cont’d)
  • 26. Edit Field Labels Edit Report Description Drag and Drop Columns Report Layout Indicators Report Tips and Tricks
  • 27. Descriptive label for each field can be modified as needed Changes only affect label for that particular report Edit Field Labels
  • 28. Edit Label from Display field Edit dialog Field Label (Custom) field used to specify and display new label Edit Field Labels (cont’d)
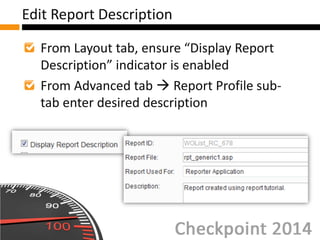
  • 29. From Layout tab, ensure “Display Report Description” indicator is enabled From Advanced tab  Report Profile sub- tab enter desired description Edit Report Description
  • 30. Often used to provide additional explanatory information to recipients of report Appears in two places: •Displayed directly below report title •When hovering over report name Edit Report Description (cont’d)
  • 31. Now let’s practice editing Field Labels and the Report Description for your test Report! Edit Field Labels and Description: Hands-On
  • 32. Open your test Report Navigate to the Report Setup Locate the [Asset] Priority field in the Available Fields List Edit Field Labels and Description: Hands-On (cont’d)
  • 33. Select [Asset] Priority and use the right arrow to move it to the Display Fields List Click on the Edit button for the [Asset] Priority field in the Display Fields List Edit Field Labels and Description: Hands-On (cont’d)
  • 34. In the Field Label (Custom) field, enter Asset Priority Apply your changes to the Report Field Options Dialog and the Report Setup Edit Field Labels and Description: Hands-On (cont’d)
  • 35. The Field Label will now reflect the changes: Edit Field Labels and Description: Hands-On (cont’d)
  • 36. Now, navigate to the Report Setup of your test Report Select the Advanced tab From the Report Profile sub-tab, locate the Description field Edit Field Labels and Description: Hands-On (cont’d)
  • 37. Enter a Description for your Report Navigate to the Layout tab Ensure the Display Report Description indicator is checked Apply your changes Edit Field Labels and Description: Hands-On (cont’d)
  • 38. Report Description will appear under the Report Title: Edit Field Labels and Description: Hands-On (cont’d)
  • 39. You have now successfully completed editing Field Labels and the Report Description for your test Report! Edit Field Labels and Description: Hands-On (cont’d)
  • 40. Dynamically change field order from Report Preview window Click and hold field, and drag to new location Drag and Drop Columns
  • 41. Quickly modify display of report using indicators on the Layout tab Report Layout Indicators
  • 42. Display Column Lines indicator determines whether or not column or grid lines appear on report Helpful if report contains multiple numeric columns! Report Layout Indicators (cont’d)
  • 43. Report Criteria / Format Criteria displays explanatory information Criteria from Criteria Dialog and any special formatting applied will appear Report Layout Indicators (cont’d)
  • 44. For access to documentation and tutorials, reference www.mcuserconnect.com MC User Connect
  • 45. MCUC Documentation / Tutorials Article PDF Video Tutorial User Guide Reporter Tutorial – Basic Additional Resources
  • 46. Did you know you can take a Quiz to test your knowledge of today’s content? •Check it out on MC User Connect! (www.mcuserconnect.com) •Located in the MC eLearning folder  Reporter Course Quizzes Test Your Knowledge…