Real-time Big Data Analytics Practice with Unstructured Data
22 likes2,470 views

2012년 SAC 발표 자료 입니다.


![OpenSource CEP : Esper
EPServiceProvider epService = EPServiceProviderManager.getDefaultProvider();
String expression = "select avg(price) from
org.myapp.event.OrderEvent.win:time(30 sec)";
EPStatement statement = epService.getEPAdministrator().createEPL(expression);
public class MyListener implements UpdateListener {
public void update(EventBean[] newEvents, EventBean[] oldEvents) {
EventBean event = newEvents[0];
System.out.println("avg=" + event.get("avg(price)"));
}
}
MyListener listener = new MyListener();
statement.addListener(listener);
Apache Hadoop](https://image.slidesharecdn.com/real-timebigdataanalyticspracticewithunstructureddata-131030091939-phpapp01/85/Real-time-Big-Data-Analytics-Practice-with-Unstructured-Data-27-320.jpg)


Real-time Big Data Analytics Practice with Unstructured Data
- 1. Real-time Big Data Analytics Practice with Unstructured Data tedwon [email protected] Apache Hadoop
- 2. 소개 • Real-time CEP(Complex Event Processing) Platform Engineer • Hadoop기반 Big Data 플랫폼 개발 • Software Architect, Development, Testing, Operation • Performance Management • Korea JBoss User Group 커뮤니티 부운영자 • 한국자바개발자협의회(JCO) 회원 • Redhat JBoss RHQ Contributor - 한글화 작업 Apache Hadoop
- 3. Big Data의 세 가지 속성 Apache Hadoop 3
- 4. Big Data 활용 분야 Apache Hadoop 4
- 5. Big Data Technology & Hadoop Ecosystem Apache Hadoop
- 6. Big Data Platform Software Stack Apache Hadoop 출처: http://www.slideshare.net/babokim/big-data-20111203
- 7. Real Time Big Data 서비스 요건 • 쇼핑몰 사이트의 사용자 클릭 스트림을 통해 실시간 개인화 • E-mart 고객이 끌고 다니는 카트를 통해 실시간 개인화 (RFID) • 대용량 이메일 서버의 스팸 탐지 및 필터링 • 위치 정보 기반 광고 서비스 • 사용자 및 시스템 이벤트를 이용한 실시간 보안 감시 • 시스템 정보 수집을 통한 장비 고장 예측 • ETL(Extract, Transform, Load) Apache Hadoop
- 8. Real Time Big Data 구현을 위한 기술 실시간 로그 수집 및 분배 기술 실시간 이벤트 처리 기술 대용량 데이터의 배치 처리 및 분석 기술 통합 기술 Apache Hadoop
- 9. Real Time Big Data 구현을 위한 기술 Real-time Distributed Log Aggregator Complex Event Processing Distributed Computing Developer's Engineering Apache Hadoop
- 10. Real Time Big Data 구현을 위한 기술 Scribe, Flume 로그 수집기 CEP Esper, S4, Storm 이벤트 처리기 Hadoop 분산 파일 처리 시스템 개발자의 기술력 Apache Hadoop
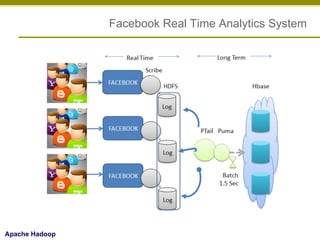
- 13. Facebook Real Time Analytics System Apache Hadoop
- 14. Unstructured Data • 데이터는 유형, 특성 등으로 잘 저장해야 잘 사용할 수 있다! • 데이터의 약 20%는 정형 데이터, 80%는 비정형 데이터 • Blog, SNS, Mobile 등을 통해 비정형 데이터는 더욱더 빠르게 증가 추세 • 80%의 비정형 데이터를 어떻게 분석할 것인가? • 비정형 데이터를 이용하여 의미 있는 정보를 찾아내는 것은 정형 데이터를 분석하는 것보 다 훨씬 복잡 • 비정형 데이터를 정형화 구조로 변환 작업 필요 • 전체 아키텍쳐에서 가장 적절한 변환 작업 위치 선정 필요 Apache Hadoop
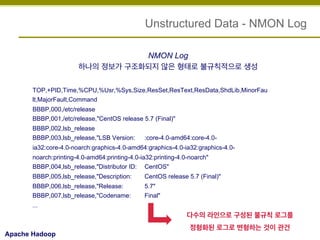
- 16. Unstructured Data - NMON Log NMON Log 하나의 정보가 구조화되지 않은 형태로 불규칙적으로 생성 TOP,+PID,Time,%CPU,%Usr,%Sys,Size,ResSet,ResText,ResData,ShdLib,MinorFau lt,MajorFault,Command BBBP,000,/etc/release BBBP,001,/etc/release,"CentOS release 5.7 (Final)" BBBP,002,lsb_release BBBP,003,lsb_release,"LSB Version: :core-4.0-amd64:core-4.0- ia32:core-4.0-noarch:graphics-4.0-amd64:graphics-4.0-ia32:graphics-4.0noarch:printing-4.0-amd64:printing-4.0-ia32:printing-4.0-noarch" BBBP,004,lsb_release,"Distributor ID: CentOS" BBBP,005,lsb_release,"Description: CentOS release 5.7 (Final)" BBBP,006,lsb_release,"Release: BBBP,007,lsb_release,"Codename: 5.7" Final" ... 다수의 라인으로 구성된 불규칙 로그를 Apache Hadoop 정형화된 로그로 변형하는 것이 관건
- 17. Log Aggregator – Cloudera Flume Apache Hadoop
- 18. Log Aggregator – Apache Flume NG Apache Hadoop
- 19. Complex Event Processing? • CEP는 실시간 대용량 Event 처리 기술 • CEP는 EDA(Event-driven architecture) 기반 시스템 • Mutliple event stream에서 발생하는 패턴 감지 기술 Apache Hadoop
- 20. Complex Event Processing? • 교회에서... • 벨이 울린다. • 턱시도를 입은 남자와 꽃을 든 여자가 함께 걷는다. • 두 사람 위로 꽃 잎이 날리고 폭죽이 터진다. Apache Hadoop
- 21. Complex Event Processing? CEP 기술은 이러한 Complex한 Event를 참조하여 결혼식이라는 것을 알아 차린다. Apache Hadoop
- 22. Complex Event Processing? • Algorithmic Stock-Trading • Real-time analytics • Predictive analytics • BAM - Business Activity Monitoring • BI - Business intelligence Apache Hadoop
- 23. Complex Event Processing? • Core Concept 용어 정리 용어 정의 이벤트 실제로 발생한 사건, 일, 메시지 상태의 변경 특정한 액션 또는 상태의 변화를 통해 발생하는 변경이 불가 능한 과거의 기록 이벤트 스트림 시간의 순서대로 연속되는 이벤트의 흐름 시작과 끝이 없는 이벤트의 연속된 흐름 실시간의 특징 현저하게 낮은 수준의 지연 일정한 응답속도 예측 가능한 성능 Apache Hadoop
- 24. OpenSource CEP : Esper • GPL v2 라이선스, Oracle CEP의 엔진 • 경량의 Complex Event Processing Implementation Apache Hadoop
- 25. OpenSource CEP : Esper • GPL v2 라이선스, Oracle CEP의 엔진 • 경량의 Complex Event Processing Implementation Apache Hadoop
- 26. OpenSource CEP : Esper // Java Object public static class StockTick { String symbol; Double price; Date timeStamp; } // Esper Event Query (EPL) // Apple의 Tick이 평균 6이상, 2건 발생한 경우 select * from StockTick(symbol='AAPL').win:length(2) having avg(price) > 6.0 Apache Hadoop
- 27. OpenSource CEP : Esper EPServiceProvider epService = EPServiceProviderManager.getDefaultProvider(); String expression = "select avg(price) from org.myapp.event.OrderEvent.win:time(30 sec)"; EPStatement statement = epService.getEPAdministrator().createEPL(expression); public class MyListener implements UpdateListener { public void update(EventBean[] newEvents, EventBean[] oldEvents) { EventBean event = newEvents[0]; System.out.println("avg=" + event.get("avg(price)")); } } MyListener listener = new MyListener(); statement.addListener(listener); Apache Hadoop
- 28. OpenSource CEP : Esper • 최근 30분내 시청 근처에 있었던 급여가 10M 이상이며 나이가 30~35세 이상이고 집이 강남이면서 취미가 쇼핑인 여성 select * from customer(age=’30~35’,gender='female',salary>10M, location='city hall', home='gangnam',hobby='shopping').win:time(30 min) Volume : Analytics (Apache Hadoop) Apache Hadoop Velocity : Real-Time (CEP; Esper)
- 29. 로그 수집기와 CEP를 이용한 실시간 처리 아키텍처 Apache Hadoop
- 30. 로그 수집기와 CEP를 이용한 실시간 처리 아키텍처 Apache Hadoop 30
- 31. Summary • Real-Time Big Data는 • Real-Time과 Analytics의 Convergence • High Technology • 아직까지 Real-Time 이벤트 처리 기술인 CEP에 대한 이해 부족으로 인 하여 시장에서 적용 사례 부족 • 향후 Big Data 시장에서 강력한 폭풍이 될 것 Apache Hadoop
- 32. References • Big Data Use-Case: Real-time Dispenser Maintenance • http://jameskaskade.com/?p=2177 • Real Time analytics for Big Data: Facebook's New Realtime Analytics System • http://tinyurl.com/3cgg6yr • Esper Documentation • http://esper.codehaus.org/esper-4.5.0/doc/reference/en/ html_single/index.html Apache Hadoop