reference_guide_Kernel_Crash_Dump_Analysis
7 likes3,058 views

The document provides an overview of kernel crash dump analysis, including: 1) It defines a kernel panic as the operating system's response to an unrecoverable internal error, and lists the primary causes as software bugs, hardware faults, firmware issues, or manual/conditional triggers. 2) It explains that a kernel crash dump (vmcore) captured during a panic or system hang is required to determine the root cause. 3) It describes a system hang as an unresponsive state depending on the observer, with possible causes including bugs, hardware/firmware faults, resource overload, or hypervisor issues.

![Basics of kernel panic and system hang
[Q:1] What is kernel panic?
[Q:2] What are the different causes of kernel panic?
[Q:3] What data is required to determine the root cause of a kernel panic?
[Q:4] What is the system hang?
[Q:5] What data is required to determine the cause of system hang?
[Q:6] What are the different causes of the system hang?
[Q:7] What is the difference between the system crash and the system hang?
kdump and different methods available to capture a kernel crash dump (vmcore)
[Q:1] What is kdump?
[Q:2] How does it work?
[Q:3] What are the different kdump configuration files and directives?
[Q:4] How to configure kdump service?
[Q:5] How to test kdump setup?
[Q:6] How to verify kernel crash dump (vmcore)?
[Q:7] What is a kernel crash dump (vmcore)?
[Q:8] What kind of data is contained in a kernel crash dump (vmcore)?
[Q:9] When will the kernel crash dump (vmcore) be collected?
[Q:10] What are the different mechanisms available to capture kernel crash dump (vmcore) at the time of
system hang?
[Q:11] Who needs kernel crash dump (vmcore) and why?
[Q:12] What are the limitations of vmcore analysis?
Basics of crash
[Q:1] What are the tools/data required to perform a kernel crash dump analysis?
[Q:2] What is crash utility?
[Q:3] How to open a kernel crash dump (vmcore) for analysis?
[Q:4] What are the basic commands of crash utility?
[Q:5] What is crash extension module?
[Q:6] How to build a crash extension (not supported by Red Hat Support)?
[Q:7] How to load a crash extension?
Initial Analysis
[Q:1] How to check basic system information?
[Q:2] How to check hardware information?
[Q:3] How to check kernel ring buffer (dmesg)?
[Q:4] How to determine the panic task?
[Q:5] How to check the backtrace of panic task?
[Q:6] How to determine the UID and GID of a process?
[Q:7] How to display parental hierarchy of a process?
[Q:8] How to display the child task of a process?
[Q:9] How to check list of open files by panic task?
[Q:10] How to check task priority and policy ?
[Q:11] How to check the the command line arguments and environment strings of task ?
[Q:12] How to determine resource limits (rlimits) of a process?](https://image.slidesharecdn.com/d2c53af2-eb6d-4e55-87be-19a5ef3df99e-160202112627/85/reference_guide_Kernel_Crash_Dump_Analysis-2-320.jpg)
![[Q:13] How to determine total number of tasks in different state?
[Q:14] How to display only user space process?
[Q:15] How to display only kernel threads?
[Q:16] How to check the total time of a process in a specific state?
[Q:17] How to check run queue of each CPU?
[Q:18] How to determine the values of sysctl parameter from vmcore?
Memory Subsystem
[Q:1] How to check overall memory usage on the system?
[Q:2] How to check perzone memory statistics?
[Q:3] How to determine memory usage in userspace?
[Q:4] How to determine swap memory usage of each task?
[Q:5] How to determine memory usage in kernelspace?
[Q:6] How to check memory allocated for hugepages?
[Q:7] How to check memory allocated to VMware ballooning driver (RHEL 6+)?
[Q:8] How to displays information for each configured swap device?
Storage Subsystem
[Q:1] How to display disk I/O statistics?
[Q:2] How to check the status of disks ( online/offline )?
[Q:3] How to determine the default I/O scheduler set?
[Q:4] How to determine the I/O scheduler set on a specific disk?
Network Subsystem
[Q:1] How to display the system's network device list?
[Q:2] How to display ARP cache?
pykdump
[Q:1] What is pykdump (not supported by Red Hat Support)?
[Q:2] How to use pykdump?](https://image.slidesharecdn.com/d2c53af2-eb6d-4e55-87be-19a5ef3df99e-160202112627/85/reference_guide_Kernel_Crash_Dump_Analysis-3-320.jpg)
![Basics of kernel panic and system hang
[Q:1] What is kernel panic?
o A kernel panic is an action taken by an operating system upon detecting an internal fatal error from which it
cannot safely recover.
o It is possible for kernel code to indicate such a condition by calling the panic function declared in the header
file "sys/system.h".
[Q:2] What are the different causes of kernel panic?
Kernel can crash due to many reasons but to list a few following are the four primary causes of kernel panic:
o Software problems:
o Bug in kernel
o Bug in kernel module
o Bug in unsigned (U) proprietary (P) kernel module
o Bug in hypervisor etc.
o Hardware problems:
o Faulty RAM (Physical Memory)
o Faulty Processor
o Faulty PCI interfaces and USB devices etc.
o Firmware/BIOS problems:
o Bug in firmware
o Bug in BIOS.
o Manual or condition panic:
o Panic on SysRq event (c)
o Panic on OOM detection
o Panic on hung task detection
o Panic on soft lockup detection etc.
Examples of Software Problems:
******************************
Invalid conditions:](https://image.slidesharecdn.com/d2c53af2-eb6d-4e55-87be-19a5ef3df99e-160202112627/85/reference_guide_Kernel_Crash_Dump_Analysis-4-320.jpg)

![Kernel panic not syncing: softlockup: hung tasks
o Panic triggered by GAB module (Veritas cluster suite fencing module)
Kernel panic not syncing: GAB: Port h halting system due to client process failure"
o Panic triggered by HP Watchdog timer module [hpwdt]:
Kernel panic not syncing: An NMI occurred, please see the Integrated Management Log for details.
o Panic triggered by NMI watchdog.
Kernel panic not syncing: Watchdog detected hard LOCKUP on cpu 0
o Panic triggered by Oracle RAC (cssdmonitor or cssdagent) via SysRq event (c)
PANIC: "SysRq : Trigger a crashdump"
Most of the time these messages explain what caused the panic but sometimes these diagnostic messages are
not enough to determine the actual cause of the panic.
[Q:3] What data is required to determine the root cause of a
kernel panic?
o Kernel Crash Dump (vmcore) captured at the time of issue.
**OR**
o Complete Screenshot of the kernel panic or console message.
[Q:4] What is the system hang?
o There is no standard definition of the system hang.
o The system hang is a "fuzzy" concept which depends on the "criteria" of the observer (end user).
Examples:
*********
o User's are unable to Login on the system via console or ssh.
o Unable to ping the server.
o The system gets partially or completely stalled and most services become unresponsive.
o System responds to user inputs with an obvious latency (an unacceptable length of time according to the
observer).](https://image.slidesharecdn.com/d2c53af2-eb6d-4e55-87be-19a5ef3df99e-160202112627/85/reference_guide_Kernel_Crash_Dump_Analysis-6-320.jpg)
![[Q:5] What data is required to determine the cause of system
hang?
o Collect as much as possible information:
Examples:
*********
o How did you determined that the system is in unresponsive state or hang?
o What are the symptoms?
o Details of any misbehavior or suspicious activity (resource utilization).
o Details of any recent changes made on the server prior to the incident.
o Kernel Crash Dump (vmcore) captured at the time of incident.
[Q:6] What are the different causes of the system hang?
Some possibilities:
*******************
o Bug in kernelspace/userspace.
o Faulty hardware/firmware.
o Excessive resource utilization.
o Bug in Hypervisor.
o Unexpected behavior of Hypervisor etc.
[Q:7] What is the difference between the system crash and the
system hang?
[**System Crash**]
o The system crashes due to problem(s) in the "kernel space".
o A programming error.
o A defective piece of hardware.
o An unsupported operation etc.
o In these cases, an oops message is displayed on the console to help with the diagnosis.
o A kernel panic is much easier to troubleshoot.](https://image.slidesharecdn.com/d2c53af2-eb6d-4e55-87be-19a5ef3df99e-160202112627/85/reference_guide_Kernel_Crash_Dump_Analysis-7-320.jpg)
![o It gives you the kernel panic message and the stack trace of the panic task.
[**System Hang**]
o The system hangs are more subtle:
o They can be as simple as temporary performance problems caused by inefficient algorithms.
o Or as complicated as deadlocks that freeze the system forever.
o No kernel oops message is displayed on the console, which can make the troubleshooting process tedious.
o You do not know which process caused the hang and why did the hang occur.
o Complex to troubleshoot and can take a long time to understand the problem and its root cause.
kdump and different methods available to
capture a kernel crash dump (vmcore)
[Q:1] What is kdump?
o Kdump is a kexec based crash dumping mechanism for Linux kernel.
o Kdump functionality is broken mainly in two components, user space (kexec) and kernel space (kdump).
o Kernel space patches are already part of the main line kernel tree.
o kdump support in kernel:
# grep CRASH_DUMP /boot/config2.6.32431.el6.x86_64
CONFIG_CRASH_DUMP=y
o User space component is nothing but a patch on top of existing kexec tools.
# grep "CONFIG_KEXEC=" /boot/config2.6.32431.el6.x86_64
CONFIG_KEXEC=y
o Kdump needs two different kernel, one we can call standard (production) kernel and another we can call crash
(capture) kernel.
o The crash dumps are captured from the context of a freshly booted kernel; not from the context of the crashed](https://image.slidesharecdn.com/d2c53af2-eb6d-4e55-87be-19a5ef3df99e-160202112627/85/reference_guide_Kernel_Crash_Dump_Analysis-8-320.jpg)
![kernel.
o Kdump can be configured to dump either directly to a device, to a file, or to some location on the network via
NFS or SSH.
o Kdump and kexec are currently supported on the x86, x86_64, aarch64, ppc64, ia64, and s390x architectures.
[Q:2] How does it work?
o Whenever the standard (production) kernel crashes, kdump uses kexec to boot into a crash (capture) kernel.
o This crash (capture) kernel boots with very little prereserved memory and captures the image of physical
memory.
o The standard (production) kernel reserves a section of memory that the crash (capture) kernel uses to boot.
o Be aware that the memory reserved for the kdump kernel at boot time cannot be used by the standard kernel.
o Kexec enables booting the capture kernel without going through the BIOS, so contents of the first kernel's
memory are preserved, which is essentially the kernel crash dump (vmcore).
[Q:3] What are the different kdump configuration files and
directives?
o The following two configuration files are used to configure kdump.
o /etc/sysconfig/kdump { configuraiton file for kexec kernel }
o /etc/kdump.conf { configuration file for kdump service }
o Detail information of different directives are present in these configuration files.
a) /etc/sysconfig/kdump file.
KDUMP_KERNELVER
o Used to set the kernel version string for the kdump kernel (optional).
o Leave it empty to use the autodetection mechanism (strongly recommended).
Eg:
KDUMP_KERNELVER=""
OR](https://image.slidesharecdn.com/d2c53af2-eb6d-4e55-87be-19a5ef3df99e-160202112627/85/reference_guide_Kernel_Crash_Dump_Analysis-9-320.jpg)


![notification to).
Eg:
fence_kdump_args p 7410 f auto c 0 i 10
fence_kdump_nodes <node(s)>
o List of cluster node(s) separated by space to send fence_kdump notification to (this option is mandatory to
enable fence_kdump).
Eg:
fence_kdump_nodes node1 node2
[Q:4] How to configure kdump service?
a) Set kernel boot parameter "crashkernel" to reserve memory for crash/kdump kernel.
Three different formats for "crashkernel" parameter.
o crashkernel=auto { Automatically calculates memory for crash kernel }
o crashkernel=128M { Reserves 128M of memory for crash kernel }
o crashkernel=512M2G:64M,2G:128M { This would mean: }
1) if the RAM is smaller than 512M, then don't reserve anything
(this is the "rescue" case)
2) if the RAM size is between 512M and 2G (exclusive), then reserve 64M
3) if the RAM size is larger than 2G, then reserve 128M.
The size of "crashkernel" parameter depends on;
o Machine Architecture.
o Total amount of installed system memory.
o [ 128 MB + 4 bits for every 4KB page ]
i386 and x86_64 : 64M for small machines (about 2 GiB of RAM, 4 cores) and 128M for larger machines.
PPC64 : 128M for small machines and 256M for larger machines.
IA64 : 256M for small machines, 512M for medium machines and 1G and more for large machines.
b) Reboot the system.
c) Verify the memory reserved for crash/kdump kernel.
o Check /proc/cmdline to confirm system is booted with "crashkernel" parameter.](https://image.slidesharecdn.com/d2c53af2-eb6d-4e55-87be-19a5ef3df99e-160202112627/85/reference_guide_Kernel_Crash_Dump_Analysis-15-320.jpg)


![# chkconfig kdump on
j) Start kdump service.
Eg:
# service kdump start
k) Verify kdump service status.
Eg:
# service kdump status
[Q:5] How to test kdump setup?
o Enable magic key "SysRq" to trigger kernel panic.
Eg:
# echo 1 > /proc/sys/kernel/sysrq
o Trigger SysRq panic event (c) to crash the system manually.
Eg:
# echo c > /proc/sysrqtrigger
[Q:6] How to verify kernel crash dump (vmcore)?
o Check directory set by "path" in kdump.conf file for "vmcore" and "vmcoredmesg.txt" files.
Eg:
# tree /var/crash/
/var/crash/
└── 127.0.0.12015.06.0817:25:32
├── vmcore
└── vmcoredmesg.txt
1 directory, 2 files](https://image.slidesharecdn.com/d2c53af2-eb6d-4e55-87be-19a5ef3df99e-160202112627/85/reference_guide_Kernel_Crash_Dump_Analysis-18-320.jpg)
![[Q:7] What is a kernel crash dump (vmcore)?
o Kernel crash dump (vmcore) is a dump of all the physical memory (RAM, registers, but not swap) at a
particular point in time.
o Kernel crash dump captures the state of kernel at the moment of panic.
"Kernel crash dump (vmcore) is just a snapshot of the physical memory at the time of crash"
[Q:8] What kind of data is contained in a kernel crash dump
(vmcore)?
o Kernel Space data:
o Kernel space data structure.
o Kernel ring buffer (“dmesg”)
o CPU state and its registers information
o Memory usage information
o Run queue information
o Mounted file systems information
o Disk device information
o Inflight I/O information
o Process state and their kernel mode stack information
o IRQ handling information
o etc.
o User Space data:
o User space data structure.
o Application data in physical memory etc.
[Q:9] When will the kernel crash dump (vmcore) be collected?
o The kdump service dumps the kernel crash dump (vmcore) **only** at the time of kernel **panic**.
o The kernel panic can be triggered after one of the following events:
a) Automatically:](https://image.slidesharecdn.com/d2c53af2-eb6d-4e55-87be-19a5ef3df99e-160202112627/85/reference_guide_Kernel_Crash_Dump_Analysis-19-320.jpg)
![o Due to bug kernel
o Due to bug in kernel modules
o Due to memory corruption
o Due to invalid pointer access
o Due to hardware problems
o Due to conditional switches
o Panic on OOM (vm.panic_on_oom = 1)
o Panic on hung task detection (kernel.hung_task_panic = 1)
o Panic on soft lockup detection (kernel.softlockup_panic = 1)
o etc.
b) Manually:
o Using SysRq facility.
o Using NMI via IPMI tool.
o Using NMI via virsh command.
o etc.
[Q:10] What are the different mechanisms available to capture
kernel crash dump (vmcore) at the time of system hang?
[**Physical Machine**]
a) Using SysRq:
How to enable SysRq key?
o Set the value of kernel.sysrq to 1 in /etc/sysctl.conf file.
# grep sysrq /etc/sysctl.conf
kernel.sysrq = 1
o Execute sysclt p for the changes to take effect.
# sysctl p
**OR**
o Execute # echo "1" > /proc/sys/kernel/sysrq
How to trigger panic?](https://image.slidesharecdn.com/d2c53af2-eb6d-4e55-87be-19a5ef3df99e-160202112627/85/reference_guide_Kernel_Crash_Dump_Analysis-20-320.jpg)
![o Execute # echo "c" > /proc/sysrqtrigger
OR
o Press key combination [ Ctrl + Alt + SysRq + C ]
b) Using NMI via IPMI tool:
o Execute # ipmitool I lan H <Host> U <User ID> a chassis power diag
c) Using NMI jumper pins or dump switch:
o You can initiate a NMI event through the jumper pins or dump switch provided on the Hardware ( check the
hardware manual for more information).
d) Using HP iLO Virtual NMI Button:
o ProLiant servers with iLO can initiate an NMI crash dump through a web browser. The iLO based Virtual NMI
button allows users to trigger an NMI without requiring physical access to the server chassis or knowing the
precise location of the NMI control for the host.
[**Virtual Machine**]
a) Using SysRq: [libvirt] [VMware]
o Execute # echo "c" > /proc/sysrqtrigger
**OR**
o Press key combination [ Ctrl + Alt + SysRq + C ]
b) Using virsh dump command: [libvirt]
o virsh dump command sends a request to dump the core of a guest virtual machine to a file.
o Execute # virsh dump <vmname> /storage/<vmname>.dump
c) Using NMI via virsh command: [libvirt]
o virsh injectnmi command injects NMI (nonmaskable interrupt) message to the guest virtual machine.
o Execute # virsh injectnmi guest1](https://image.slidesharecdn.com/d2c53af2-eb6d-4e55-87be-19a5ef3df99e-160202112627/85/reference_guide_Kernel_Crash_Dump_Analysis-21-320.jpg)
![d) Using gcore command: [libvirt]
o Identify the PID of the qemukvm process running the guest:
Eg:
# ps aux | grep qemukvm
USER PID %CPU %MEM VSZ RSS TTY STAT START TIME COMMAND
qemu 12345 0.4 4.9 1320252 808212 ? Sl Sep10 6:55 /usr/libexec/qemukvm name rhel6
o Capture an application core using gcore command against this PID:
# gcore <PID of guest process>
Eg:
# gcore 12345
Saved corefile core.12345
e) Using VMware® vmss2core tool: [VMWare] (Not supported by Red Hat Support)
o Suspend the virtual machine (.vmss file) or take a snapshot with memory (.vmsn file).
o Use tool vmss2core (VMWare Labs) to transform the raw dump into ELF dump.
Eg:
# vmss2core N6 <vmName>.vmss
o Download link for VMware® vmss2core tool:
https://labs.vmware.com/flings/vmss2core
f) Using xm command: [Xen Guest]
o You can use xm to perform a memory dump of an existing virtual machine. This command dumps the virtual
machine's memory to the xendump file located in the /var/xen/dump/ directory
o Execute # xm dumpcore [C] [domainid]
[Q:11] Who needs kernel crash dump (vmcore) and why?
o Kernel developers : To identify the cause of kernel panic. It helps them to fix the bug.
o Enterprise customers: To get the root cause analysis and take corrective action(s) accordingly e.g. patch the
servers with a bug fix package inorder to avoid the downtime in future.](https://image.slidesharecdn.com/d2c53af2-eb6d-4e55-87be-19a5ef3df99e-160202112627/85/reference_guide_Kernel_Crash_Dump_Analysis-22-320.jpg)
![[Q:12] What are the limitations of vmcore analysis?
o A vmcore is not useful when the system is not experiencing any problem.
o A vmcore is a snapshot. It does not capture a complete history. History reconstruction may not be possible.
o A vmcore analysis can be costly due to complexity and the possible need for indepth kernel expertise.
Basics of crash
[Q:1] What are the tools/data required to perform a kernel crash
dump analysis?
a) crash utility (/usr/bin/crash)
o Provided by "crash" package.
Eg: crash6.0.42.el6.x86_64.rpm
o No cross platform support.
o Use 32 bit version of crash for vmcore capture from 32 bit kernel.
o Use 64 bit version of crash for vmcore captured from 64 bit kernel.
o Similarly for s390, s390x and PPC.
How to install?
Eg:
# yum install crash
**OR**
Eg:
# rpm ivh crash6.0.42.el6.x86_64.rpm
Compile from upstream code (not supported by Red Hat Support):
Eg:](https://image.slidesharecdn.com/d2c53af2-eb6d-4e55-87be-19a5ef3df99e-160202112627/85/reference_guide_Kernel_Crash_Dump_Analysis-23-320.jpg)

![c) A machine of same architecture as of kernel from which vmcore was captured.
o A vmcore captured from a x86_64 machine can only be viewed on an x86_64 machine.
o Similarly a vmcore from a s390 machine can only be viewed on an s390 machine.
d) kernel crash dump file (vmcore)
o Captured using kdump/diskdump/netdump/xendump/LKCD/vmss2core etc mechanisms.
e) Source code of the crashed kernel (optional)
o Provided by "src" rpm package of kernel.
Eg: kernel2.6.32431.el6.src.rpm
o The version of "src" rpm package of kernel must match with the version of kernel from which vmcore was
captured.
How to install?
Eg:
# rpm ivh kernel2.6.32431.el6.src.rpm
**OR**
Eg:
# rpm2cpio kernel2.6.32431.el6.src.rpm | cpio idv
[Q:2] What is crash utility?
o crash utility allows you to interactively analyze a running Linux system as well as a core dump created by
netdump, diskdump, xendump, or kdump mechanism.
[Q:3] How to open a kernel crash dump (vmcore) for analysis?
o crash requires a valid kernel memory image to interpret. If a memory image argument is not entered, the
session will be invoked on the live system, which typically requires root privileges because of the device file
used to access system RAM.](https://image.slidesharecdn.com/d2c53af2-eb6d-4e55-87be-19a5ef3df99e-160202112627/85/reference_guide_Kernel_Crash_Dump_Analysis-25-320.jpg)
![o By default /dev/crash will be used if it exists.
o If it does not exist, then /dev/mem will be used.
[**crash invocation methods (offline/online)**]
a) Typical postmortem debugging: [ offline ]
Syntax:
# crash /path/to/vmlinux /path/to/vmcore
o Kernel object file and memory image are supplied, respectively.
Eg:
# crash osrelease vmcore
2.6.32431.el6.x86_64
# crash d 1 vmcore| grep RELEASE
OSRELEASE=2.6.32431.el6.x86_64
# strings vmcore| head n 5
KDUMP
Linux
bsingh.kernel.org
2.6.32431.el6.x86_64
#1 SMP Sun Nov 10 22:19:54 EST 2013
# crash /var/crash/vmcore /usr/lib/debug/lib/modules/2.6.32431.el6.x86_64/vmlinux
b) Live memory debugging: [ online ]
# crash vmlinux
o /proc/kcore used by default for live memory image.
c) Live memory debugging (with vmlinux search):
# crash
o Predefined directories are searched for proper vmlinux
o Version string matched to the running kernel (/proc/version)](https://image.slidesharecdn.com/d2c53af2-eb6d-4e55-87be-19a5ef3df99e-160202112627/85/reference_guide_Kernel_Crash_Dump_Analysis-26-320.jpg)
![[Q:4] What are the basic commands of crash utility?
o sys : Display essential system information.
o sys i : Dump the DMI string data if available in the kernel.
o mach : Machine specific data.
o mach c : Display each cpu's cpuinfo structure.
o log : Display the kernel ring buffer log. This is the same as "dmesg".
o log m : Display the message log level in brackets preceding each message.
o set : Set or display a process context.
o set p : Sets the context to the panic task.
o bt : Display a kernel stack backtrace. (by default the stack trace of the current context)
o bt a : Displays the stack traces of the active task on each CPU.
o bt f : Display all stack data contained in a frame.
o dis : Disassemble a function or symbol.
o whatis : Displays the definition of structures, unions, typedefs or text/data symbols.
o kmem i : Displays information about the use of kernel memory.
o kmem s : Displays basic kmalloc() slab data.
o kmem V : Dump the vm_table contents.
o kmem f : Display and verify free memory data.
o swap : Display swap device information.
o ipcs : System V IPC facilities.
o ps : Displays process status for selected, or all, processes in the system.
o runq : Displays the tasks on the run queues of each cpu.
o mount : Displays basic information about the currentlymounted filesystems.
o files : Display the open files of the current context.
o dev : Display character and block device data.
o dev d : Display disk I/O statistics.
o net : Display the system's network device list.
o net n : Display the network device list with respect to the network namespace.
o net a : Display the ARP cache.
o irq : Display IRQ data.
o list : Dumps the contents of a linked list.
o mod : Display the currentlyinstalled modules.
o mod t : Display modules that are "tainted".
o rd : Read memory.
o task : Dump the task_struct and thread_info structures of the current context in hexadecimal format.
o p : Print the value of an expression. (use d : Decimal, h : Hexadecimal, o: Octal )
o exit : Exit the crash session.
o q : Exit this session.
o extend : Dynamically loads or unloads crash extension shared object libraries.
o help : Get help.](https://image.slidesharecdn.com/d2c53af2-eb6d-4e55-87be-19a5ef3df99e-160202112627/85/reference_guide_Kernel_Crash_Dump_Analysis-27-320.jpg)
![[Q:5] What is crash extension module?
o The crash utility was designed with extensibility in mind. You can create shared object library files consisting
of crash command extensions, that can be dynamically linked into the crash executable during runtime or during
initialization.
[Q:6] How to build a crash extension (not supported by Red Hat
Support)?
Eg:
# git clone https://github.com/crashutility/crash.git
# cd crash/
# make
# make install
# cd extensions/
# wget http://people.redhat.com/anderson/extensions/swap_usage.c
# cd ..
# make extensions
# gcc Wall g nostartfiles shared rdynamic o swap_usage.so swap_usage.c fPIC DX86_64 DGDB_7_6
# ls l extensions/swap_usage.so
rwxrxrx. 1 root root 54101 Jan 22 21:11 extensions/swap_usage.so
[Q:7] How to load a crash extension?
Syntax:
crash> extend /path/to/<name>.so
Eg:
crash> extend crash/extensions/swap_usage.so
./crash/extensions/swap_usage.so: shared object loaded
crash> pswap h
pswap: invalid option 'h'
Usage:
pswap [k G] [pid | taskp]](https://image.slidesharecdn.com/d2c53af2-eb6d-4e55-87be-19a5ef3df99e-160202112627/85/reference_guide_Kernel_Crash_Dump_Analysis-28-320.jpg)
![Enter "help pswap" for details.
Initial Analysis
[Q:1] How to check basic system information?
"sys" command displays essential system information.
crash> sys
Eg:
crash> sys
KERNEL: /usr/lib/debug/lib/modules/2.6.32431.el6.x86_64/vmlinux
DUMPFILE: /var/crash/127.0.0.12016012117:45:34/vmcore [PARTIAL DUMP]
CPUS: 4
DATE: Thu Jan 21 17:45:30 2016
UPTIME: 00:02:01
LOAD AVERAGE: 0.49, 0.30, 0.11
TASKS: 264
NODENAME: bsingh.kernel.org
RELEASE: 2.6.32431.el6.x86_64
VERSION: #1 SMP Sun Nov 10 22:19:54 EST 2013
MACHINE: x86_64 (2790 Mhz)
MEMORY: 5.8 GB
PANIC: "SysRq : Trigger a crash"
[Q:2] How to check hardware information?
The option (i) of "sys" command dumps the Desktop Management Interface (DMI) string data if available in the
kernel.
crash> sys i
Eg:
crash> sys i](https://image.slidesharecdn.com/d2c53af2-eb6d-4e55-87be-19a5ef3df99e-160202112627/85/reference_guide_Kernel_Crash_Dump_Analysis-29-320.jpg)
![DMI_BIOS_VENDOR: Seabios
DMI_BIOS_VERSION: 0.5.1
DMI_BIOS_DATE: 01/01/2007
DMI_SYS_VENDOR: Red Hat
DMI_PRODUCT_NAME: KVM
DMI_PRODUCT_VERSION: RHEL 6.5.0 PC
DMI_PRODUCT_SERIAL:
DMI_PRODUCT_UUID: 3D51C070C307BD3A281DCA1A689C22C6
DMI_CHASSIS_VENDOR: Red Hat
DMI_CHASSIS_TYPE: 1
DMI_CHASSIS_VERSION:
DMI_CHASSIS_SERIAL:
DMI_CHASSIS_ASSET_TAG:
DMI_SMBIOS_VERSION: 2.4
OR
crash> log | grep DMI:
DMI: Red Hat KVM, BIOS 0.5.1 01/01/2007
[Q:3] How to check kernel ring buffer (dmesg)?
"log" or "dmesg" command dumps the kernel log_buf contents in chronological order.
crash> log
crash> dmesg
Eg:
crash> log | tail n 38
SysRq : Trigger a crash
BUG: unable to handle kernel NULL pointer dereference at (null)
IP: [<ffffffff8134b6c6>] sysrq_handle_crash+0x16/0x20
PGD 140aff067 PUD 140a9f067 PMD 0
Oops: 0002 [#1] SMP
last sysfs file: /sys/devices/pci0000:00/0000:00:01.2/usb1/11/speed
CPU 2
Modules linked in: nfsd lockd nfs_acl auth_rpcgss exportfs autofs4 sunrpc bnx2fc cnic uio fcoe 8021q libfcoe
garp stp libfc llc scsi_transport_fc scsi_tgt xt_NFQUEUE iptable_filter ip_tables ip6t_REJECT](https://image.slidesharecdn.com/d2c53af2-eb6d-4e55-87be-19a5ef3df99e-160202112627/85/reference_guide_Kernel_Crash_Dump_Analysis-30-320.jpg)
![nf_conntrack_ipv6 nf_defrag_ipv6 xt_state nf_conntrack ip6table_filter ip6_tables ipv6 uinput microcode
virtio_balloon virtio_net snd_hda_intel snd_hda_codec snd_hwdep snd_seq snd_seq_device snd_pcm
snd_timer snd soundcore snd_page_alloc i2c_piix4 i2c_core ext4 jbd2 mbcache virtio_blk pata_acpi
ata_generic ata_piix virtio_pci virtio_ring virtio dm_mirror dm_region_hash dm_log dm_mod [last unloaded:
speedstep_lib]
Pid: 2187, comm: bash Not tainted 2.6.32431.el6.x86_64 #1 Red Hat KVM
RIP: 0010:[<ffffffff8134b6c6>] [<ffffffff8134b6c6>] sysrq_handle_crash+0x16/0x20
RSP: 0018:ffff8801422bde18 EFLAGS: 00010096
RAX: 0000000000000010 RBX: 0000000000000063 RCX: 0000000000000000
RDX: 0000000000000000 RSI: 0000000000000000 RDI: 0000000000000063
RBP: ffff8801422bde18 R08: 0000000000000000 R09: 203a207152737953
R10: 0000000000000000 R11: 0000000000000000 R12: 0000000000000000
R13: ffffffff81b01a40 R14: 0000000000000286 R15: 0000000000000007
FS: 00007ffdf778f700(0000) GS:ffff880028280000(0000) knlGS:0000000000000000
CS: 0010 DS: 0000 ES: 0000 CR0: 0000000080050033
CR2: 0000000000000000 CR3: 0000000140815000 CR4: 00000000000006e0
DR0: 0000000000000000 DR1: 0000000000000000 DR2: 0000000000000000
DR3: 0000000000000000 DR6: 00000000ffff0ff0 DR7: 0000000000000400
Process bash (pid: 2187, threadinfo ffff8801422bc000, task ffff88018d4e8ae0)
Stack:
ffff8801422bde68 ffffffff8134b982 ffff88018d4e8ae0 ffff880100000000
<d> 0000000000000300 0000000000000002 ffff880140ace3c0 00007ffdf7799000
<d> 0000000000000002 fffffffffffffffb ffff8801422bde98 ffffffff8134ba3e
Call Trace:
[<ffffffff8134b982>] __handle_sysrq+0x132/0x1a0
[<ffffffff8134ba3e>] write_sysrq_trigger+0x4e/0x50
[<ffffffff811f328e>] proc_reg_write+0x7e/0xc0
[<ffffffff81188f78>] vfs_write+0xb8/0x1a0
[<ffffffff81189871>] sys_write+0x51/0x90
[<ffffffff8100b072>] system_call_fastpath+0x16/0x1b
Code: d0 88 81 a3 1c fe 81 c9 c3 66 66 66 2e 0f 1f 84 00 00 00 00 00 55 48 89 e5 0f 1f 44 00 00 c7 05 0d 07
75 00 01 00 00 00 0f ae f8 <c6> 04 25 00 00 00 00 01 c9 c3 55 48 89 e5 0f 1f 44 00 00 8d 47
RIP [<ffffffff8134b6c6>] sysrq_handle_crash+0x16/0x20
RSP <ffff8801422bde18>
CR2: 0000000000000000
[Q:4] How to determine the panic task?
The option (p) of "set" command sets the context to the panic task, or back to the crash task on a live system.](https://image.slidesharecdn.com/d2c53af2-eb6d-4e55-87be-19a5ef3df99e-160202112627/85/reference_guide_Kernel_Crash_Dump_Analysis-31-320.jpg)
![crash> set p
Eg:
crash> set p
PID: 2187
COMMAND: "bash"
TASK: ffff88018d4e8ae0 [THREAD_INFO: ffff8801422bc000]
CPU: 2
STATE: TASK_RUNNING (SYSRQ)
[Q:5] How to check the backtrace of panic task?
"bt" command displays a kernel stack backtrace. If no arguments are given, the stack trace of the current
context will be displayed.
crash> bt
Eg:
crash> bt
PID: 2187 TASK: ffff88018d4e8ae0 CPU: 2 COMMAND: "bash"
#0 [ffff8801422bd9e0] machine_kexec at ffffffff81038f3b
#1 [ffff8801422bda40] crash_kexec at ffffffff810c5d92
#2 [ffff8801422bdb10] oops_end at ffffffff8152b510
#3 [ffff8801422bdb40] no_context at ffffffff8104a00b
#4 [ffff8801422bdb90] __bad_area_nosemaphore at ffffffff8104a295
#5 [ffff8801422bdbe0] bad_area at ffffffff8104a3be
#6 [ffff8801422bdc10] __do_page_fault at ffffffff8104ab6f
#7 [ffff8801422bdd30] do_page_fault at ffffffff8152d45e
#8 [ffff8801422bdd60] page_fault at ffffffff8152a815
[exception RIP: sysrq_handle_crash+22]
RIP: ffffffff8134b6c6 RSP: ffff8801422bde18 RFLAGS: 00010096
RAX: 0000000000000010 RBX: 0000000000000063 RCX: 0000000000000000
RDX: 0000000000000000 RSI: 0000000000000000 RDI: 0000000000000063
RBP: ffff8801422bde18 R8: 0000000000000000 R9: 203a207152737953
R10: 0000000000000000 R11: 0000000000000000 R12: 0000000000000000
R13: ffffffff81b01a40 R14: 0000000000000286 R15: 0000000000000007
ORIG_RAX: ffffffffffffffff CS: 0010 SS: 0018
#9 [ffff8801422bde20] __handle_sysrq at ffffffff8134b982
#10 [ffff8801422bde70] write_sysrq_trigger at ffffffff8134ba3e
#11 [ffff8801422bdea0] proc_reg_write at ffffffff811f328e
#12 [ffff8801422bdef0] vfs_write at ffffffff81188f78](https://image.slidesharecdn.com/d2c53af2-eb6d-4e55-87be-19a5ef3df99e-160202112627/85/reference_guide_Kernel_Crash_Dump_Analysis-32-320.jpg)
![#13 [ffff8801422bdf30] sys_write at ffffffff81189871
#14 [ffff8801422bdf80] system_call_fastpath at ffffffff8100b072
RIP: 0000003e2c2db560 RSP: 00007fff425f6548 RFLAGS: 00010202
RAX: 0000000000000001 RBX: ffffffff8100b072 RCX: 00000000004b5e34
RDX: 0000000000000002 RSI: 00007ffdf7799000 RDI: 0000000000000001
RBP: 00007ffdf7799000 R8: 000000000000000a R9: 00007ffdf778f700
R10: 0000000000000000 R11: 0000000000000246 R12: 0000000000000002
R13: 0000003e2c58e7a0 R14: 0000000000000002 R15: 0000003e2c58e7a0
ORIG_RAX: 0000000000000001 CS: 0033 SS: 002b
[Q:6] How to determine the UID and GID of a process?
RHEL6:
o task_struct contains the PID of a process.
crash> struct task_struct.pid ox
struct task_struct {
[0x4a8] pid_t pid;
}
o struct cred contains the UID and GID of a process.
crash> struct cred.uid ox
struct cred {
[0x4] uid_t uid;
}
crash> struct cred.gid ox
struct cred {
[0x8] gid_t gid;
}
o struct cred * can be determined from struct task_struct
crash> struct task_struct.cred ox
struct task_struct {
[0x648] const struct cred *cred;
}
Eg:](https://image.slidesharecdn.com/d2c53af2-eb6d-4e55-87be-19a5ef3df99e-160202112627/85/reference_guide_Kernel_Crash_Dump_Analysis-33-320.jpg)
![crash> set 2187 ............{ struct task_struct * }
PID: 2187 /
COMMAND: "bash" |
TASK: ffff88018d4e8ae0 [THREAD_INFO: ffff8801422bc000]
CPU: 2
STATE: TASK_RUNNING (SYSRQ)
crash> struct task_struct.pid ffff88018d4e8ae0
pid = 2187
crash> struct task_struct.cred ffff88018d4e8ae0
cred = 0xffff88014c2a8200
crash> struct cred.uid 0xffff88014c2a8200
uid = 0
crash> struct cred.gid 0xffff88014c2a8200
gid = 0
RHEL5:
o task_struct contains the PID, UID and GID of a process.
Eg:
crash> ps |grep java |tail n 10
32764 1 3 ffff8102d7a26080 UN 0.0 0 0 java
crash> struct task.pid,uid,gid ffff8102d7a26080
pid = 32764,
uid = 29109,
gid = 9804,
[Q:7] How to display parental hierarchy of a process?
The (p) option of "ps" command displays the parental hierarchy of selected, or all, tasks.
crash> ps p <PID>
Eg:
crash> ps p 2187](https://image.slidesharecdn.com/d2c53af2-eb6d-4e55-87be-19a5ef3df99e-160202112627/85/reference_guide_Kernel_Crash_Dump_Analysis-34-320.jpg)
![PID: 0 TASK: ffffffff81a8d020 CPU: 0 COMMAND: "swapper"
PID: 1 TASK: ffff880192d39500 CPU: 2 COMMAND: "init"
PID: 1865 TASK: ffff88014cf00040 CPU: 1 COMMAND: "sshd"
PID: 1877 TASK: ffff88018d606040 CPU: 2 COMMAND: "sshd"
PID: 2161 TASK: ffff8801420beaa0 CPU: 1 COMMAND: "bash"
PID: 2187 TASK: ffff88018d4e8ae0 CPU: 2 COMMAND: "bash"
[Q:8] How to display the child task of a process?
The (c) option of "ps" command displays the children of selected, or all, tasks.
crash> ps c <PID>
Eg:
crash> ps c 2187
PID: 2187 TASK: ffff88018d4e8ae0 CPU: 2 COMMAND: "bash"
(no children)
crash> ps c 2161
PID: 2161 TASK: ffff8801420beaa0 CPU: 1 COMMAND: "bash"
PID: 2187 TASK: ffff88018d4e8ae0 CPU: 2 COMMAND: "bash"
[Q:9] How to check list of open files by panic task?
"files" command displays the open files of the current context.
crash> files
Eg:
crash> files 2187
PID: 2187 TASK: ffff88018d4e8ae0 CPU: 2 COMMAND: "bash"
ROOT: / CWD: /root
FD FILE DENTRY INODE TYPE PATH
0 ffff880140ac6d40 ffff880141057500 ffff880141037d58 CHR /dev/pts/0
1 ffff880140ace3c0 ffff8801410738c0 ffff880141043078 REG /proc/sysrqtrigger
2 ffff880140ac6d40 ffff880141057500 ffff880141037d58 CHR /dev/pts/0
10 ffff880140ac6d40 ffff880141057500 ffff880141037d58 CHR /dev/pts/0
254 ffff88018cc71500 ffff8801434ef240 ffff88014104c4b8 REG /root/system_crash.sh
255 ffff880140ac6d40 ffff880141057500 ffff880141037d58 CHR /dev/pts/0](https://image.slidesharecdn.com/d2c53af2-eb6d-4e55-87be-19a5ef3df99e-160202112627/85/reference_guide_Kernel_Crash_Dump_Analysis-35-320.jpg)
![[Q:10] How to check task priority and policy ?
"task" command can used to determine the task priority and policy.
"task" command displays the contents of a task's task_struct and thread_info structures.
crash> task <PID>
Eg:
crash> set p
PID: 2187
COMMAND: "bash"
TASK: ffff88018d4e8ae0 [THREAD_INFO: ffff8801422bc000]
CPU: 2
STATE: TASK_RUNNING (SYSRQ)
crash> task 2187 R policy, prio, rt_priority
PID: 2187 TASK: ffff88018d4e8ae0 CPU: 2 COMMAND: "bash"
policy = 0, <<<{ SCHED_NORMAL }
prio = 120, <<<{ Priority is 120 }
rt_priority = 0,
/*
* Scheduling policies
*/
#define SCHED_NORMAL 0
#define SCHED_FIFO 1
#define SCHED_RR 2
#define SCHED_BATCH 3
/* SCHED_ISO: reserved but not implemented yet */
#define SCHED_IDLE 5
**OR**
crash> set p
PID: 2187
COMMAND: "bash"
TASK: ffff88018d4e8ae0 [THREAD_INFO: ffff8801422bc000]
CPU: 2
STATE: TASK_RUNNING (SYSRQ)](https://image.slidesharecdn.com/d2c53af2-eb6d-4e55-87be-19a5ef3df99e-160202112627/85/reference_guide_Kernel_Crash_Dump_Analysis-36-320.jpg)
![crash> task_struct.policy,prio,rt_priority 0xffff88018d4e8ae0
policy = 0
prio = 120
rt_priority = 0
[Q:11] How to check the the command line arguments and
environment strings of task ?
The option (a) of "ps" command displays the argument and environment data for the task.
crash> ps a <PID/taskname>
Eg:
crash> ps a automount
PID: 3948 TASK: f722ee30 CPU: 0 COMMAND: "automount"
ARG: /usr/sbin/automount timeout=60 /net program /etc/auto.net
ENV: SELINUX_INIT=YES
CONSOLE=/dev/console
TERM=linux
INIT_VERSION=sysvinit2.85
PATH=/sbin:/usr/sbin:/bin:/usr/bin
LC_MESSAGES=en_US
RUNLEVEL=3
runlevel=3
PWD=/
LANG=ja_JP.UTF8
PREVLEVEL=N
previous=N
HOME=/
SHLVL=2
_=/usr/sbin/automount
Note: This is information is only available if userspace contents are not filtered from kernel crash dump.
[Q:12] How to determine resource limits (rlimits) of a process?
The option (r) of "ps" command displays resource limits (rlimits) of selected, or all, tasks.](https://image.slidesharecdn.com/d2c53af2-eb6d-4e55-87be-19a5ef3df99e-160202112627/85/reference_guide_Kernel_Crash_Dump_Analysis-37-320.jpg)
![crash> ps r
Eg:
crash> set 1
PID: 1
COMMAND: "init"
TASK: ffff880192d39500 [THREAD_INFO: ffff880192d3a000]
CPU: 2
STATE: TASK_INTERRUPTIBLE
crash> ps r 1
PID: 1 TASK: ffff880192d39500 CPU: 2 COMMAND: "init"
RLIMIT CURRENT MAXIMUM
CPU (unlimited) (unlimited)
FSIZE (unlimited) (unlimited)
DATA (unlimited) (unlimited)
STACK 10485760 (unlimited)
CORE 0 (unlimited)
RSS (unlimited) (unlimited)
NPROC 45331 45331
NOFILE 1024 4096
MEMLOCK 65536 65536
AS (unlimited) (unlimited)
LOCKS (unlimited) (unlimited)
SIGPENDING 45331 45331
MSGQUEUE 819200 819200
NICE 0 0
RTPRIO 0 0
RTTIME (unlimited) (unlimited)
[Q:13] How to determine total number of tasks in different
state?
The option (S) of "ps" command displays a summary consisting of the number of tasks in a task state.
crash> ps S
Eg:
crash> ps S
RU: 5](https://image.slidesharecdn.com/d2c53af2-eb6d-4e55-87be-19a5ef3df99e-160202112627/85/reference_guide_Kernel_Crash_Dump_Analysis-38-320.jpg)
![IN: 259
[Q:14] How to display only user space process?
The option (u) of "ps" command displays only user tasks.
crash> ps u
Eg:
crash> ps u | head
PID PPID CPU TASK ST %MEM VSZ RSS COMM
1 0 2 ffff880192d39500 IN 0.0 19364 1500 init
483 1 1 ffff88018d76a040 IN 0.0 11240 1320 udevd
1336 1 3 ffff88014cf00aa0 IN 0.0 27640 864 auditd
1337 1 0 ffff88018e46f540 IN 0.0 27640 864 auditd
1361 1 0 ffff88018cde6080 IN 0.0 249092 1628 rsyslogd
1362 1 3 ffff880191be5540 IN 0.0 249092 1628 rs:main Q:Reg
1363 1 2 ffff88018d49c080 IN 0.0 249092 1628 rsyslogd
1364 1 3 ffff88018e796aa0 IN 0.0 249092 1628 rsyslogd
1396 1 2 ffff88018d4d4080 IN 0.0 18976 924 rpcbind
[Q:15] How to display only kernel threads?
The option (k) of "ps" command displays only kernel threads.
crash> ps k
Eg:
crash> ps k | head
PID PPID CPU TASK ST %MEM VSZ RSS COMM
> 0 0 0 ffffffff81a8d020 RU 0.0 0 0 [swapper]
> 0 0 1 ffff880192d81540 RU 0.0 0 0 [swapper]
0 0 2 ffff880192d8a040 RU 0.0 0 0 [swapper]
> 0 0 3 ffff880192dc2aa0 RU 0.0 0 0 [swapper]
2 0 1 ffff880192d38aa0 IN 0.0 0 0 [kthreadd]
3 2 0 ffff880192d38040 IN 0.0 0 0 [migration/0]
4 2 0 ffff880192d67540 IN 0.0 0 0 [ksoftirqd/0]
5 2 0 ffff880192d66ae0 IN 0.0 0 0 [migration/0]
6 2 0 ffff880192d66080 IN 0.0 0 0 [watchdog/0]](https://image.slidesharecdn.com/d2c53af2-eb6d-4e55-87be-19a5ef3df99e-160202112627/85/reference_guide_Kernel_Crash_Dump_Analysis-39-320.jpg)
![[Q:16] How to check the total time of a process in a specific
state?
The option (m) of "ps" command displays the timestamp into days, hours, minutes, seconds, and milliseconds
since the task was last run on a cpu.
crash> ps m
Eg:
crash> ps m | grep RU
[0 00:00:00.000] [RU] PID: 2187 TASK: ffff88018d4e8ae0 CPU: 2 COMMAND: "bash"
[0 00:02:01.177] [RU] PID: 0 TASK: ffffffff81a8d020 CPU: 0 COMMAND: "swapper"
[0 00:02:01.409] [RU] PID: 0 TASK: ffff880192d81540 CPU: 1 COMMAND: "swapper"
[0 00:02:01.408] [RU] PID: 0 TASK: ffff880192d8a040 CPU: 2 COMMAND: "swapper"
[0 00:02:01.408] [RU] PID: 0 TASK: ffff880192dc2aa0 CPU: 3 COMMAND: "swapper"
[Q:17] How to check run queue of each CPU?
"runq" command displays the tasks on a CFS run queue:
crash> runq
Eg:
crash> runq
CPU 0 RUNQUEUE: ffff880028216840
CURRENT: PID: 0 TASK: ffffffff81a8d020 COMMAND: "swapper"
RT PRIO_ARRAY: ffff8800282169c8
[no tasks queued]
CFS RB_ROOT: ffff8800282168d8
[no tasks queued]
CPU 1 RUNQUEUE: ffff880028256840
CURRENT: PID: 0 TASK: ffff880192d81540 COMMAND: "swapper"
RT PRIO_ARRAY: ffff8800282569c8
[no tasks queued]
CFS RB_ROOT: ffff8800282568d8
[no tasks queued]](https://image.slidesharecdn.com/d2c53af2-eb6d-4e55-87be-19a5ef3df99e-160202112627/85/reference_guide_Kernel_Crash_Dump_Analysis-40-320.jpg)
![CPU 2 RUNQUEUE: ffff880028296840
CURRENT: PID: 2187 TASK: ffff88018d4e8ae0 COMMAND: "bash"
RT PRIO_ARRAY: ffff8800282969c8
[no tasks queued]
CFS RB_ROOT: ffff8800282968d8
[no tasks queued]
CPU 3 RUNQUEUE: ffff8800282d6840
CURRENT: PID: 0 TASK: ffff880192dc2aa0 COMMAND: "swapper"
RT PRIO_ARRAY: ffff8800282d69c8
[no tasks queued]
CFS RB_ROOT: ffff8800282d68d8
[no tasks queued]
[Q:18] How to determine the values of sysctl parameter from
vmcore?
o Check the ".data" filed of desired sysctl parameter in sysctl.c file.
Eg:
https://access.redhat.com/labs/psb/versions/kernel2.6.32431.el6/kernel/sysctl.c
{
.ctl_name = VM_SWAPPINESS,
.procname = "swappiness",
.data = &vm_swappiness, <<<
.maxlen = sizeof(vm_swappiness),
.mode = 0644,
.proc_handler = &proc_dointvec_minmax,
.strategy = &sysctl_intvec,
.extra1 = &zero,
.extra2 = &one_hundred,
},
crash> vm_swappiness
vm_swappiness = $1 = 60](https://image.slidesharecdn.com/d2c53af2-eb6d-4e55-87be-19a5ef3df99e-160202112627/85/reference_guide_Kernel_Crash_Dump_Analysis-41-320.jpg)
![{
.ctl_name = VM_PANIC_ON_OOM,
.procname = "panic_on_oom",
.data = &sysctl_panic_on_oom, <<<
.maxlen = sizeof(sysctl_panic_on_oom),
.mode = 0644,
.proc_handler = &proc_dointvec,
},
crash> sysctl_panic_on_oom
sysctl_panic_on_oom = $2 = 1
Memory Subsystem
[Q:1] How to check overall memory usage on the system?
"kmem i" command displays general memory usage information:
crash> kmem i
Eg:
crash> kmem i
PAGES TOTAL PERCENTAGE
TOTAL MEM 1205838 4.6 GB
FREE 1102506 4.2 GB 91% of TOTAL MEM
USED 103332 403.6 MB 8% of TOTAL MEM
SHARED 14484 56.6 MB 1% of TOTAL MEM
BUFFERS 6377 24.9 MB 0% of TOTAL MEM
CACHED 39960 156.1 MB 3% of TOTAL MEM
SLAB 17725 69.2 MB 1% of TOTAL MEM
TOTAL SWAP 16382 64 MB
SWAP USED 0 0 0% of TOTAL SWAP
SWAP FREE 16382 64 MB 100% of TOTAL SWAP
COMMIT LIMIT 616741 2.4 GB
COMMITTED 59755 233.4 MB 9% of TOTAL LIMIT](https://image.slidesharecdn.com/d2c53af2-eb6d-4e55-87be-19a5ef3df99e-160202112627/85/reference_guide_Kernel_Crash_Dump_Analysis-42-320.jpg)
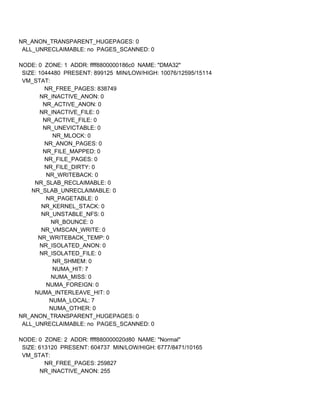
![[Q:2] How to check perzone memory statistics?
"kmem z" command displays perzone memory statistics.
crash> kmem z
Eg:
crash> kmem z
NODE: 0 ZONE: 0 ADDR: ffff880000010000 NAME: "DMA"
SIZE: 4095 PRESENT: 3831 MIN/LOW/HIGH: 42/52/63
VM_STAT:
NR_FREE_PAGES: 3930
NR_INACTIVE_ANON: 0
NR_ACTIVE_ANON: 0
NR_INACTIVE_FILE: 0
NR_ACTIVE_FILE: 0
NR_UNEVICTABLE: 0
NR_MLOCK: 0
NR_ANON_PAGES: 0
NR_FILE_MAPPED: 0
NR_FILE_PAGES: 0
NR_FILE_DIRTY: 0
NR_WRITEBACK: 0
NR_SLAB_RECLAIMABLE: 0
NR_SLAB_UNRECLAIMABLE: 0
NR_PAGETABLE: 0
NR_KERNEL_STACK: 0
NR_UNSTABLE_NFS: 0
NR_BOUNCE: 0
NR_VMSCAN_WRITE: 0
NR_WRITEBACK_TEMP: 0
NR_ISOLATED_ANON: 0
NR_ISOLATED_FILE: 0
NR_SHMEM: 0
NUMA_HIT: 0
NUMA_MISS: 0
NUMA_FOREIGN: 0
NUMA_INTERLEAVE_HIT: 0
NUMA_LOCAL: 0
NUMA_OTHER: 0](https://image.slidesharecdn.com/d2c53af2-eb6d-4e55-87be-19a5ef3df99e-160202112627/85/reference_guide_Kernel_Crash_Dump_Analysis-43-320.jpg)
![NR_ACTIVE_ANON: 14241
NR_INACTIVE_FILE: 37893
NR_ACTIVE_FILE: 8129
NR_UNEVICTABLE: 0
NR_MLOCK: 0
NR_ANON_PAGES: 12659
NR_FILE_MAPPED: 7778
NR_FILE_PAGES: 46337
NR_FILE_DIRTY: 10
NR_WRITEBACK: 0
NR_SLAB_RECLAIMABLE: 4164
NR_SLAB_UNRECLAIMABLE: 13561
NR_PAGETABLE: 2539
NR_KERNEL_STACK: 263
NR_UNSTABLE_NFS: 0
NR_BOUNCE: 0
NR_VMSCAN_WRITE: 0
NR_WRITEBACK_TEMP: 0
NR_ISOLATED_ANON: 0
NR_ISOLATED_FILE: 0
NR_SHMEM: 306
NUMA_HIT: 642460
NUMA_MISS: 0
NUMA_FOREIGN: 0
NUMA_INTERLEAVE_HIT: 20243
NUMA_LOCAL: 642460
NUMA_OTHER: 0
NR_ANON_TRANSPARENT_HUGEPAGES: 3
ALL_UNRECLAIMABLE: no PAGES_SCANNED: 0
NODE: 0 ZONE: 3 ADDR: ffff880000029440 NAME: "Movable"
[unpopulated]
[Q:3] How to determine memory usage in userspace?
crash> kmem i
PAGES TOTAL PERCENTAGE
TOTAL MEM 8220191 31.4 GB
FREE 50006 195.3 MB 0% of TOTAL MEM
USED 8170185 31.2 GB 99% of TOTAL MEM
SHARED 3789 14.8 MB 0% of TOTAL MEM](https://image.slidesharecdn.com/d2c53af2-eb6d-4e55-87be-19a5ef3df99e-160202112627/85/reference_guide_Kernel_Crash_Dump_Analysis-45-320.jpg)
![BUFFERS 139 556 KB 0% of TOTAL MEM
CACHED 986 3.9 MB 0% of TOTAL MEM
SLAB 13678 53.4 MB 0% of TOTAL MEM
TOTAL SWAP 8372223 31.9 GB
SWAP USED 8372223 31.9 GB 100% of TOTAL SWAP
SWAP FREE 0 0 0% of TOTAL SWAP
COMMIT LIMIT 12482318 47.6 GB
COMMITTED 16281979 62.1 GB 130% of TOTAL LIMIT
The "ps Gu" command can be used to determine the RSS of userspace tasks.
Eg:
crash> ps u G | sed 's/>//g' | awk '{ total += $8 } END { printf "Total RSS of usermode: %.02f GiBn", total/2^20
}'
Total RSS of usermode: 30.74 GiB
Per process memory usage:
crash> ps G | sort k 8,8 n r | head
PID PPID CPU TASK ST %MEM VSZ RSS COMM
> 28882 20109 1 ffff880831e0e040 RU 92.8 65272428 32120772 rsession
> 6985 6984 2 ffff88082e934040 RU 0.0 641664 4680 coda
> 6392 1 3 ffff88082e934ab0 RU 0.0 167336 6324 perfd
6123 1 2 ffff88082c194ab0 IN 0.1 238480 45732 splunkd
6946 6945 1 ffff88082f804ab0 RU 0.0 833744 9188 opcmona
27387 1 0 ffff88082d288040 RU 0.0 129952 6472 bgsagent
6275 1 0 ffff88082f7eaab0 UN 0.0 36284 5184 scopeux
2098 2097 3 ffff88082dbe7520 IN 0.0 1454328 5172 python
6981 6980 1 ffff880831017520 RU 0.0 903548 3236 opcmsga
2151 1 3 ffff88082daed520 IN 0.0 706320 2748 EracentEUAServi
Specific process's memory usage:
crash> ps Gu rsession | tail n +2 | cut b2 | gawk '{mem += $8} END {print "total " mem/1048576 " GB"}'
total 30.6334 GB
[Q:4] How to determine swap memory usage of each task?
o Load crash extension (swap_usage.so)](https://image.slidesharecdn.com/d2c53af2-eb6d-4e55-87be-19a5ef3df99e-160202112627/85/reference_guide_Kernel_Crash_Dump_Analysis-46-320.jpg)
![Eg:
crash> extend swap_usage.so
./swap_usage.so: shared object loaded
o Use "pswap" command to check swap usage per task.
Eg:
crash> pswap G | sort n k 2 |tail
6946 3099 opcmona
6964 3334 agtrep
30548 9362 R
30575 9377 R
30566 9378 R
30557 9427 R
6123 14284 splunkd
2098 18739 python
19406 164229 rsession
28882 8107112 rsession
[Q:5] How to determine memory usage in kernelspace?
crash> kmem i
PAGES TOTAL PERCENTAGE
TOTAL MEM 4051286 15.5 GB
FREE 33838 132.2 MB 0% of TOTAL MEM
USED 4017448 15.3 GB 99% of TOTAL MEM
SHARED 957 3.7 MB 0% of TOTAL MEM
BUFFERS 58 232 KB 0% of TOTAL MEM
CACHED 900 3.5 MB 0% of TOTAL MEM
SLAB 3954789 15.1 GB 97% of TOTAL MEM
TOTAL SWAP 4194303 16 GB
SWAP USED 249162 973.3 MB 5% of TOTAL SWAP
SWAP FREE 3945141 15 GB 94% of TOTAL SWAP
COMMIT LIMIT 6219946 23.7 GB
COMMITTED 4054963 15.5 GB 65% of TOTAL LIMIT
"kmem s" command displays basic kmalloc() slab data.](https://image.slidesharecdn.com/d2c53af2-eb6d-4e55-87be-19a5ef3df99e-160202112627/85/reference_guide_Kernel_Crash_Dump_Analysis-47-320.jpg)
![crash> kmem s
Eg:
crash> kmem s | grep e NAME e anon_vma_chain
CACHE NAME OBJSIZE ALLOCATED TOTAL SLABS SSIZE
ffff88043bf20b00 anon_vma_chain 48 302042720 302042818 3922634 4k
Formula: (OBJSIZE * ALLOCATED)/2^30
crash> !bc q
scale =2
(48*302042720)/2^30
13.50
^
'....
o Memory allocated to "anon_vma_chain" slab object is ~13.50 GiB.
[Q:6] How to check memory allocated for hugepages?
RHEL6:
"kmem h" command displays the address of hugepage hstate array entries, along with their hugepage size,
total and free counts, and name.
crash> kmem h
Eg:
crash> kmem h
HSTATE SIZE FREE TOTAL NAME
ffffffff81fbb8c0 2MB 10 10 hugepages2048kB
RHEL5:
a) Total Number of Huge pages.
crash> p d nr_huge_pages
nr_huge_pages = $1 = 35845
crash> p d nr_huge_pages*(1<<21)
$2 = 75172413440](https://image.slidesharecdn.com/d2c53af2-eb6d-4e55-87be-19a5ef3df99e-160202112627/85/reference_guide_Kernel_Crash_Dump_Analysis-48-320.jpg)
![crash> !bc q
scale=2
75172413440/2^30
70.00
b) The number of huge pages in the pool that are not yet allocated.
crash> p d free_huge_pages
free_huge_pages = $2 = 0
[Q:7] How to check memory allocated to VMware ballooning
driver (RHEL 6+)?
o Determine the address of symbol balloon.
Eg:
crash> sym balloon
ffffffffa002b600 (b) balloon [vmware_balloon]
o Determine the value of "size" variable using the address of symbol balloon.
Eg:
crash> struct vmballoon.size 0xffffffffa002b600
$4 = 2721049 <<<{ Amount of memory allocated in pages }
crash> !bc q
scale=2
2721049*4/2^20
10.37 <<<{ Amount of memory allocated in GiB }
OR
2721049 pages = 2721049 x 4 = 10884196 KiB = 10.37 GiB
Note: The value of size variable is the amount of memory allocated by VMware Ballooning driver in pages.
o Determine the value of "target" variable using the address of symbol balloon.
Eg:](https://image.slidesharecdn.com/d2c53af2-eb6d-4e55-87be-19a5ef3df99e-160202112627/85/reference_guide_Kernel_Crash_Dump_Analysis-49-320.jpg)
![crash> vmballoon.target 0xffffffffa002b600
$5 = 3177311 <<<{ Amount of memory needed in pages }
crash> !bc q
scale=2
3177311*4/2^20
12.12 <<<{ Amount of memory needed in GiB }
OR
3177311 pages = 3177311 x 4 = 12709244 KiB = 12.12 GiB
Note: The value of target variable is the amount of memory needed by VMware Ballooning driver in pages.
[Q:8] How to displays information for each configured swap
device?
"swap" command displays information for each configured swap device.
crash> swap
Eg:
crash> swap
SWAP_INFO_STRUCT TYPE SIZE USED PCT PRI FILENAME
ffff88014be681c0 FILE 65528k 0k 0% 1 /swapfile
Storage Subsystem
[Q:1] How to display disk I/O statistics?
"dev d" command displays disk I/O statistics:
crash> dev d
Eg:](https://image.slidesharecdn.com/d2c53af2-eb6d-4e55-87be-19a5ef3df99e-160202112627/85/reference_guide_Kernel_Crash_Dump_Analysis-50-320.jpg)
![crash> dev d
MAJOR GENDISK NAME REQUEST_QUEUE TOTAL ASYNC SYNC DRV
8 ffff88404ee6b400 sda ffff88204c212338 0 0 0 0
253 ffff88404eedac00 dm0 ffff88404bf60b68 0 0 0 0
253 ffff88404eedc800 dm1 ffff88404bf60038 0 0 0 0
253 ffff8820508c3c00 dm2 ffff882050444ea8 0 0 0 0
253 ffff88204be1f800 dm3 ffff882050444378 0 0 0 0
253 ffff88204dda4800 dm4 ffff882050458ee8 0 0 0 0
TOTAL: total number of allocated inprogress I/O requests
SYNC: I/O requests that are synchronous
ASYNC: I/O requests that are asynchronous
READ: I/O requests that are reads (older kernels)
WRITE: I/O requests that are writes (older kernels)
DRV: I/O requests that are inflight in the device driver
[Q:2] How to check the status of disks ( online/offline )?
Method: 1
*********
o Determine struct gendisk * using "dev d" command.
Eg:
crash> dev d
MAJOR GENDISK NAME REQUEST_QUEUE TOTAL ASYNC SYNC DRV
8 ffff88404ee6b400 sda ffff88204c212338 0 0 0 0
^
'....
struct gendisk * for /dev/sda is 0xffff88404ee6b400
o Determine "private_data" from struct gendisk *
Eg:
crash> gendisk.private_data ox
struct gendisk {
[0x2c8] void *private_data;
}
crash> gendisk.private_data ffff88404ee6b400
private_data = 0xffff88404ee6b000](https://image.slidesharecdn.com/d2c53af2-eb6d-4e55-87be-19a5ef3df99e-160202112627/85/reference_guide_Kernel_Crash_Dump_Analysis-51-320.jpg)
![o Determine struct scsi_device * from struct scsi_disk *
Eg:
crash> scsi_disk.device ox
struct scsi_disk {
[0x8] struct scsi_device *device;
}
crash> scsi_disk.device 0xffff88404ee6b000
device = 0xffff88204c090800
o Determine sdev_state from struct scsi_device *
Eg:
crash> scsi_device.sdev_state ox
struct scsi_device {
[0x5a0] enum scsi_device_state sdev_state;
}
crash> scsi_device.sdev_state 0xffff88204c090800
sdev_state = SDEV_RUNNING
The sdev state are defined in include/scsi/scsi_device.h file.
.....
/*
* sdev state: If you alter this, you also need to alter scsi_sysfs.c
* (for the ascii descriptions) and the state model enforcer:
* scsi_lib:scsi_device_set_state().
*/
enum scsi_device_state {
SDEV_CREATED = 1, /* device created but not added to sysfs
* Only internal commands allowed (for inq) */
SDEV_RUNNING, /* device properly configured
* All commands allowed */
SDEV_CANCEL, /* beginning to delete device
* Only error handler commands allowed */
SDEV_DEL, /* device deleted
* no commands allowed */
SDEV_QUIESCE, /* Device quiescent. No block commands
* will be accepted, only specials (which
* originate in the midlayer) */](https://image.slidesharecdn.com/d2c53af2-eb6d-4e55-87be-19a5ef3df99e-160202112627/85/reference_guide_Kernel_Crash_Dump_Analysis-52-320.jpg)
![SDEV_OFFLINE, /* Device offlined (by error handling or
* user request */
SDEV_BLOCK, /* Device blocked by scsi lld. No
* scsi commands from user or midlayer
* should be issued to the scsi
* lld. */
SDEV_CREATED_BLOCK, /* same as above but for created devices */
};
.....
Method: 2
*********
o Determine struct request_queue * using "dev d" command.
Eg:
crash> dev d
MAJOR GENDISK NAME REQUEST_QUEUE TOTAL ASYNC SYNC DRV
8 ffff88404ee6b400 sda ffff88204c212338 0 0 0 0
^
'....
struct request_queue * for /dev/sda is 0xffff88204c212338
o Determine "queuedata" from struct request_queue *
Eg:
crash> request_queue.queuedata ox
struct request_queue {
[0x300] void *queuedata;
}
crash> request_queue.queuedata ffff88204c212338
queuedata = 0xffff88204c090800
o Determine sdev_state from struct scsi_device *
crash> scsi_device.sdev_state ox
struct scsi_device {
[0x5a0] enum scsi_device_state sdev_state;
}
crash> scsi_device.sdev_state 0xffff88204c090800
sdev_state = SDEV_RUNNING](https://image.slidesharecdn.com/d2c53af2-eb6d-4e55-87be-19a5ef3df99e-160202112627/85/reference_guide_Kernel_Crash_Dump_Analysis-53-320.jpg)
![[Q:3] How to determine the default I/O scheduler set?
o Search keyword "scheduler" in kernel ring buffer.
crash> log | grep scheduler
io scheduler noop registered
io scheduler anticipatory registered
io scheduler deadline registered
io scheduler cfq registered (default)
o Check the line which ends with "(default)".
[Q:4] How to determine the I/O scheduler set on a specific
disk?
o Determine the struct request_queue * from "dev d" command output.
Eg:
crash> dev d
MAJOR GENDISK NAME REQUEST_QUEUE TOTAL ASYNC SYNC DRV
252 ffff88018cc1ec00 vda ffff88018c460e68 0 0 0 0
struct request_queue * for /dev/sda is 0xffff88204c212338
o Determine struct elevator_queue * from struct request_queue *
Eg:
crash> request_queue.elevator ox
struct request_queue {
[0x18] struct elevator_queue *elevator;
}
crash> request_queue.elevator ffff88018c460e68
elevator = 0xffff88018d4b1e40
o Determine struct elevator_type * from struct elevator_queue *](https://image.slidesharecdn.com/d2c53af2-eb6d-4e55-87be-19a5ef3df99e-160202112627/85/reference_guide_Kernel_Crash_Dump_Analysis-54-320.jpg)
![Eg:
crash> elevator_queue.elevator_type ox
struct elevator_queue {
[0x50] struct elevator_type *elevator_type;
}
crash> elevator_queue.elevator_type 0xffff88018d4b1e40
elevator_type = 0xffffffff81af24e0 <iosched_cfq>
o Determine elevator_name[16] from struct elevator_type *
Eg:
crash> elevator_type.elevator_name ox
struct elevator_type {
[0xb0] char elevator_name[16];
}
crash> elevator_type.elevator_name 0xffffffff81af24e0
elevator_name = "cfq000000000000000000000000000000000000"
Network Subsystem
[Q:1] How to display the system's network device list?
"net" command is displays the system's network device list.
crash> net
NET_DEVICE NAME IP ADDRESS(ES)
ffff8801924bd020 lo 127.0.0.1
ffff88018cda7020 eth0 192.168.122.189
[Q:2] How to display ARP cache?
"net a" command dump the ARP cache.](https://image.slidesharecdn.com/d2c53af2-eb6d-4e55-87be-19a5ef3df99e-160202112627/85/reference_guide_Kernel_Crash_Dump_Analysis-55-320.jpg)
![crash> net a
NEIGHBOUR IP ADDRESS HW TYPE HW ADDRESS DEVICE STATE
ffff88018ccf2080 192.168.122.1 ETHER 52:54:00:1a:b1:81 eth0 REACHABLE
ffff88018ccf2e80 0.0.0.0 UNKNOWN 00 00 00 00 00 00 lo NOARP
pykdump
[Q:1] What is pykdump (not supported by Red Hat Support)?
o pykdump is a python framework to access Linux dumps programmatically from "crash".
o pykdump can be downloaded from http://sourceforge.net/projects/pykdump/
o Filename: mpykdump0.8.2x86_64.tar.gz
o It provide two files:
$ tar xvf mpykdump0.8.2x86_64.tar.gz
README
usr/local/lib/mpykdump64.so
usr/local/bin/crash64
[Q:2] How to use pykdump?
o Load crash extension mpykdump64.so.
Eg:
crash> extend /usr/local/lib/mpykdump64.so
Setting scroll off while initializing PyKdump
/usr/local/lib/mpykdump64.so: shared object loaded
o crash extension mpykdump64.so provides two very useful commands.
o crashinfo
o xportshow](https://image.slidesharecdn.com/d2c53af2-eb6d-4e55-87be-19a5ef3df99e-160202112627/85/reference_guide_Kernel_Crash_Dump_Analysis-56-320.jpg)
![[ crashinfo ]
o crashinfo is a tool for gathering information directly on customer's host and to do some simple automated
firstpass analysis. Especially is it useful for hangs or performance problems.
How to perform a initial analysis of kernel crash dump automatically ?
Eg:
crash> crashinfo
crash> crashinfo v
crash> crashinfo fast
By default, when crashinfo is invoked without any options, it prints some vital statistics and runs a number of
tests. As a result of running these tests, it can print WARNING messages. These messages are usually (but not
always) followed by more details.
How to print sysctl Information using crashinfo command ?
Eg:
crash> crashinfo sysctl | head
abi.vsyscall32 1
crypto.fips_enabled 0
debug.exceptiontrace 1
debug.kprobesoptimization 0
dev.hpet.maxuserfreq 64
dev.mac_hid.mouse_button2_keycode 97
dev.mac_hid.mouse_button3_keycode 100
dev.mac_hid.mouse_button_emulation 0
dev.raid.speed_limit_max 200000
dev.raid.speed_limit_min 1000
[ xportshow ]
o xportshow is a tool to extract and print the networking transport related information from Linux kernel dumps.
How to print Interface Information using xportshow command ?
Eg:
crash> xportshow i
====================== lo <struct net_device 0xffff881028cb5020> ============
lo 127.0.0.1/8 mtu=65536 LOOPBACK
inet6 addr: ::1/128
flags=<IFF_UP|IFF_LOOPBACK>](https://image.slidesharecdn.com/d2c53af2-eb6d-4e55-87be-19a5ef3df99e-160202112627/85/reference_guide_Kernel_Crash_Dump_Analysis-57-320.jpg)


More Related Content
What's hot (20)
Viewers also liked (20)


Similar to reference_guide_Kernel_Crash_Dump_Analysis (20)
![[Question Paper] Linux Administration (75:25 Pattern) [April / 2015]](https://cdn.slidesharecdn.com/ss_thumbnails/linux-qp-75-25-april-2015-170831130550-thumbnail.jpg?width=560&fit=bounds)
![Linux Administration (Revised Syllabus) [QP / May - 2016]](https://cdn.slidesharecdn.com/ss_thumbnails/linux-qp-rs-may-2016-171002235536-thumbnail.jpg?width=560&fit=bounds)


![[Question Paper] Linux Administration (75:25 Pattern) [November / 2014]](https://cdn.slidesharecdn.com/ss_thumbnails/linux-qp-75-25-november-2014-170831130552-thumbnail.jpg?width=560&fit=bounds)

![Linux Administration (November - 2017) [75:25 Pattern | Question Paper]](https://cdn.slidesharecdn.com/ss_thumbnails/75-25-linux-nov-2017-qp-180624203010-thumbnail.jpg?width=560&fit=bounds)
![[Question Paper] Embedded System (Revised Course) [June / 2016]](https://cdn.slidesharecdn.com/ss_thumbnails/es-qp-revised-course-june-2016-170802133647-thumbnail.jpg?width=560&fit=bounds)


reference_guide_Kernel_Crash_Dump_Analysis
- 1. Kernel Crash Dump Analysis PREPARED BY : Buland Singh, Red Hat REVIEW BY : Jijesh Kalliyat, Red Hat Version 1.0 Jan 2016 Send feedback to [email protected]
- 12. sshkey <path> o Used to specify the path of the ssh key you want to use when do ssh dump, the default value is /root/.ssh/kdump_id_rsa o kdump will use the sshkey to do ssh dump. Eg: sshkey /root/.ssh/kdump_id_rsa path <path> o "path" represents the filesystem path in which vmcore will be saved. o If a dump target is specified in kdump.conf, then "path" is relative to the specified dump target. o Interpretation of path changes a bit if user has not specified a dump target explicitly in kdump.conf. In this case, "path" represents the absolute path from root. And dump target and adjusted path are arrived at automatically depending on what's mounted in the current system. o Ignored for raw device dumps. o If unset, will default to /var/crash. Eg: path /var/crash core_collector <command> <options> o This allows you to specify the command to copy the vmcore. o Default core_collector for other targets is: "makedumpfile c messagelevel 1 d 31" Eg: core_collector makedumpfile c messagelevel 1 d 31 o The c tells makedumpfile command to compress the vmcore file. o The "d" option is used to set the dump_level. o "dump_level" is used to decide which pages to be removed from the resultant vmcore file. o The option is a bit mask, having each page type specified like so: zero pages = 1 cache pages = 2 cache private = 4 user pages = 8 free pages = 16
- 14. default <reboot | halt | poweroff | shell | dump_to_rootfs> o Used to set action to preform in case dumping to intended target fails. o If no default action is specified, "reboot" is assumed default. reboot: If the default action is reboot simply reboot the system and loose the core that you are trying to retrieve. halt: If the default action is halt, then simply halt the system after attempting to capture a vmcore, regardless of success or failure. poweroff: The system will be powered down shell: If the default action is shell, then drop to an shell session inside the initramfs from where you can try to record the core manually. Exiting this shell reboots the system. Note: kdump uses bash as the default shell. dump_to_rootfs: If nonroot dump target is specified, the default action can be set as dump_to_rootfs. That means when dump to target fails, dump vmcore to rootfs from initramfs context and reboot. Eg: default shell force_rebuild <0 | 1> o By default, kdump initrd will only be rebuilt when necessary. o Specify 1 to force rebuilding kdump initrd every time when kdump service starts. Eg: force_rebuild 1 dracut_args <arg(s)> o Used to pass extra dracut options when rebuilding kdump initrd. Eg: dracut_args omitdrivers "cfg80211 snd" adddrivers "ext2 ext3" fence_kdump_args <arg(s)> o Command line arguments for fence_kdump_send (it can contain all valid arguments except hosts to send
- 15. notification to). Eg: fence_kdump_args p 7410 f auto c 0 i 10 fence_kdump_nodes <node(s)> o List of cluster node(s) separated by space to send fence_kdump notification to (this option is mandatory to enable fence_kdump). Eg: fence_kdump_nodes node1 node2 [Q:4] How to configure kdump service? a) Set kernel boot parameter "crashkernel" to reserve memory for crash/kdump kernel. Three different formats for "crashkernel" parameter. o crashkernel=auto { Automatically calculates memory for crash kernel } o crashkernel=128M { Reserves 128M of memory for crash kernel } o crashkernel=512M2G:64M,2G:128M { This would mean: } 1) if the RAM is smaller than 512M, then don't reserve anything (this is the "rescue" case) 2) if the RAM size is between 512M and 2G (exclusive), then reserve 64M 3) if the RAM size is larger than 2G, then reserve 128M. The size of "crashkernel" parameter depends on; o Machine Architecture. o Total amount of installed system memory. o [ 128 MB + 4 bits for every 4KB page ] i386 and x86_64 : 64M for small machines (about 2 GiB of RAM, 4 cores) and 128M for larger machines. PPC64 : 128M for small machines and 256M for larger machines. IA64 : 256M for small machines, 512M for medium machines and 1G and more for large machines. b) Reboot the system. c) Verify the memory reserved for crash/kdump kernel. o Check /proc/cmdline to confirm system is booted with "crashkernel" parameter.
- 26. o By default /dev/crash will be used if it exists. o If it does not exist, then /dev/mem will be used. [**crash invocation methods (offline/online)**] a) Typical postmortem debugging: [ offline ] Syntax: # crash /path/to/vmlinux /path/to/vmcore o Kernel object file and memory image are supplied, respectively. Eg: # crash osrelease vmcore 2.6.32431.el6.x86_64 # crash d 1 vmcore| grep RELEASE OSRELEASE=2.6.32431.el6.x86_64 # strings vmcore| head n 5 KDUMP Linux bsingh.kernel.org 2.6.32431.el6.x86_64 #1 SMP Sun Nov 10 22:19:54 EST 2013 # crash /var/crash/vmcore /usr/lib/debug/lib/modules/2.6.32431.el6.x86_64/vmlinux b) Live memory debugging: [ online ] # crash vmlinux o /proc/kcore used by default for live memory image. c) Live memory debugging (with vmlinux search): # crash o Predefined directories are searched for proper vmlinux o Version string matched to the running kernel (/proc/version)
- 38. crash> ps r Eg: crash> set 1 PID: 1 COMMAND: "init" TASK: ffff880192d39500 [THREAD_INFO: ffff880192d3a000] CPU: 2 STATE: TASK_INTERRUPTIBLE crash> ps r 1 PID: 1 TASK: ffff880192d39500 CPU: 2 COMMAND: "init" RLIMIT CURRENT MAXIMUM CPU (unlimited) (unlimited) FSIZE (unlimited) (unlimited) DATA (unlimited) (unlimited) STACK 10485760 (unlimited) CORE 0 (unlimited) RSS (unlimited) (unlimited) NPROC 45331 45331 NOFILE 1024 4096 MEMLOCK 65536 65536 AS (unlimited) (unlimited) LOCKS (unlimited) (unlimited) SIGPENDING 45331 45331 MSGQUEUE 819200 819200 NICE 0 0 RTPRIO 0 0 RTTIME (unlimited) (unlimited) [Q:13] How to determine total number of tasks in different state? The option (S) of "ps" command displays a summary consisting of the number of tasks in a task state. crash> ps S Eg: crash> ps S RU: 5
- 47. Eg: crash> extend swap_usage.so ./swap_usage.so: shared object loaded o Use "pswap" command to check swap usage per task. Eg: crash> pswap G | sort n k 2 |tail 6946 3099 opcmona 6964 3334 agtrep 30548 9362 R 30575 9377 R 30566 9378 R 30557 9427 R 6123 14284 splunkd 2098 18739 python 19406 164229 rsession 28882 8107112 rsession [Q:5] How to determine memory usage in kernelspace? crash> kmem i PAGES TOTAL PERCENTAGE TOTAL MEM 4051286 15.5 GB FREE 33838 132.2 MB 0% of TOTAL MEM USED 4017448 15.3 GB 99% of TOTAL MEM SHARED 957 3.7 MB 0% of TOTAL MEM BUFFERS 58 232 KB 0% of TOTAL MEM CACHED 900 3.5 MB 0% of TOTAL MEM SLAB 3954789 15.1 GB 97% of TOTAL MEM TOTAL SWAP 4194303 16 GB SWAP USED 249162 973.3 MB 5% of TOTAL SWAP SWAP FREE 3945141 15 GB 94% of TOTAL SWAP COMMIT LIMIT 6219946 23.7 GB COMMITTED 4054963 15.5 GB 65% of TOTAL LIMIT "kmem s" command displays basic kmalloc() slab data.
- 49. crash> !bc q scale=2 75172413440/2^30 70.00 b) The number of huge pages in the pool that are not yet allocated. crash> p d free_huge_pages free_huge_pages = $2 = 0 [Q:7] How to check memory allocated to VMware ballooning driver (RHEL 6+)? o Determine the address of symbol balloon. Eg: crash> sym balloon ffffffffa002b600 (b) balloon [vmware_balloon] o Determine the value of "size" variable using the address of symbol balloon. Eg: crash> struct vmballoon.size 0xffffffffa002b600 $4 = 2721049 <<<{ Amount of memory allocated in pages } crash> !bc q scale=2 2721049*4/2^20 10.37 <<<{ Amount of memory allocated in GiB } OR 2721049 pages = 2721049 x 4 = 10884196 KiB = 10.37 GiB Note: The value of size variable is the amount of memory allocated by VMware Ballooning driver in pages. o Determine the value of "target" variable using the address of symbol balloon. Eg: