SlideShare a Scribd company logo
Reimagining Data as a Service for
Enterprise
Acquisition Retention Trending Marketing Performance
Average CPA
$62
180 Day Persistency
72%
Retention
92%
% of Budget
26.2%
Net Membership
151,015
Total Spend
$395,015
Cancellations
22%
Ad Cost Performance
Net Memberships
Ad Cost Performance
Swim Lane Performance
Organic
Paid Spend
Lead Gen
Sales
Group
Other
Total
Total Ads
Cost
Daily Net Memberships
New Members
New Leads
New Members
New Members
New Members
Net Members
Net Members
Net Members
Net Members
Net Members
Net Members
Retention
Retention
Retention
Retention
Retention
Attrition
Attrition
Attrition
Attrition
Attrition
Attrition Retention Net Members
1,980
6,151
4,180
3,978
852
17,141
47,132
325
1,250
5,151
21,155
19,251
$369
6.5:1
$82
CPA Budget Spend to Date
$32,151 $12,515
$25 $91,150 $52,981
$55 $40,981 $11,901
$124 $7,915 $3500
$159 $18,910 $10,015
$85.1 $191,107 $90,912
Cancelled
Members
Retention
Attrition
Cancelled
Members
Retention
Attrition
Cancelled
Members
Saved
Members
Retention
Attrition Retention
Attrition Retention
Attrition Retention
563
132
654
422
10.2%
Cancelled
Members
696
Cancelled
Members
2,561
Total
Cancelled
51
Saved
Members
94
Saved
Members
22
73
Saved
Members
94
Saved
Members
251
Total Saved
9.8%
5.2%
6.4%
9.8%
12.5%
89.8%
92.1%
95.8%
92.6%
90.2%
87.5%
Paid Spend
40%
Lead
Generation
20%
Organic
40%
CPA ROAS
Budget
12% 33% 42% 51% 72%
71% 78% 82% 83% 83%
189 Days
253 Days
210 Days
320 Days
Target 200 Days
Paid Spend Lead Generation
Sales Groups Organic
TCV:CPA Ratio Trend Average TCV
23.4% 6.3%
Existing
Memberships
New
Members
Returning
Memberships
Renewals
Call to
Cancel
Auto Cancel
Welcome to
Data as a Service 2.0
Teams are desperate for a clearer idea of
how to strategically adopt generative AI to
tame big data, infuse human behavior
into those big data sets, and properly
disseminate the top insights to all teams.
It’s this need that has reshaped what
Data as a Service looks like. Welcome to
DaaS 2.0 — collection, analysis, and
actionable strategy.
An insightful
qualitative and
quantitative data
practice that extends
across the bow tie
funnel
Extracting and
disseminating
actionable ideas from
the insights so teams
know how to
effectively tap into
data
Translating
observations into a
data science
approach to clean,
analyze, and visualize
insights from across
your entire
organization
What Modern Data as a Service Looks Like
Enterprises cannot deliver a sublime
customer experience without
understanding empathy-based insights
at every single one of the key moments of
the client’s journey.
Modern DaaS providers know how to
collect behavioral insights and tap into
generative AI to unpack the human
experience behind the data points, so
that you can move more strategically and
effectively toward growth.
Pains
Motivations
Solutions
Measurements
Cognitive Associations
Pains
Motivations
Solutions
Measurements
Cognitive Associations
Cohort
First-Time Buyer
Employee Customer
EX / CX EMPATHY MAP
Cohort
Employee Customer
It’s Never Been More Important to Strengthen Your
Data Practices
Data goes to the heart of every
person who’s spending their hard
earned money with you. But not all
data practices are created equal or
ethical.
One way organizations have started
to tap into data and AI as a means of
increasing revenues is through
targeted pricing — a practice that’s
currently under investigation by the
Federal Trade Commission (FTC).
What motivates
customers to
buy — and why
do they stay
brand loyal?
How to align
different human
behavior needs,
wants, and
desires
How to
effectively
reinforce value
constantly to
customers
Adding Context With
Qualitative Data
Effective DaaS partners leverage insights to
adjust strategies, save money, and build
retention while understanding the
macroeconomic backdrop.
Rather than defaulting to discounts, there’s a
distinct opportunity to keep profit margins
higher by leveraging platforms, messaging,
and experiences to communicate value, reach
customers, and influence decision making
beyond the price tag.
Of respondents
would splurge on
their child’s must
have back-to-school
product
Average spend on
back-to-school items
per child down just
$11 from 2023
Of the back-to-school
budget expected to
be spent by the end
of July to take
advantage of the best
deals
Challenges and Limitations of Legacy Data Practices
When you zoom out on a modern timeline, it might feel funny to
talk about legacy data strategies. Because this practice has
moved at such a breakneck pace, many organizations have
fallen into three critical traps:
Siloed-based
thinking
Lack of actionable
insights
Surface-level takeaways
that send teams in the
wrong direction
Breaking Data Out of Silos
Too often, teams work independently of
one another. Even when an organization
has a clear North Star Metric, siloed based
communications often lead one team to
work toward a different goal than another.
Having a DaaS provider as a third party
voice can help mitigate these internal
conflicts and break down silo walls. As a
result, teams will work in closer harmony
while working towards unified goals.
Data allows departments to come
together on the same page
Making Data Actionable
Data governance is crucial. With just one
error, teams can be sent in the wrong
direction due to inaccurate insights.
Because of this risk, teams are often left in
the dark, unsure of what insights they
should leverage, or how to apply them to
their existing roadmap.
When data isn’t actionable, teams aren’t
sure how to reduce cost of acquisition
(CAC), increase lifetime value (LTV), or
build retention both internally or
externally.
Applying actionable insights to results-driven roadmaps
keeps teams on track for success
Applying Empathy to
Insights
Too often, data is taken at face value.
Legacy data practices often don’t account
for the people behind the responses.
For years it was admirable to take a
data-driven approach. Now, this approach
has been deemed riskier because it can
cause teams to use data to inform the
wrong thing and think of data as an
absolute.
Insights-Centric
Data-Centric
Data-Driven
Insights-centric
cultures use data to
answer the WHY
Data-centric cultures
use data to inform &
validate; not drive
decision making
Data-driven culture
goes sideways when
data are used to
inform the wrong
thing, as an absolute,
and as business first
Outdated Data Practices Threaten Nike
One company that realized these risks of taking an outdated data-driven
approach recently was Nike who reported 25 billion dollars lost in one day,
along with 130 million shares exchanged in the stock market at the lowest
share price since 2018.
Nike’s Rocky Sales from 2023 - 2024
Sales to Wholesale Customers
Sales Through Nike Direct
2024 Q4
2024 Q1
2024 Q2
2024 Q3
2023 Q4
NIKE INC. (NKE) PE RATIO
-8% -6% -4
%
-2% 0% 2% 4% 6% 8% 10% 12% 14%
2014 2016 2018 2020 2022 2024
0.0
25
50
75
19.6
Using DaaS to Build Effective
Data Practices
Modern organizations must marry both
quantitative and qualitative data to drive
strategic decision making.
While quantitative data provides
measurable metrics, having a qualitative
data practice in place can help you go
deeper to understand the psychological,
emotional, and social factors that will help
determine why people buy and ultimately
why they become brand ambassadors.
Implementing a Qualitative
Data Practice
When a DaaS provider comes into your
organization, you should be tapping into
qualitative data to achieve these three
elements for success:
● Understanding what motivates
customers to buy and stay loyal
● Aligning wants, desires, and needs
with acquisition and retention
strategies
● Effectively and constantly reinforcing
value
Qualitative data practices uncover 360-Degree
insights of customers and employees
What Does an Effective Qualitative Data Practice
Look Like?
Qualitative data starts by better understanding the Total Addressable
Market (TAM) via insights-driven cohorts and personas.
ACQUISITION RETENTION
TRIGGERS
FACTORS
DISCOVERY
ASSOCIATIONS
ALT.
ONBOARDING
PURCHASE.
EXPERIENCE
COMMUNITY
INTENTION
1. Finding the total
addressable market
across personas and
data-driven cohorts
4. Unearthing an
execution plan to
kickstart the success of
this qualitative data
practice
3. Defining data
science best practices
for converting
qualitative to
quantitative data
2. Defining the most
useful qualitative data
for both acquisition
and retention sides of
the funnel
Leveraging Qualitative Data to Understand the
Total Addressable Market’s Journey
Qualitative data allows organizations to go beyond demographics and
understand where each cohort is in their self-awareness journey.
PROBLEM
UNAWARE
PROBLEM
AWARE
SOLUTION
UNAWARE
SOLUTION
AWARE
BRAND
UNAWARE
BRAND
AWARE
I have not
experienced
a moment in
my life where
I’d need what
the
organization
offers.
I have
thought
about this
problem but
am not sure
the
ramifications
of not fixing
it.
I know what
the
ramifications
are of
ignoring the
problem, but
not sure of
any solutions
to help.
I know the
available
solutions but
am not sure
of the
benefits of
each solution
offered.
When I think
of these
solutions, I
think of
Brand X and
Brand Y.
Other brands
are
unfamiliar.
I’m aware of
that Brand X
offers the
solution but
have not
made a
decision
about
whether or
not to buy
yet.
Extracting Behavioral
Insights from Data-Driven
Cohorts
What’s important about this framework
is that each cohort in TAM will take a
unique journey in their behavior to move
through each stage of the journey.
Effective qualitative data also looks at
why each of these various cohorts are
taking such different paths to purchase.
This requires a deeper understanding of
what’s happening across each of the
awareness stages.
PERSONAS A B C E
D F G
A C F
G
Sees an Ad
Visits the
brand
website
Enters lead
generation
funnel
Receives lead
generation
email
Reads
reviews
Makes a
purchase
YouTube
affiliate
video
Reads
reviews
Visits the
brand
website
Retargeting
ad
Makes a
purchase
Instagram
affiliate
Served
direct
sales ad
Makes a
purchase
B E D
COHORT
COHORT
COHORT
Magazine
YouTube
Social
Qualitative Insights at Every Stage of the
Acquisition Funnel
Problem Unaware
Problem Aware
Problem Aware
Solution Unaware
Solution Unaware
Solution Aware
Solution Aware
Brand Unaware
Brand Unaware
Brand Aware
TRIGGERS
FACTORS
DISCOVERY
ASSOCIATIONS
ALT.
Key life moments when a
person becomes problem
aware
Emotional and logical triggers
that cause a person to take
action and research
Platforms used to research
and deep dive into finding
a solution
Subconscious questions about
whether a brand is right for them
or has what they’re looking for
Brand alternatives that could
provide a better solution
Insights-Driven
Analysis of the
Acquisition Funnel
Putting the full strength of
practice allows you to see the
full strength of the possibilities
available in each stage of the
funnel.
A DaaS partner can show you
the opportunities that lied at
each stage.
TRIGGERS FACTORS DISCOVERY ASSOCIATIONS
BRAND
ALTERNATIVES
Personas close to
the brand
Related but
further from the
brand
Distant from the
brand
What brought you
to ____ today?
Run for 30 days -
Price Focused
Run for 30 days -
Peace of Mind
Focused
Qualitative Insights at Every Stage of the Retention
Funnel
Focus on removing any buyer
remorse and encouraging
buyer excitement
Reinforce everything the buyer
needs, both emotionally and
logically, related to their
purchase
Continue reinforcing trust and
building a foundation around the
brand values
Create a sense of community
making every customer feel they
belong
Ask the customer to self-identify
how they value the brand
Problem Unaware
Problem Aware
Problem Aware
Solution Unaware
Solution Unaware
Solution Aware
Solution Aware
Brand Unaware
Brand Unaware
Brand Aware
RETENTION
COMMUNITY
EXPERIENCE
ONBOARDING
PURCHASE
Insights-Driven
Analysis of the
Retention Funnel
DaaS providers integrate
insights-driven ideas at every
single stage of the journey.
Through the findings of multiple
data loops put into strategic
motion, you can define the best
qualitative data practices,
quantify the qualitative insights,
and tap into the insights results
faster.
Pay
Success Page
Completed
Not
Completed
Reminder
Activation
Welcome
Email Sequence
Acknowledge
Your Best
Content
Invitation
Soft Sell
Surveys
Forums
In-Person
Events
Complete
Profile
Modern Data Looping From DaaS Providers Leads
to Faster Time to Insights
At a high level, there are five steps we walk through when designing a
modern data loop and analyzing the results.
Choose an appropriate
conversion method
Select data source &
understand context
Document and iterate
the process
Share and communicate
the insightful analysis
Validate conversion
output
1
2 4
5 3
Selecting Data Sources and
Conversion Methodologies
Without assessing your data limitations,
you’ll have a much harder time deriving
accurate insights out of what’s collected.
A modern DaaS provider is able to come in,
analyze your full data loop, and pinpoint
those limitations allowing for cleaner and
more contextually clearer analysis. With
that understanding and context, teams
can then move to step two — leveraging a
variety of conversion methodologies and
platforms to convert and interpret the data
points.
Conversion
Methods
Binning or Discretization
Categorization
Quantiles
Thresholding
Z-Score Binning
Ranking
Principal Component Analysis
Dummy Variables
Heatmap/Color Coding
Clustering
Decision Trees
Fuzzy Logic
Domain-Specific Rules
Visualization Based Methods
Trends by Images
Ranking and Ordering
Arrange in Sequence
Binary Conversion
0s and 1s
Clustering and Machine Learning
Grouping Patterns
Fuzzy and Domain-Specific Methods
Unique Criteria
Binning and Categorization
Grouping into Bins
Validating the Conversion Output
Preserve Variability
Ensure each category
reflects the underlying
variability of the findings.
Avoid Information Loss
Minimize the loss of important
information during the
conversion process.
Bias and Fairness
Ensure no new bias or
unfairness gets introduced
into the equation.
Transparency
Understand the conversion
methods and potential biases or
limitations.
Check Consistency
Ensure qualitative data
represents quantitative data
across the funnel.
Validate Against
Objectives
Verify the data meets initial
objectives and supports the
intended analysis.
Communicating Insightful
Analysis
DaaS providers add color to the black and
white picture of plain data by visualizing
and communicating the crucial findings.
Effective communication is a huge
challenge among organizations
gathering data from a variety of sources
and collection methodologies and
combining them to deliver the right
information to the right people in the last
mile of analysis.
Creating a Clear Roadmap From
a Data as a Service Analysis
Until now, we’ve covered using the modern bow
tie funnel and data looping process to extract
and understand critical insights.
But Data as a Service partners should not stop
here. True partnerships equip teams with a clear
roadmap for how to take those findings and
apply across the 3 Ps of an organization —
people, processes, and platforms.
Process
Platform
People
People: Onboarding a Supportive Team to Work
Alongside Your DaaS Partner
Many organizations aren’t operating
with this ideal structure yet. Hiring a
DaaS provider is meant to step into your
current organizational structure and
train your internal team to become
modern leaders.
Knowing what that structure looks like
can help you discern what your
organization needs and how a DaaS
provider can support you in getting
there.
People
Insights Leadership
● Behavioral Strategist
● Behavioral Economist
● Behavioral Data Scientist
Data Managers
● Qualitative Data Manager
● AI/ML Manager
● Private Cloud LLM
Manager
Data Collection
● PM Survey Coordinator
● Survey Design Specialist
● CX/UX
● Field Interviews
The Importance of Framework Alignment
To drive organizational buy-in, it’s crucial that all of the key players are
aligned on every element of the DaaS partnership. This is what we call
framework alignment.
Awareness
Stage
Customer
Journey
Funnel
Behavioral
Data
Data Maturity
Model
1 2 3 4
Processes: Intelligently Adding Generative AI Into
Your Data Practices
Rather than relying on AI to do all of the analysis, we believe in methodically
handing over parts of the data sequence for analysis, and then injecting a
human analysis throughout the process.
Stage 1:
Gathering
and Discovery
Stage 2:
Define
Strategy and
Scope
Stage 3:
Create Low-Fi
Wireframe
Stage 4:
Gap
Analysis
Stage 5:
Build
Reports
Stage 6:
Quality
Assurance
Stage 7:
Formal
Release and
Training
Business
questions are
evaluated to
determine
whether the
answers will
come in the form
of reports or
deeper analysis,
and whether the
questions can be
answered with
existing data.
We work
together to find
the metrics of
success,
stakeholders that
will use the
report, and
ultimately the
insights that this
dashboard report
should deliver to
enable business
growth
We propose a
dashboard to
visualize the end
state of the report
to assure the
alignment of the
stakeholder and
engineering.
Additional
resources can be
recommended at
this stage.
The wireframe
and data model is
handed over to
BI/ENG, at which
point they will
identify any gaps.
If no gaps,
engineering can
proceed to
develop flat
tables to support
cards within the
report.
Once the data
reports are
available, the
reports can be
built in a data
visualization
platform.
Once the reports
are built, all
metrics and
numbers should
be compared to
the raw data from
the original
source to ensure
accuracy. This
includes
checking
segments of data
over different
spans of time.
After the reports
have been
validated,
trainings can be
released to the
stakeholders.
Taking External Forces Into Account
Many external forces are not
considered when developing processes,
but are always influential, such as key
trends, industry forces, macroeconomic
forces, and market forces all impact
data operations at large.
Each of these elements must fit into
the equation at some point of your
analysis in order to get a more
accurate view of what’s happening and
what’s possible for your organization.
https://amzn.to/3ULWcVn
Foresight
Regulatory Trends
Technology Trends
Societal and Cultural Trends
Socioeconomic Trends
Competitive
Analysis
Market
Analysis
Macroeconomics
Suppliers and Value
Chain Actors
Stakeholders
Competitors
(Incumbents)
New Entrants
(Insurgents)
Substitute Products and
Services
Capital Markets
Global Market
Conditions
Economic Infrastructure
Commodities and Other Resources
Market Segments
Needs and
Demands
Market Issues
Switching Costs
Revenue
Attractiveness
Key
Trends
Macro
Trends
Industry
Trends
Market
Forces
Platforms for Strong Data Operations With a DaaS
Partner
The proliferation of new and emerging
platforms is enough to make even the
savviest of leader’s heads spin.
It’s hard to make sense of all these
available tools. There’s no possible way
every organization could use each of
these tools. Nor is it possible that every
tool is perfectly suited for every
business. That’s why, at RocketSource,
we remain staunchly tech agnostic.
Look at all of those
platforms - just for
marketing!
Leaning Into Emerging
Platforms
Bringing a DaaS provider into the
equation allows you to adopt AI
platforms in the right way, alleviating
complexity and increasing business
value.
Don’t go straight for the shiny new AI
platforms but instead take a
methodical approach to decide which
types of AI tools can be infused into
processes to speed time to insights
without eliminating the human touch.
Descriptive Diagnostic Predictive Prescriptive Cognitive
Without AI
Business Value
Complexity
With AI
Extracting Business Value From a Data as a Service
Partnership
To start identifying a clear roadmap rooted in data and insights, you
need to first understand the data maturity of your organization.
Trigger
Reactive
Proactive
What/Where When/How Why Will
Automation: Activities and systems are automated invisibly to improve performance to reduce human
error and improve reliability.
We want to evaluate
performance within our
marketing mix, sales
ops, and operations.
We want to evaluate a
change in performance
over time and apparent
correlations.
We want to understand the
external and internal key
drivers of consumer
behavior in the decisions to
buy and stay.
We want to product
how emerging trends
will impact business
financial health if they
continue.
We want to understand how
micro events within our
organization and workforce
can be optimized.
Metrics are pulled
manually either within
a single channel or into
spreadsheets for
analysis.
Additional charts and
decks are built to
illustrate metrics in
motion to relevant
teams.
One-off studies or activities
are run to answer why,
usually only following an
abnormal spike, crisis, or
issue.
Mean-based data is pulled
together from various
sources to inform action
for a fixed window of
time.
Ad hoc engagement data is
captured and observed to
inform the integration of
business units to drive
growth and reduce costs.
Data points are joined
into an automated
system to report for
specific analyses.
Dashboards are
standardized to inform
teams of their historical
performance in the
organization.
Insights are democratized at
a regular cadence to
evaluate product-market fit,
anticipating market forces.
Several distance measures
and data arrays are
measured with ML to
proact known trends and
optimize performance.
Automated systems
leveraging AI/ML ensure
alignment in people,
processes and platforms to
efficiently execute the
business model.
HINDSIGHT INSIGHT FORESIGHT
Go-to-Market Strategies for
Customer Acquisition and
Retention
As an organization, the desired action is
often to move potential buyers from
problem unaware to solution aware,
acquiring new customers as cost
effectively as possible. With data and
insights, your team can pinpoint where
customers are churning out of your bow
tie funnel, which we outlined above, and
how you can course correct to acquire and
retain more of those people before they
churn.
Would exchange
their data for better
brand experiences.
Expect an AI-driven
experience that is
personal
Of respondents insist on
keeping their data
private (was 61% prior to
ChatGPT becoming
prolific).
Expect an AI-driven
experience that is
relevant
Expect an AI-driven
experience that is
environmentally
friendly
Improving Behavioral Data Collection from Digital
Experiences
There are a plethora of data collection
tools, but DaaS providers aren’t
employed to answer isn’t which tool is
better than the other. They’re there to
help you find the right tools for your
organization so that you can most
effectively personalize customer and
employee experiences, and equip you to
drive your ability to drive full Account
Based Marketing (ABM) strategies.
Google Analytics 4 and/or
Adobe Analytics:
Offers advanced tracking
capabilities and insights into
user behavior across websites
and apps.
Google Tags:
Facilitates streamlined tagging
and tracking for
comprehensive data collection.
BigQuery:
Provides powerful data
warehousing and analytics,
allowing for efficient storage
and querying of large datasets.
Google Looker Studio and
Tableau:
Allows teams to visualize data
and contextualize the
takeaways to provide
meaningful insights to teams.
Tapping Into Data as a
Service for Account Based
Marketing
If you don’t have a solid data practice,
you can’t execute on the final output.
Until recently, leveraging data was
somewhat labor intensive.
Proper data collection processes that
tap into behavioral data and bring
teams closer to deeper insights can help
bring in higher quality leads, build
retention, and close more deals.
Find Top
Opportunities
Understand
Your
Cohorts
Personalize
Engagement
Organizational
Collaboration
Defined
Behavioral
Data
Tracking
Telling Data Stories through Data Visualization
Effective data storytelling is essential for ensuring stakeholders understand and
implement insights.
Acquisition Retention Trending Marketing Performance
Average CPA
$62
180 Day Persistency
72%
Retention
92%
% of Budget
26.2%
Net Membership
151,015
Total Spend
$395,015
Cancellations
22%
Ad Cost Performance
Net Memberships
Ad Cost Performance
Swim Lane Performance
Organic
Paid
Spend
Lead Gen
Sales
Group
Other
Total
Total Ads
Cost
Daily Net
Memberships
New Members
New Leads
New Members
New Members
New Members
Net Members
Net Members
Net Members
Net Members
Net Members
Net Members
Retention
Retention
Retention
Retention
Retention
Attrition
Attrition
Attrition
Attrition
Attrition
Attrition Retention Net Members
1,980
6,151
4,180
3,978
852
17,141
47,132
325
1,250
5,151
21,155
19,251
$369
6.5:1
$82
CPA Budget Spend to Date
$32,151 $12,515
$25 $91,150 $52,981
$55 $40,981 $11,901
$124 $7,915 $3500
$159 $18,910 $10,015
$85.1 $191,107 $90,912
Cancelled
Members
Retention
Attrition
Cancelled
Members
Retention
Attrition
Cancelled
Members
Saved
Members
Retention
Attrition Retention
Attrition Retention
Attrition Retention
563
132
654
422
10.2%
Cancelled
Members
696
Cancelled
Members
2,561
Total
Cancelled
51
Saved
Members
94
Saved
Members
22
73
Saved
Members
94
Saved
Members
251
Total
Saved
9.8%
5.2%
6.4%
9.8%
12.5%
89.8%
92.1%
95.8%
92.6%
90.2%
87.5%
Paid Spend
40%
Lead
Generation
20%
Organic
40%
CPA ROAS
Budget
12% 33% 42% 51% 72%
71% 78% 82% 83% 83%
189 Days
253 Days
210 Days
320 Days
Target 200 Days
Paid Spend Lead Generation
Sales Groups Organic
TCV:CPA Ratio Trend Average TCV
23.4% 6.3%
Existing
Memberships
New
Members
Returning
Memberships
Renewals
Call to
Cancel
Auto Cancel
Acquisition Retention Trending Marketing Performance
Average CPA
$62
180 Day Persistency
72%
Retention
92%
% of Budget
26.2%
Net Membership
151,015
Total Spend
$395,015
Cancellations
22%
Ad Cost Performance
Net Memberships
Ad Cost Performance
Swim Lane Performance
Organic
Paid Spend
Lead Gen
Sales Group
Other
Total
Total Ads Cost Daily Net Memberships
New Members
New Leads
New Members
New Members
New Members
Net Members
Net Members
Net Members
Net Members
Net Members
Net Members
Retention
Retention
Retention
Retention
Retention
Attrition
Attrition
Attrition
Attrition
Attrition
Attrition Retention Net Members
1,980
6,151
4,180
3,978
852
17,141
47,132
325
1,250
5,151
21,155
19,251
$369
6.5:1
$82
CPA Budget Spend to Date
$32,151 $12,515
$25 $91,150 $52,981
$55 $40,981 $11,901
$124 $7,915 $3500
$159 $18,910 $10,015
$85.1 $191,107 $90,912
Cancelled
Members
Retention
Attrition
Cancelled
Members
Retention
Attrition
Cancelled
Members
Saved
Members
Retention
Attrition Retention
Attrition Retention
Attrition Retention
563
132
654
422
10.2%
Cancelled
Members
696
Cancelled
Members
2,561
Total
Cancelled
51
Saved
Members
94
Saved
Members
22
73
Saved
Members
94
Saved
Members
251
Total Saved
9.8%
5.2%
6.4%
9.8%
12.5%
89.8%
92.1%
95.8%
92.6%
90.2%
87.5%
Paid Spend
40%
Lead Generation
20%
Organic
40%
CPA ROAS
Budget
12% 33% 42% 51% 72%
71% 78% 82% 83% 83%
189 Days
253 Days
210 Days
320 Days
Target 200 Days
Paid Spend Lead Generation
Sales Groups
Organic
TCV:CPA Ratio Trend Average TCV
23.4% 6.3%
Existing
Memberships
New Members Returning Memberships Renewals Call to Cancel Auto Cancel
Unlocking the Full Potential of
Data as a Service for Enterprise
Learn more at
RocketSource.com/Blog/Data-as-a-Service-Enterprise
Ad

More Related Content

Similar to Reimagining Data as a Service: Unlocking the Full Potential of Data as a Service for Enterprise (20)

Acquire Grow & Retain customers - The business imperative for Big Data
Acquire Grow & Retain customers - The business imperative for Big DataAcquire Grow & Retain customers - The business imperative for Big Data
Acquire Grow & Retain customers - The business imperative for Big Data
IBM Software India
 
How organizations can become data-driven: three main rules
How organizations can become data-driven: three main rulesHow organizations can become data-driven: three main rules
How organizations can become data-driven: three main rules
Andrea Gigli
 
How to Create a Data Analytics Roadmap
How to Create a Data Analytics RoadmapHow to Create a Data Analytics Roadmap
How to Create a Data Analytics Roadmap
CCG
 
Humanising-your-data-strategy
Humanising-your-data-strategyHumanising-your-data-strategy
Humanising-your-data-strategy
highgate10
 
Business success through data driven insights
Business success through data driven insightsBusiness success through data driven insights
Business success through data driven insights
Jeffrey Evans
 
Big_data for marketing and sales
Big_data for marketing and salesBig_data for marketing and sales
Big_data for marketing and sales
CMR WORLD TECH
 
Data-Analytics-Resource-updated for analysis
Data-Analytics-Resource-updated for analysisData-Analytics-Resource-updated for analysis
Data-Analytics-Resource-updated for analysis
BhavinGada5
 
Revealing B2B Digital Marketers biggest challenges
Revealing B2B Digital Marketers biggest challengesRevealing B2B Digital Marketers biggest challenges
Revealing B2B Digital Marketers biggest challenges
idio Ltd
 
Bridging the Gap Between Business Objectives and Data Strategy
Bridging the Gap Between Business Objectives and Data StrategyBridging the Gap Between Business Objectives and Data Strategy
Bridging the Gap Between Business Objectives and Data Strategy
RNayak3
 
Sas business analytics
Sas   business analyticsSas   business analytics
Sas business analytics
Naveen Kumar M K
 
Itsnotthesizeofthedataitshowyouuseitsmartermarketingwithanalyticsanddashboards
ItsnotthesizeofthedataitshowyouuseitsmartermarketingwithanalyticsanddashboardsItsnotthesizeofthedataitshowyouuseitsmartermarketingwithanalyticsanddashboards
Itsnotthesizeofthedataitshowyouuseitsmartermarketingwithanalyticsanddashboards
Koen Pauwels
 
Chief data-officers-guide-on-transforming-to-a-data-driven-organization
Chief data-officers-guide-on-transforming-to-a-data-driven-organizationChief data-officers-guide-on-transforming-to-a-data-driven-organization
Chief data-officers-guide-on-transforming-to-a-data-driven-organization
Happiest Minds Technologies
 
{08aa3660 6b82-45df-937f-1b54911df539} omc-mmeg-data_management-guide_final
{08aa3660 6b82-45df-937f-1b54911df539} omc-mmeg-data_management-guide_final{08aa3660 6b82-45df-937f-1b54911df539} omc-mmeg-data_management-guide_final
{08aa3660 6b82-45df-937f-1b54911df539} omc-mmeg-data_management-guide_final
'Ahmad.Wahid. Ashoor'
 
Developing a cult of analytics
Developing a cult of analyticsDeveloping a cult of analytics
Developing a cult of analytics
Steve Jackson
 
Optimizely building your_data_dna_e_booktthh
Optimizely building your_data_dna_e_booktthhOptimizely building your_data_dna_e_booktthh
Optimizely building your_data_dna_e_booktthh
ciciedeng
 
How to Maximize Time to Value From a Customer Data Platform.pdf
How to Maximize Time to Value From a Customer Data Platform.pdfHow to Maximize Time to Value From a Customer Data Platform.pdf
How to Maximize Time to Value From a Customer Data Platform.pdf
Enterprise world
 
The Data Centric Organization 2018
The Data Centric Organization 2018 The Data Centric Organization 2018
The Data Centric Organization 2018
Criteo
 
Bold prediction new
Bold prediction newBold prediction new
Bold prediction new
salvishreya11
 
The-Future-of-Marketing-Analytics-2024-Predictions-Unveiled.pdf
The-Future-of-Marketing-Analytics-2024-Predictions-Unveiled.pdfThe-Future-of-Marketing-Analytics-2024-Predictions-Unveiled.pdf
The-Future-of-Marketing-Analytics-2024-Predictions-Unveiled.pdf
marketgrowth081
 
How to Leverage the Power of Data Analytics in Sales?
How to Leverage the Power of Data Analytics in Sales?How to Leverage the Power of Data Analytics in Sales?
How to Leverage the Power of Data Analytics in Sales?
Shaily Shah
 
Acquire Grow & Retain customers - The business imperative for Big Data
Acquire Grow & Retain customers - The business imperative for Big DataAcquire Grow & Retain customers - The business imperative for Big Data
Acquire Grow & Retain customers - The business imperative for Big Data
IBM Software India
 
How organizations can become data-driven: three main rules
How organizations can become data-driven: three main rulesHow organizations can become data-driven: three main rules
How organizations can become data-driven: three main rules
Andrea Gigli
 
How to Create a Data Analytics Roadmap
How to Create a Data Analytics RoadmapHow to Create a Data Analytics Roadmap
How to Create a Data Analytics Roadmap
CCG
 
Humanising-your-data-strategy
Humanising-your-data-strategyHumanising-your-data-strategy
Humanising-your-data-strategy
highgate10
 
Business success through data driven insights
Business success through data driven insightsBusiness success through data driven insights
Business success through data driven insights
Jeffrey Evans
 
Big_data for marketing and sales
Big_data for marketing and salesBig_data for marketing and sales
Big_data for marketing and sales
CMR WORLD TECH
 
Data-Analytics-Resource-updated for analysis
Data-Analytics-Resource-updated for analysisData-Analytics-Resource-updated for analysis
Data-Analytics-Resource-updated for analysis
BhavinGada5
 
Revealing B2B Digital Marketers biggest challenges
Revealing B2B Digital Marketers biggest challengesRevealing B2B Digital Marketers biggest challenges
Revealing B2B Digital Marketers biggest challenges
idio Ltd
 
Bridging the Gap Between Business Objectives and Data Strategy
Bridging the Gap Between Business Objectives and Data StrategyBridging the Gap Between Business Objectives and Data Strategy
Bridging the Gap Between Business Objectives and Data Strategy
RNayak3
 
Itsnotthesizeofthedataitshowyouuseitsmartermarketingwithanalyticsanddashboards
ItsnotthesizeofthedataitshowyouuseitsmartermarketingwithanalyticsanddashboardsItsnotthesizeofthedataitshowyouuseitsmartermarketingwithanalyticsanddashboards
Itsnotthesizeofthedataitshowyouuseitsmartermarketingwithanalyticsanddashboards
Koen Pauwels
 
Chief data-officers-guide-on-transforming-to-a-data-driven-organization
Chief data-officers-guide-on-transforming-to-a-data-driven-organizationChief data-officers-guide-on-transforming-to-a-data-driven-organization
Chief data-officers-guide-on-transforming-to-a-data-driven-organization
Happiest Minds Technologies
 
{08aa3660 6b82-45df-937f-1b54911df539} omc-mmeg-data_management-guide_final
{08aa3660 6b82-45df-937f-1b54911df539} omc-mmeg-data_management-guide_final{08aa3660 6b82-45df-937f-1b54911df539} omc-mmeg-data_management-guide_final
{08aa3660 6b82-45df-937f-1b54911df539} omc-mmeg-data_management-guide_final
'Ahmad.Wahid. Ashoor'
 
Developing a cult of analytics
Developing a cult of analyticsDeveloping a cult of analytics
Developing a cult of analytics
Steve Jackson
 
Optimizely building your_data_dna_e_booktthh
Optimizely building your_data_dna_e_booktthhOptimizely building your_data_dna_e_booktthh
Optimizely building your_data_dna_e_booktthh
ciciedeng
 
How to Maximize Time to Value From a Customer Data Platform.pdf
How to Maximize Time to Value From a Customer Data Platform.pdfHow to Maximize Time to Value From a Customer Data Platform.pdf
How to Maximize Time to Value From a Customer Data Platform.pdf
Enterprise world
 
The Data Centric Organization 2018
The Data Centric Organization 2018 The Data Centric Organization 2018
The Data Centric Organization 2018
Criteo
 
The-Future-of-Marketing-Analytics-2024-Predictions-Unveiled.pdf
The-Future-of-Marketing-Analytics-2024-Predictions-Unveiled.pdfThe-Future-of-Marketing-Analytics-2024-Predictions-Unveiled.pdf
The-Future-of-Marketing-Analytics-2024-Predictions-Unveiled.pdf
marketgrowth081
 
How to Leverage the Power of Data Analytics in Sales?
How to Leverage the Power of Data Analytics in Sales?How to Leverage the Power of Data Analytics in Sales?
How to Leverage the Power of Data Analytics in Sales?
Shaily Shah
 

More from RocketSource (20)

The Indisputable Value of an Effective Qualitative Data Practice
The Indisputable Value of an Effective Qualitative Data PracticeThe Indisputable Value of an Effective Qualitative Data Practice
The Indisputable Value of an Effective Qualitative Data Practice
RocketSource
 
A Framework for Navigating Generative Artificial Intelligence for Enterprise
A Framework for Navigating Generative Artificial Intelligence for EnterpriseA Framework for Navigating Generative Artificial Intelligence for Enterprise
A Framework for Navigating Generative Artificial Intelligence for Enterprise
RocketSource
 
49 CX Terms You Need to Know for 2023
49 CX Terms You Need to Know for 202349 CX Terms You Need to Know for 2023
49 CX Terms You Need to Know for 2023
RocketSource
 
A Product-Led Growth Strategy for Enterprise
A Product-Led Growth Strategy for EnterpriseA Product-Led Growth Strategy for Enterprise
A Product-Led Growth Strategy for Enterprise
RocketSource
 
The Power of a Proper North Star Metric
The Power of a Proper North Star MetricThe Power of a Proper North Star Metric
The Power of a Proper North Star Metric
RocketSource
 
The Revenue Operations to Revenue Acceleration Framework Every Modern Busines...
The Revenue Operations to Revenue Acceleration Framework Every Modern Busines...The Revenue Operations to Revenue Acceleration Framework Every Modern Busines...
The Revenue Operations to Revenue Acceleration Framework Every Modern Busines...
RocketSource
 
Uncovering an Innovative Monetization Strategy to Keep Your Organization Rele...
Uncovering an Innovative Monetization Strategy to Keep Your Organization Rele...Uncovering an Innovative Monetization Strategy to Keep Your Organization Rele...
Uncovering an Innovative Monetization Strategy to Keep Your Organization Rele...
RocketSource
 
Leveraging StoryVesting to Find Product-Market Fit
Leveraging StoryVesting to Find Product-Market FitLeveraging StoryVesting to Find Product-Market Fit
Leveraging StoryVesting to Find Product-Market Fit
RocketSource
 
The 4 Machine Learning Models Imperative for Business Transformation
The 4 Machine Learning Models Imperative for Business TransformationThe 4 Machine Learning Models Imperative for Business Transformation
The 4 Machine Learning Models Imperative for Business Transformation
RocketSource
 
Transforming the Digital Experience Via Customer Journey Mapping
Transforming the Digital Experience Via Customer Journey MappingTransforming the Digital Experience Via Customer Journey Mapping
Transforming the Digital Experience Via Customer Journey Mapping
RocketSource
 
The Incidental Science of Organizational Growth via Digital Transformation
The Incidental Science of Organizational Growth via Digital Transformation The Incidental Science of Organizational Growth via Digital Transformation
The Incidental Science of Organizational Growth via Digital Transformation
RocketSource
 
Leveraging the StoryVesting Framework to Achieve Breakthrough Business Transf...
Leveraging the StoryVesting Framework to Achieve Breakthrough Business Transf...Leveraging the StoryVesting Framework to Achieve Breakthrough Business Transf...
Leveraging the StoryVesting Framework to Achieve Breakthrough Business Transf...
RocketSource
 
Data as a Service (DaaS): The What, Why, How, Who, and When
Data as a Service (DaaS): The What, Why, How, Who, and WhenData as a Service (DaaS): The What, Why, How, Who, and When
Data as a Service (DaaS): The What, Why, How, Who, and When
RocketSource
 
Recession Business Strategy: What to Do Before, During, and After a Recession
Recession Business Strategy: What to Do Before, During, and After a RecessionRecession Business Strategy: What to Do Before, During, and After a Recession
Recession Business Strategy: What to Do Before, During, and After a Recession
RocketSource
 
Humanizing Big Data: The Key to Actionable Customer Journey Analytics
Humanizing Big Data: The Key to Actionable Customer Journey AnalyticsHumanizing Big Data: The Key to Actionable Customer Journey Analytics
Humanizing Big Data: The Key to Actionable Customer Journey Analytics
RocketSource
 
The S Curve of Business: The Key Levers to Sustaining Momentum for Your Brand
The S Curve of Business: The Key Levers to Sustaining Momentum for Your BrandThe S Curve of Business: The Key Levers to Sustaining Momentum for Your Brand
The S Curve of Business: The Key Levers to Sustaining Momentum for Your Brand
RocketSource
 
The Gift of Roger Federer to Corporate America
The Gift of Roger Federer to Corporate AmericaThe Gift of Roger Federer to Corporate America
The Gift of Roger Federer to Corporate America
RocketSource
 
The Customer Journey Funnel: The Key to Sustainable Growth
The Customer Journey Funnel: The Key to Sustainable GrowthThe Customer Journey Funnel: The Key to Sustainable Growth
The Customer Journey Funnel: The Key to Sustainable Growth
RocketSource
 
The Indisputable Value of an Effective Qualitative Data Practice
The Indisputable Value of an Effective Qualitative Data PracticeThe Indisputable Value of an Effective Qualitative Data Practice
The Indisputable Value of an Effective Qualitative Data Practice
RocketSource
 
A Framework for Navigating Generative Artificial Intelligence for Enterprise
A Framework for Navigating Generative Artificial Intelligence for EnterpriseA Framework for Navigating Generative Artificial Intelligence for Enterprise
A Framework for Navigating Generative Artificial Intelligence for Enterprise
RocketSource
 
49 CX Terms You Need to Know for 2023
49 CX Terms You Need to Know for 202349 CX Terms You Need to Know for 2023
49 CX Terms You Need to Know for 2023
RocketSource
 
A Product-Led Growth Strategy for Enterprise
A Product-Led Growth Strategy for EnterpriseA Product-Led Growth Strategy for Enterprise
A Product-Led Growth Strategy for Enterprise
RocketSource
 
The Power of a Proper North Star Metric
The Power of a Proper North Star MetricThe Power of a Proper North Star Metric
The Power of a Proper North Star Metric
RocketSource
 
The Revenue Operations to Revenue Acceleration Framework Every Modern Busines...
The Revenue Operations to Revenue Acceleration Framework Every Modern Busines...The Revenue Operations to Revenue Acceleration Framework Every Modern Busines...
The Revenue Operations to Revenue Acceleration Framework Every Modern Busines...
RocketSource
 
Uncovering an Innovative Monetization Strategy to Keep Your Organization Rele...
Uncovering an Innovative Monetization Strategy to Keep Your Organization Rele...Uncovering an Innovative Monetization Strategy to Keep Your Organization Rele...
Uncovering an Innovative Monetization Strategy to Keep Your Organization Rele...
RocketSource
 
Uncovering an Innovative Monetization Strategy to Keep Your Organization Rele...
Uncovering an Innovative Monetization Strategy to Keep Your Organization Rele...Uncovering an Innovative Monetization Strategy to Keep Your Organization Rele...
Uncovering an Innovative Monetization Strategy to Keep Your Organization Rele...
RocketSource
 
Uncovering an Innovative Monetization Strategy to Keep Your Organization Rele...
Uncovering an Innovative Monetization Strategy to Keep Your Organization Rele...Uncovering an Innovative Monetization Strategy to Keep Your Organization Rele...
Uncovering an Innovative Monetization Strategy to Keep Your Organization Rele...
RocketSource
 
Leveraging StoryVesting to Find Product-Market Fit
Leveraging StoryVesting to Find Product-Market FitLeveraging StoryVesting to Find Product-Market Fit
Leveraging StoryVesting to Find Product-Market Fit
RocketSource
 
The 4 Machine Learning Models Imperative for Business Transformation
The 4 Machine Learning Models Imperative for Business TransformationThe 4 Machine Learning Models Imperative for Business Transformation
The 4 Machine Learning Models Imperative for Business Transformation
RocketSource
 
Transforming the Digital Experience Via Customer Journey Mapping
Transforming the Digital Experience Via Customer Journey MappingTransforming the Digital Experience Via Customer Journey Mapping
Transforming the Digital Experience Via Customer Journey Mapping
RocketSource
 
The Incidental Science of Organizational Growth via Digital Transformation
The Incidental Science of Organizational Growth via Digital Transformation The Incidental Science of Organizational Growth via Digital Transformation
The Incidental Science of Organizational Growth via Digital Transformation
RocketSource
 
Leveraging the StoryVesting Framework to Achieve Breakthrough Business Transf...
Leveraging the StoryVesting Framework to Achieve Breakthrough Business Transf...Leveraging the StoryVesting Framework to Achieve Breakthrough Business Transf...
Leveraging the StoryVesting Framework to Achieve Breakthrough Business Transf...
RocketSource
 
Data as a Service (DaaS): The What, Why, How, Who, and When
Data as a Service (DaaS): The What, Why, How, Who, and WhenData as a Service (DaaS): The What, Why, How, Who, and When
Data as a Service (DaaS): The What, Why, How, Who, and When
RocketSource
 
Recession Business Strategy: What to Do Before, During, and After a Recession
Recession Business Strategy: What to Do Before, During, and After a RecessionRecession Business Strategy: What to Do Before, During, and After a Recession
Recession Business Strategy: What to Do Before, During, and After a Recession
RocketSource
 
Humanizing Big Data: The Key to Actionable Customer Journey Analytics
Humanizing Big Data: The Key to Actionable Customer Journey AnalyticsHumanizing Big Data: The Key to Actionable Customer Journey Analytics
Humanizing Big Data: The Key to Actionable Customer Journey Analytics
RocketSource
 
The S Curve of Business: The Key Levers to Sustaining Momentum for Your Brand
The S Curve of Business: The Key Levers to Sustaining Momentum for Your BrandThe S Curve of Business: The Key Levers to Sustaining Momentum for Your Brand
The S Curve of Business: The Key Levers to Sustaining Momentum for Your Brand
RocketSource
 
The Gift of Roger Federer to Corporate America
The Gift of Roger Federer to Corporate AmericaThe Gift of Roger Federer to Corporate America
The Gift of Roger Federer to Corporate America
RocketSource
 
The Customer Journey Funnel: The Key to Sustainable Growth
The Customer Journey Funnel: The Key to Sustainable GrowthThe Customer Journey Funnel: The Key to Sustainable Growth
The Customer Journey Funnel: The Key to Sustainable Growth
RocketSource
 
Ad

Recently uploaded (20)

TMG - Q3 2025 Earnings Call Slides - v4.pptx
TMG - Q3 2025 Earnings Call Slides - v4.pptxTMG - Q3 2025 Earnings Call Slides - v4.pptx
TMG - Q3 2025 Earnings Call Slides - v4.pptx
Marketing847413
 
Salesforce_Architecture_Diagramming_Workshop (1).pptx
Salesforce_Architecture_Diagramming_Workshop (1).pptxSalesforce_Architecture_Diagramming_Workshop (1).pptx
Salesforce_Architecture_Diagramming_Workshop (1).pptx
reinbauwens1
 
Solaris Resources Presentation - Corporate April 2025.pdf
Solaris Resources Presentation - Corporate April 2025.pdfSolaris Resources Presentation - Corporate April 2025.pdf
Solaris Resources Presentation - Corporate April 2025.pdf
pchambers2
 
Treis & Friends One sheet - Portfolio IV
Treis & Friends One sheet - Portfolio IVTreis & Friends One sheet - Portfolio IV
Treis & Friends One sheet - Portfolio IV
aparicioregina7
 
Progress Report - Workday Analyst Summit 2025 - Change fo the better coming
Progress Report - Workday Analyst Summit 2025 - Change fo the better comingProgress Report - Workday Analyst Summit 2025 - Change fo the better coming
Progress Report - Workday Analyst Summit 2025 - Change fo the better coming
Holger Mueller
 
Chapter 2000000000000000000000000000000000000.pptx
Chapter 2000000000000000000000000000000000000.pptxChapter 2000000000000000000000000000000000000.pptx
Chapter 2000000000000000000000000000000000000.pptx
behjatali99
 
Freeze-Dried Fruit Powder Market Trends & Growth
Freeze-Dried Fruit Powder Market Trends & GrowthFreeze-Dried Fruit Powder Market Trends & Growth
Freeze-Dried Fruit Powder Market Trends & Growth
chanderdeepseoexpert
 
CGG Deck English - Apr 2025-edit (1).pptx
CGG Deck English - Apr 2025-edit (1).pptxCGG Deck English - Apr 2025-edit (1).pptx
CGG Deck English - Apr 2025-edit (1).pptx
China_Gold_International_Resources
 
Entrepreneurship: Practicum on Business Plan.ppt
Entrepreneurship: Practicum on Business Plan.pptEntrepreneurship: Practicum on Business Plan.ppt
Entrepreneurship: Practicum on Business Plan.ppt
Tribhuvan University
 
LDMMIA Bday celebration 2025 Gifts information
LDMMIA Bday celebration 2025 Gifts informationLDMMIA Bday celebration 2025 Gifts information
LDMMIA Bday celebration 2025 Gifts information
LDM Mia eStudios
 
Cloud Stream Part II Mobile Hub V1 Hub Agency.pdf
Cloud Stream Part II Mobile Hub V1 Hub Agency.pdfCloud Stream Part II Mobile Hub V1 Hub Agency.pdf
Cloud Stream Part II Mobile Hub V1 Hub Agency.pdf
Brij Consulting, LLC
 
AlaskaSilver Corporate Presentation Apr 28 2025.pdf
AlaskaSilver Corporate Presentation Apr 28 2025.pdfAlaskaSilver Corporate Presentation Apr 28 2025.pdf
AlaskaSilver Corporate Presentation Apr 28 2025.pdf
Western Alaska Minerals Corp.
 
Understanding Dynamic Competition: Perspectives on Monopoly and Market Power ...
Understanding Dynamic Competition: Perspectives on Monopoly and Market Power ...Understanding Dynamic Competition: Perspectives on Monopoly and Market Power ...
Understanding Dynamic Competition: Perspectives on Monopoly and Market Power ...
David Teece
 
SAP S/4HANA Asset Management - Functions and Innovations
SAP S/4HANA Asset Management - Functions and InnovationsSAP S/4HANA Asset Management - Functions and Innovations
SAP S/4HANA Asset Management - Functions and Innovations
Course17
 
From Dreams to Threads: The Story Behind The Chhapai
From Dreams to Threads: The Story Behind The ChhapaiFrom Dreams to Threads: The Story Behind The Chhapai
From Dreams to Threads: The Story Behind The Chhapai
The Chhapai
 
www.visualmedia.com digital markiting (1).pptx
www.visualmedia.com digital markiting (1).pptxwww.visualmedia.com digital markiting (1).pptx
www.visualmedia.com digital markiting (1).pptx
Davinder Singh
 
Network Detection and Response (NDR): The Future of Intelligent Cybersecurity
Network Detection and Response (NDR): The Future of Intelligent CybersecurityNetwork Detection and Response (NDR): The Future of Intelligent Cybersecurity
Network Detection and Response (NDR): The Future of Intelligent Cybersecurity
GauriKale30
 
Mexico Office Furniture Market Share, Size, Growth & Trends (2025-2034)
Mexico Office Furniture Market Share, Size, Growth & Trends (2025-2034)Mexico Office Furniture Market Share, Size, Growth & Trends (2025-2034)
Mexico Office Furniture Market Share, Size, Growth & Trends (2025-2034)
janewatson684
 
NewBase 28 April 2025 Energy News issue - 1783 by Khaled Al Awadi_compressed...
NewBase 28 April 2025  Energy News issue - 1783 by Khaled Al Awadi_compressed...NewBase 28 April 2025  Energy News issue - 1783 by Khaled Al Awadi_compressed...
NewBase 28 April 2025 Energy News issue - 1783 by Khaled Al Awadi_compressed...
Khaled Al Awadi
 
Alec Lawler - A Passion For Building Brand Awareness
Alec Lawler - A Passion For Building Brand AwarenessAlec Lawler - A Passion For Building Brand Awareness
Alec Lawler - A Passion For Building Brand Awareness
Alec Lawler
 
TMG - Q3 2025 Earnings Call Slides - v4.pptx
TMG - Q3 2025 Earnings Call Slides - v4.pptxTMG - Q3 2025 Earnings Call Slides - v4.pptx
TMG - Q3 2025 Earnings Call Slides - v4.pptx
Marketing847413
 
Salesforce_Architecture_Diagramming_Workshop (1).pptx
Salesforce_Architecture_Diagramming_Workshop (1).pptxSalesforce_Architecture_Diagramming_Workshop (1).pptx
Salesforce_Architecture_Diagramming_Workshop (1).pptx
reinbauwens1
 
Solaris Resources Presentation - Corporate April 2025.pdf
Solaris Resources Presentation - Corporate April 2025.pdfSolaris Resources Presentation - Corporate April 2025.pdf
Solaris Resources Presentation - Corporate April 2025.pdf
pchambers2
 
Treis & Friends One sheet - Portfolio IV
Treis & Friends One sheet - Portfolio IVTreis & Friends One sheet - Portfolio IV
Treis & Friends One sheet - Portfolio IV
aparicioregina7
 
Progress Report - Workday Analyst Summit 2025 - Change fo the better coming
Progress Report - Workday Analyst Summit 2025 - Change fo the better comingProgress Report - Workday Analyst Summit 2025 - Change fo the better coming
Progress Report - Workday Analyst Summit 2025 - Change fo the better coming
Holger Mueller
 
Chapter 2000000000000000000000000000000000000.pptx
Chapter 2000000000000000000000000000000000000.pptxChapter 2000000000000000000000000000000000000.pptx
Chapter 2000000000000000000000000000000000000.pptx
behjatali99
 
Freeze-Dried Fruit Powder Market Trends & Growth
Freeze-Dried Fruit Powder Market Trends & GrowthFreeze-Dried Fruit Powder Market Trends & Growth
Freeze-Dried Fruit Powder Market Trends & Growth
chanderdeepseoexpert
 
Entrepreneurship: Practicum on Business Plan.ppt
Entrepreneurship: Practicum on Business Plan.pptEntrepreneurship: Practicum on Business Plan.ppt
Entrepreneurship: Practicum on Business Plan.ppt
Tribhuvan University
 
LDMMIA Bday celebration 2025 Gifts information
LDMMIA Bday celebration 2025 Gifts informationLDMMIA Bday celebration 2025 Gifts information
LDMMIA Bday celebration 2025 Gifts information
LDM Mia eStudios
 
Cloud Stream Part II Mobile Hub V1 Hub Agency.pdf
Cloud Stream Part II Mobile Hub V1 Hub Agency.pdfCloud Stream Part II Mobile Hub V1 Hub Agency.pdf
Cloud Stream Part II Mobile Hub V1 Hub Agency.pdf
Brij Consulting, LLC
 
Understanding Dynamic Competition: Perspectives on Monopoly and Market Power ...
Understanding Dynamic Competition: Perspectives on Monopoly and Market Power ...Understanding Dynamic Competition: Perspectives on Monopoly and Market Power ...
Understanding Dynamic Competition: Perspectives on Monopoly and Market Power ...
David Teece
 
SAP S/4HANA Asset Management - Functions and Innovations
SAP S/4HANA Asset Management - Functions and InnovationsSAP S/4HANA Asset Management - Functions and Innovations
SAP S/4HANA Asset Management - Functions and Innovations
Course17
 
From Dreams to Threads: The Story Behind The Chhapai
From Dreams to Threads: The Story Behind The ChhapaiFrom Dreams to Threads: The Story Behind The Chhapai
From Dreams to Threads: The Story Behind The Chhapai
The Chhapai
 
www.visualmedia.com digital markiting (1).pptx
www.visualmedia.com digital markiting (1).pptxwww.visualmedia.com digital markiting (1).pptx
www.visualmedia.com digital markiting (1).pptx
Davinder Singh
 
Network Detection and Response (NDR): The Future of Intelligent Cybersecurity
Network Detection and Response (NDR): The Future of Intelligent CybersecurityNetwork Detection and Response (NDR): The Future of Intelligent Cybersecurity
Network Detection and Response (NDR): The Future of Intelligent Cybersecurity
GauriKale30
 
Mexico Office Furniture Market Share, Size, Growth & Trends (2025-2034)
Mexico Office Furniture Market Share, Size, Growth & Trends (2025-2034)Mexico Office Furniture Market Share, Size, Growth & Trends (2025-2034)
Mexico Office Furniture Market Share, Size, Growth & Trends (2025-2034)
janewatson684
 
NewBase 28 April 2025 Energy News issue - 1783 by Khaled Al Awadi_compressed...
NewBase 28 April 2025  Energy News issue - 1783 by Khaled Al Awadi_compressed...NewBase 28 April 2025  Energy News issue - 1783 by Khaled Al Awadi_compressed...
NewBase 28 April 2025 Energy News issue - 1783 by Khaled Al Awadi_compressed...
Khaled Al Awadi
 
Alec Lawler - A Passion For Building Brand Awareness
Alec Lawler - A Passion For Building Brand AwarenessAlec Lawler - A Passion For Building Brand Awareness
Alec Lawler - A Passion For Building Brand Awareness
Alec Lawler
 
Ad

Reimagining Data as a Service: Unlocking the Full Potential of Data as a Service for Enterprise

  • 1. Reimagining Data as a Service for Enterprise Acquisition Retention Trending Marketing Performance Average CPA $62 180 Day Persistency 72% Retention 92% % of Budget 26.2% Net Membership 151,015 Total Spend $395,015 Cancellations 22% Ad Cost Performance Net Memberships Ad Cost Performance Swim Lane Performance Organic Paid Spend Lead Gen Sales Group Other Total Total Ads Cost Daily Net Memberships New Members New Leads New Members New Members New Members Net Members Net Members Net Members Net Members Net Members Net Members Retention Retention Retention Retention Retention Attrition Attrition Attrition Attrition Attrition Attrition Retention Net Members 1,980 6,151 4,180 3,978 852 17,141 47,132 325 1,250 5,151 21,155 19,251 $369 6.5:1 $82 CPA Budget Spend to Date CPA Budget Spend to Date CPA Budget Spend to Date CPA Budget Spend to Date CPA Budget Spend to Date CPA Budget Spend to Date $32,151 $12,515 $25 $91,150 $52,981 $55 $40,981 $11,901 $124 $7,915 $3500 $159 $18,910 $10,015 $85.1 $191,107 $90,912 Cancelled Members Retention Attrition Cancelled Members Retention Attrition Cancelled Members Saved Members Retention Attrition Retention Attrition Retention Attrition Retention 563 132 654 422 10.2% Cancelled Members 696 Cancelled Members 2,561 Total Cancelled 51 Saved Members 94 Saved Members 22 73 Saved Members 94 Saved Members 251 Total Saved 9.8% 5.2% 6.4% 9.8% 12.5% 89.8% 92.1% 95.8% 92.6% 90.2% 87.5% Paid Spend 40% Lead Generation 20% Organic 40% CPA ROAS Budget 12% 33% 42% 51% 72% 71% 78% 82% 83% 83% 189 Days 253 Days 210 Days 320 Days Target 200 Days Paid Spend Lead Generation Sales Groups Organic TCV:CPA Ratio Trend Average TCV 23.4% 6.3% Existing Memberships New Members Returning Memberships Renewals Call to Cancel Auto Cancel
  • 2. Welcome to Data as a Service 2.0 Teams are desperate for a clearer idea of how to strategically adopt generative AI to tame big data, infuse human behavior into those big data sets, and properly disseminate the top insights to all teams. It’s this need that has reshaped what Data as a Service looks like. Welcome to DaaS 2.0 — collection, analysis, and actionable strategy. An insightful qualitative and quantitative data practice that extends across the bow tie funnel Extracting and disseminating actionable ideas from the insights so teams know how to effectively tap into data Translating observations into a data science approach to clean, analyze, and visualize insights from across your entire organization
  • 3. What Modern Data as a Service Looks Like Enterprises cannot deliver a sublime customer experience without understanding empathy-based insights at every single one of the key moments of the client’s journey. Modern DaaS providers know how to collect behavioral insights and tap into generative AI to unpack the human experience behind the data points, so that you can move more strategically and effectively toward growth. Pains Motivations Solutions Measurements Cognitive Associations Pains Motivations Solutions Measurements Cognitive Associations Cohort First-Time Buyer Employee Customer EX / CX EMPATHY MAP Cohort Employee Customer
  • 4. It’s Never Been More Important to Strengthen Your Data Practices Data goes to the heart of every person who’s spending their hard earned money with you. But not all data practices are created equal or ethical. One way organizations have started to tap into data and AI as a means of increasing revenues is through targeted pricing — a practice that’s currently under investigation by the Federal Trade Commission (FTC). What motivates customers to buy — and why do they stay brand loyal? How to align different human behavior needs, wants, and desires How to effectively reinforce value constantly to customers
  • 5. Adding Context With Qualitative Data Effective DaaS partners leverage insights to adjust strategies, save money, and build retention while understanding the macroeconomic backdrop. Rather than defaulting to discounts, there’s a distinct opportunity to keep profit margins higher by leveraging platforms, messaging, and experiences to communicate value, reach customers, and influence decision making beyond the price tag. Of respondents would splurge on their child’s must have back-to-school product Average spend on back-to-school items per child down just $11 from 2023 Of the back-to-school budget expected to be spent by the end of July to take advantage of the best deals
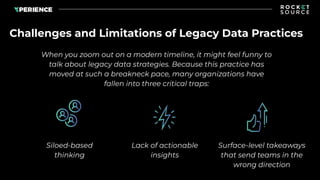
  • 6. Challenges and Limitations of Legacy Data Practices When you zoom out on a modern timeline, it might feel funny to talk about legacy data strategies. Because this practice has moved at such a breakneck pace, many organizations have fallen into three critical traps: Siloed-based thinking Lack of actionable insights Surface-level takeaways that send teams in the wrong direction
  • 7. Breaking Data Out of Silos Too often, teams work independently of one another. Even when an organization has a clear North Star Metric, siloed based communications often lead one team to work toward a different goal than another. Having a DaaS provider as a third party voice can help mitigate these internal conflicts and break down silo walls. As a result, teams will work in closer harmony while working towards unified goals. Data allows departments to come together on the same page
  • 8. Making Data Actionable Data governance is crucial. With just one error, teams can be sent in the wrong direction due to inaccurate insights. Because of this risk, teams are often left in the dark, unsure of what insights they should leverage, or how to apply them to their existing roadmap. When data isn’t actionable, teams aren’t sure how to reduce cost of acquisition (CAC), increase lifetime value (LTV), or build retention both internally or externally. Applying actionable insights to results-driven roadmaps keeps teams on track for success
  • 9. Applying Empathy to Insights Too often, data is taken at face value. Legacy data practices often don’t account for the people behind the responses. For years it was admirable to take a data-driven approach. Now, this approach has been deemed riskier because it can cause teams to use data to inform the wrong thing and think of data as an absolute. Insights-Centric Data-Centric Data-Driven Insights-centric cultures use data to answer the WHY Data-centric cultures use data to inform & validate; not drive decision making Data-driven culture goes sideways when data are used to inform the wrong thing, as an absolute, and as business first
  • 10. Outdated Data Practices Threaten Nike One company that realized these risks of taking an outdated data-driven approach recently was Nike who reported 25 billion dollars lost in one day, along with 130 million shares exchanged in the stock market at the lowest share price since 2018. Nike’s Rocky Sales from 2023 - 2024 Sales to Wholesale Customers Sales Through Nike Direct 2024 Q4 2024 Q1 2024 Q2 2024 Q3 2023 Q4 NIKE INC. (NKE) PE RATIO -8% -6% -4 % -2% 0% 2% 4% 6% 8% 10% 12% 14% 2014 2016 2018 2020 2022 2024 0.0 25 50 75 19.6
  • 11. Using DaaS to Build Effective Data Practices Modern organizations must marry both quantitative and qualitative data to drive strategic decision making. While quantitative data provides measurable metrics, having a qualitative data practice in place can help you go deeper to understand the psychological, emotional, and social factors that will help determine why people buy and ultimately why they become brand ambassadors.
  • 12. Implementing a Qualitative Data Practice When a DaaS provider comes into your organization, you should be tapping into qualitative data to achieve these three elements for success: ● Understanding what motivates customers to buy and stay loyal ● Aligning wants, desires, and needs with acquisition and retention strategies ● Effectively and constantly reinforcing value Qualitative data practices uncover 360-Degree insights of customers and employees
  • 13. What Does an Effective Qualitative Data Practice Look Like? Qualitative data starts by better understanding the Total Addressable Market (TAM) via insights-driven cohorts and personas. ACQUISITION RETENTION TRIGGERS FACTORS DISCOVERY ASSOCIATIONS ALT. ONBOARDING PURCHASE. EXPERIENCE COMMUNITY INTENTION 1. Finding the total addressable market across personas and data-driven cohorts 4. Unearthing an execution plan to kickstart the success of this qualitative data practice 3. Defining data science best practices for converting qualitative to quantitative data 2. Defining the most useful qualitative data for both acquisition and retention sides of the funnel
  • 14. Leveraging Qualitative Data to Understand the Total Addressable Market’s Journey Qualitative data allows organizations to go beyond demographics and understand where each cohort is in their self-awareness journey. PROBLEM UNAWARE PROBLEM AWARE SOLUTION UNAWARE SOLUTION AWARE BRAND UNAWARE BRAND AWARE I have not experienced a moment in my life where I’d need what the organization offers. I have thought about this problem but am not sure the ramifications of not fixing it. I know what the ramifications are of ignoring the problem, but not sure of any solutions to help. I know the available solutions but am not sure of the benefits of each solution offered. When I think of these solutions, I think of Brand X and Brand Y. Other brands are unfamiliar. I’m aware of that Brand X offers the solution but have not made a decision about whether or not to buy yet.
  • 15. Extracting Behavioral Insights from Data-Driven Cohorts What’s important about this framework is that each cohort in TAM will take a unique journey in their behavior to move through each stage of the journey. Effective qualitative data also looks at why each of these various cohorts are taking such different paths to purchase. This requires a deeper understanding of what’s happening across each of the awareness stages. PERSONAS A B C E D F G A C F G Sees an Ad Visits the brand website Enters lead generation funnel Receives lead generation email Reads reviews Makes a purchase YouTube affiliate video Reads reviews Visits the brand website Retargeting ad Makes a purchase Instagram affiliate Served direct sales ad Makes a purchase B E D COHORT COHORT COHORT Magazine YouTube Social
  • 16. Qualitative Insights at Every Stage of the Acquisition Funnel Problem Unaware Problem Aware Problem Aware Solution Unaware Solution Unaware Solution Aware Solution Aware Brand Unaware Brand Unaware Brand Aware TRIGGERS FACTORS DISCOVERY ASSOCIATIONS ALT. Key life moments when a person becomes problem aware Emotional and logical triggers that cause a person to take action and research Platforms used to research and deep dive into finding a solution Subconscious questions about whether a brand is right for them or has what they’re looking for Brand alternatives that could provide a better solution
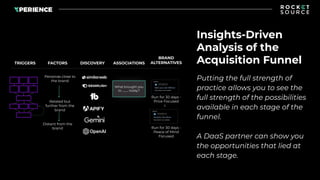
  • 17. Insights-Driven Analysis of the Acquisition Funnel Putting the full strength of practice allows you to see the full strength of the possibilities available in each stage of the funnel. A DaaS partner can show you the opportunities that lied at each stage. TRIGGERS FACTORS DISCOVERY ASSOCIATIONS BRAND ALTERNATIVES Personas close to the brand Related but further from the brand Distant from the brand What brought you to ____ today? Run for 30 days - Price Focused Run for 30 days - Peace of Mind Focused
  • 18. Qualitative Insights at Every Stage of the Retention Funnel Focus on removing any buyer remorse and encouraging buyer excitement Reinforce everything the buyer needs, both emotionally and logically, related to their purchase Continue reinforcing trust and building a foundation around the brand values Create a sense of community making every customer feel they belong Ask the customer to self-identify how they value the brand Problem Unaware Problem Aware Problem Aware Solution Unaware Solution Unaware Solution Aware Solution Aware Brand Unaware Brand Unaware Brand Aware RETENTION COMMUNITY EXPERIENCE ONBOARDING PURCHASE
  • 19. Insights-Driven Analysis of the Retention Funnel DaaS providers integrate insights-driven ideas at every single stage of the journey. Through the findings of multiple data loops put into strategic motion, you can define the best qualitative data practices, quantify the qualitative insights, and tap into the insights results faster. Pay Success Page Completed Not Completed Reminder Activation Welcome Email Sequence Acknowledge Your Best Content Invitation Soft Sell Surveys Forums In-Person Events Complete Profile
  • 20. Modern Data Looping From DaaS Providers Leads to Faster Time to Insights At a high level, there are five steps we walk through when designing a modern data loop and analyzing the results. Choose an appropriate conversion method Select data source & understand context Document and iterate the process Share and communicate the insightful analysis Validate conversion output 1 2 4 5 3
  • 21. Selecting Data Sources and Conversion Methodologies Without assessing your data limitations, you’ll have a much harder time deriving accurate insights out of what’s collected. A modern DaaS provider is able to come in, analyze your full data loop, and pinpoint those limitations allowing for cleaner and more contextually clearer analysis. With that understanding and context, teams can then move to step two — leveraging a variety of conversion methodologies and platforms to convert and interpret the data points. Conversion Methods Binning or Discretization Categorization Quantiles Thresholding Z-Score Binning Ranking Principal Component Analysis Dummy Variables Heatmap/Color Coding Clustering Decision Trees Fuzzy Logic Domain-Specific Rules Visualization Based Methods Trends by Images Ranking and Ordering Arrange in Sequence Binary Conversion 0s and 1s Clustering and Machine Learning Grouping Patterns Fuzzy and Domain-Specific Methods Unique Criteria Binning and Categorization Grouping into Bins
  • 22. Validating the Conversion Output Preserve Variability Ensure each category reflects the underlying variability of the findings. Avoid Information Loss Minimize the loss of important information during the conversion process. Bias and Fairness Ensure no new bias or unfairness gets introduced into the equation. Transparency Understand the conversion methods and potential biases or limitations. Check Consistency Ensure qualitative data represents quantitative data across the funnel. Validate Against Objectives Verify the data meets initial objectives and supports the intended analysis.
  • 23. Communicating Insightful Analysis DaaS providers add color to the black and white picture of plain data by visualizing and communicating the crucial findings. Effective communication is a huge challenge among organizations gathering data from a variety of sources and collection methodologies and combining them to deliver the right information to the right people in the last mile of analysis.
  • 24. Creating a Clear Roadmap From a Data as a Service Analysis Until now, we’ve covered using the modern bow tie funnel and data looping process to extract and understand critical insights. But Data as a Service partners should not stop here. True partnerships equip teams with a clear roadmap for how to take those findings and apply across the 3 Ps of an organization — people, processes, and platforms. Process Platform People
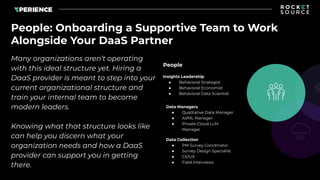
  • 25. People: Onboarding a Supportive Team to Work Alongside Your DaaS Partner Many organizations aren’t operating with this ideal structure yet. Hiring a DaaS provider is meant to step into your current organizational structure and train your internal team to become modern leaders. Knowing what that structure looks like can help you discern what your organization needs and how a DaaS provider can support you in getting there. People Insights Leadership ● Behavioral Strategist ● Behavioral Economist ● Behavioral Data Scientist Data Managers ● Qualitative Data Manager ● AI/ML Manager ● Private Cloud LLM Manager Data Collection ● PM Survey Coordinator ● Survey Design Specialist ● CX/UX ● Field Interviews
  • 26. The Importance of Framework Alignment To drive organizational buy-in, it’s crucial that all of the key players are aligned on every element of the DaaS partnership. This is what we call framework alignment. Awareness Stage Customer Journey Funnel Behavioral Data Data Maturity Model 1 2 3 4
  • 27. Processes: Intelligently Adding Generative AI Into Your Data Practices Rather than relying on AI to do all of the analysis, we believe in methodically handing over parts of the data sequence for analysis, and then injecting a human analysis throughout the process. Stage 1: Gathering and Discovery Stage 2: Define Strategy and Scope Stage 3: Create Low-Fi Wireframe Stage 4: Gap Analysis Stage 5: Build Reports Stage 6: Quality Assurance Stage 7: Formal Release and Training Business questions are evaluated to determine whether the answers will come in the form of reports or deeper analysis, and whether the questions can be answered with existing data. We work together to find the metrics of success, stakeholders that will use the report, and ultimately the insights that this dashboard report should deliver to enable business growth We propose a dashboard to visualize the end state of the report to assure the alignment of the stakeholder and engineering. Additional resources can be recommended at this stage. The wireframe and data model is handed over to BI/ENG, at which point they will identify any gaps. If no gaps, engineering can proceed to develop flat tables to support cards within the report. Once the data reports are available, the reports can be built in a data visualization platform. Once the reports are built, all metrics and numbers should be compared to the raw data from the original source to ensure accuracy. This includes checking segments of data over different spans of time. After the reports have been validated, trainings can be released to the stakeholders.
  • 28. Taking External Forces Into Account Many external forces are not considered when developing processes, but are always influential, such as key trends, industry forces, macroeconomic forces, and market forces all impact data operations at large. Each of these elements must fit into the equation at some point of your analysis in order to get a more accurate view of what’s happening and what’s possible for your organization. https://amzn.to/3ULWcVn Foresight Regulatory Trends Technology Trends Societal and Cultural Trends Socioeconomic Trends Competitive Analysis Market Analysis Macroeconomics Suppliers and Value Chain Actors Stakeholders Competitors (Incumbents) New Entrants (Insurgents) Substitute Products and Services Capital Markets Global Market Conditions Economic Infrastructure Commodities and Other Resources Market Segments Needs and Demands Market Issues Switching Costs Revenue Attractiveness Key Trends Macro Trends Industry Trends Market Forces
  • 29. Platforms for Strong Data Operations With a DaaS Partner The proliferation of new and emerging platforms is enough to make even the savviest of leader’s heads spin. It’s hard to make sense of all these available tools. There’s no possible way every organization could use each of these tools. Nor is it possible that every tool is perfectly suited for every business. That’s why, at RocketSource, we remain staunchly tech agnostic. Look at all of those platforms - just for marketing!
  • 30. Leaning Into Emerging Platforms Bringing a DaaS provider into the equation allows you to adopt AI platforms in the right way, alleviating complexity and increasing business value. Don’t go straight for the shiny new AI platforms but instead take a methodical approach to decide which types of AI tools can be infused into processes to speed time to insights without eliminating the human touch. Descriptive Diagnostic Predictive Prescriptive Cognitive Without AI Business Value Complexity With AI
  • 31. Extracting Business Value From a Data as a Service Partnership To start identifying a clear roadmap rooted in data and insights, you need to first understand the data maturity of your organization. Trigger Reactive Proactive What/Where When/How Why Will Automation: Activities and systems are automated invisibly to improve performance to reduce human error and improve reliability. We want to evaluate performance within our marketing mix, sales ops, and operations. We want to evaluate a change in performance over time and apparent correlations. We want to understand the external and internal key drivers of consumer behavior in the decisions to buy and stay. We want to product how emerging trends will impact business financial health if they continue. We want to understand how micro events within our organization and workforce can be optimized. Metrics are pulled manually either within a single channel or into spreadsheets for analysis. Additional charts and decks are built to illustrate metrics in motion to relevant teams. One-off studies or activities are run to answer why, usually only following an abnormal spike, crisis, or issue. Mean-based data is pulled together from various sources to inform action for a fixed window of time. Ad hoc engagement data is captured and observed to inform the integration of business units to drive growth and reduce costs. Data points are joined into an automated system to report for specific analyses. Dashboards are standardized to inform teams of their historical performance in the organization. Insights are democratized at a regular cadence to evaluate product-market fit, anticipating market forces. Several distance measures and data arrays are measured with ML to proact known trends and optimize performance. Automated systems leveraging AI/ML ensure alignment in people, processes and platforms to efficiently execute the business model. HINDSIGHT INSIGHT FORESIGHT
  • 32. Go-to-Market Strategies for Customer Acquisition and Retention As an organization, the desired action is often to move potential buyers from problem unaware to solution aware, acquiring new customers as cost effectively as possible. With data and insights, your team can pinpoint where customers are churning out of your bow tie funnel, which we outlined above, and how you can course correct to acquire and retain more of those people before they churn. Would exchange their data for better brand experiences. Expect an AI-driven experience that is personal Of respondents insist on keeping their data private (was 61% prior to ChatGPT becoming prolific). Expect an AI-driven experience that is relevant Expect an AI-driven experience that is environmentally friendly
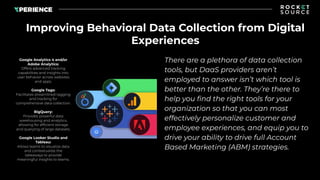
  • 33. Improving Behavioral Data Collection from Digital Experiences There are a plethora of data collection tools, but DaaS providers aren’t employed to answer isn’t which tool is better than the other. They’re there to help you find the right tools for your organization so that you can most effectively personalize customer and employee experiences, and equip you to drive your ability to drive full Account Based Marketing (ABM) strategies. Google Analytics 4 and/or Adobe Analytics: Offers advanced tracking capabilities and insights into user behavior across websites and apps. Google Tags: Facilitates streamlined tagging and tracking for comprehensive data collection. BigQuery: Provides powerful data warehousing and analytics, allowing for efficient storage and querying of large datasets. Google Looker Studio and Tableau: Allows teams to visualize data and contextualize the takeaways to provide meaningful insights to teams.
  • 34. Tapping Into Data as a Service for Account Based Marketing If you don’t have a solid data practice, you can’t execute on the final output. Until recently, leveraging data was somewhat labor intensive. Proper data collection processes that tap into behavioral data and bring teams closer to deeper insights can help bring in higher quality leads, build retention, and close more deals. Find Top Opportunities Understand Your Cohorts Personalize Engagement Organizational Collaboration Defined Behavioral Data Tracking
  • 35. Telling Data Stories through Data Visualization Effective data storytelling is essential for ensuring stakeholders understand and implement insights. Acquisition Retention Trending Marketing Performance Average CPA $62 180 Day Persistency 72% Retention 92% % of Budget 26.2% Net Membership 151,015 Total Spend $395,015 Cancellations 22% Ad Cost Performance Net Memberships Ad Cost Performance Swim Lane Performance Organic Paid Spend Lead Gen Sales Group Other Total Total Ads Cost Daily Net Memberships New Members New Leads New Members New Members New Members Net Members Net Members Net Members Net Members Net Members Net Members Retention Retention Retention Retention Retention Attrition Attrition Attrition Attrition Attrition Attrition Retention Net Members 1,980 6,151 4,180 3,978 852 17,141 47,132 325 1,250 5,151 21,155 19,251 $369 6.5:1 $82 CPA Budget Spend to Date CPA Budget Spend to Date CPA Budget Spend to Date CPA Budget Spend to Date CPA Budget Spend to Date CPA Budget Spend to Date $32,151 $12,515 $25 $91,150 $52,981 $55 $40,981 $11,901 $124 $7,915 $3500 $159 $18,910 $10,015 $85.1 $191,107 $90,912 Cancelled Members Retention Attrition Cancelled Members Retention Attrition Cancelled Members Saved Members Retention Attrition Retention Attrition Retention Attrition Retention 563 132 654 422 10.2% Cancelled Members 696 Cancelled Members 2,561 Total Cancelled 51 Saved Members 94 Saved Members 22 73 Saved Members 94 Saved Members 251 Total Saved 9.8% 5.2% 6.4% 9.8% 12.5% 89.8% 92.1% 95.8% 92.6% 90.2% 87.5% Paid Spend 40% Lead Generation 20% Organic 40% CPA ROAS Budget 12% 33% 42% 51% 72% 71% 78% 82% 83% 83% 189 Days 253 Days 210 Days 320 Days Target 200 Days Paid Spend Lead Generation Sales Groups Organic TCV:CPA Ratio Trend Average TCV 23.4% 6.3% Existing Memberships New Members Returning Memberships Renewals Call to Cancel Auto Cancel
  • 36. Acquisition Retention Trending Marketing Performance Average CPA $62 180 Day Persistency 72% Retention 92% % of Budget 26.2% Net Membership 151,015 Total Spend $395,015 Cancellations 22% Ad Cost Performance Net Memberships Ad Cost Performance Swim Lane Performance Organic Paid Spend Lead Gen Sales Group Other Total Total Ads Cost Daily Net Memberships New Members New Leads New Members New Members New Members Net Members Net Members Net Members Net Members Net Members Net Members Retention Retention Retention Retention Retention Attrition Attrition Attrition Attrition Attrition Attrition Retention Net Members 1,980 6,151 4,180 3,978 852 17,141 47,132 325 1,250 5,151 21,155 19,251 $369 6.5:1 $82 CPA Budget Spend to Date CPA Budget Spend to Date CPA Budget Spend to Date CPA Budget Spend to Date CPA Budget Spend to Date CPA Budget Spend to Date $32,151 $12,515 $25 $91,150 $52,981 $55 $40,981 $11,901 $124 $7,915 $3500 $159 $18,910 $10,015 $85.1 $191,107 $90,912 Cancelled Members Retention Attrition Cancelled Members Retention Attrition Cancelled Members Saved Members Retention Attrition Retention Attrition Retention Attrition Retention 563 132 654 422 10.2% Cancelled Members 696 Cancelled Members 2,561 Total Cancelled 51 Saved Members 94 Saved Members 22 73 Saved Members 94 Saved Members 251 Total Saved 9.8% 5.2% 6.4% 9.8% 12.5% 89.8% 92.1% 95.8% 92.6% 90.2% 87.5% Paid Spend 40% Lead Generation 20% Organic 40% CPA ROAS Budget 12% 33% 42% 51% 72% 71% 78% 82% 83% 83% 189 Days 253 Days 210 Days 320 Days Target 200 Days Paid Spend Lead Generation Sales Groups Organic TCV:CPA Ratio Trend Average TCV 23.4% 6.3% Existing Memberships New Members Returning Memberships Renewals Call to Cancel Auto Cancel
  • 37. Unlocking the Full Potential of Data as a Service for Enterprise Learn more at RocketSource.com/Blog/Data-as-a-Service-Enterprise