SlideShare a Scribd company logo
Report Card on American Education 20th Edition
Report Card on American Education:
Ranking State K-12 Performance, Progress and Reform
© 2015 American Legislative Exchange Council
All rights reserved. Except as permitted under the United
States Copyright Act of 1976, no part of this publication may
be reproduced or distributed in any form or by any means
or stored in a database or retrieval system without the prior
permission of the publisher.
Published by:
American Legislative Exchange Council
2900 Crystal Drive
Suite 600
Arlington, VA 22202
Phone: (202) 725-7764
Fax: (703) 373-0927
www.alec.org
For more information, contact
the ALEC Public Affairs office.
Dr. Matthew Ladner
LindsayRussell,director,TaskForceonEducationandWorkforce
Development
Daniel Turner, legislative analyst, Task Force on Education and
Workforce Development
Report Card on American Education: K-12 Performance, Progress and Reform is published by the American Legislative Exchange
Council (ALEC) as part of its mission to promote limited government, free markets and federalism. ALEC is the nation’s largest
nonpartisan, voluntary membership organization of state legislators, industry representatives, research analysts and policy
think tanks. ALEC is governed by a board of directors of state lawmakers, which is advised by the Private Enterprise Advisory
Council representing business leaders and entrepreneurs.
The American Legislative Exchange Council is a 501(c)(3) nonprofit, public policy organization. Contributions are tax deductible.
Table of Contents
About the Author	 v
Acknowledgements	 vi
Foreword: Scott Walker, Governor of Wisconsin	 vii
CHAPTER 1 : Education Reform: A Year in Review ........................................................................................1
Silver State Lawmakers Strike K-12 Reform Gold	 2
Vergara vs. California Decision: Potential Watershed	 4
Georgia and Texas Become the 16th and 17th States to Adopt “A” through “F” School Letter Grades	 4
Multiple States Introduce Education Savings Account Legislation	 5
Nevada, Florida, Mississippi and Tennessee Join Arizona in the ESA Family	 7
States and Districts Expand Weighted Student Funding Systems 	 8
States Continue to Improve Digital Learning Opportunities	 9
Lawmakers Introduce Multiple Scholarship Tax Credit Bills	 10
School Voucher Programs Continue to Advance	 11
After the 2015 Sessions a Majority of States Have a Private Choice Program	 13
State Tests Align More Closely to NAEP in 20 States, Lowered in Eight	 13
Charter School Parents Win Showdown with New York Mayor Bill de Blasio	 14
Charter Schools Continue Nationwide Advance	 16
Reform is Rolling But Has Much Farther to Go	 19
CHAPTER 2: Appropriately Equipping Our Students Today for a Prosperous Tomorrow...............................21
NAEP Reading Scores as a Predictor of College Success	 25
State-Level Pipelines: Linking Eighth- and 12th-Grade NAEP Scores by Cohort	 27
Sending Students to College Without Necessary Reading Skills	 32
Detailed Data from Arizona: What Happens When Unprepared Students Attend College	 34
Conclusion: Light at the End of the Tunnel or Oncoming Train?	 35
CHAPTER 3: Student Performance and State Education Policy Grades..........................................................37
Ranking States on the Performance of General Education Low-Income Students 	 38
Grading Education Policies	 39
Overall Education Policy Grade 	 39
Policy Categories	 39
Academic Standards	 39
Charter Schools	 39
Homeschooling Regulation Burden Level	 40
Private School Choice 	 40
Teacher Quality Policies	 40
Digital Learning	 40
Policy Grade Methodology	 40
Additional Information	 40
STATE SNAPSHOTS.......................................................................................................................................43
CHAPTER 4: Cost Versus Outcomes – The Importance of Educational Efficiency...........................................95
The Example of Wyoming	 97
Educational Efficiency	 99
Mismanaged Resources	 103
Putting Students Above Money	 103
APPENDICES.................................................................................................................................................106
Appendix A: Change in NAEP Scores for All Students	 106
Appendix B: Education Policy Grade Components	 108
ABOUT THE AMERICAN LEGISLATIVE EXCHANGE COUNCIL......................................................................110
www.alec.org v
DR. MATTHEW LADNER
Dr. Matthew Ladner is the Senior Advisor of Policy and Research for the Foundation for Excellence
in Education. He previously served as Vice President of Research at the Goldwater Institute. Prior
to joining Goldwater, Ladner was director of state projects at the Alliance for School Choice. Ladner
has written numerous studies on school choice, charter schools and special education reform and
coauthored Report Card on American Education: Ranking State K-12 Performance, Progress and Reform
for the American Legislative Exchange Council. Ladner has testified before Congress, the United States
Commission of Civil Rights and numerous state legislative committees. Ladner is a graduate of the
University of Texas at Austin and received both a Masters and a Ph.D. in Political Science from the
University of Houston. Ladner is a Senior Fellow with the Foundation for Educational Choice and the
Goldwater Institute. Dr. Ladner lives in Phoenix, Arizona.
About the Author
vi Report Card on American Education
The author would like to thank the following for making this Report Card on American Education possible:
First, the Allegheny Foundation and the Gleason Family Foundation for their generous support for the
creation and promotion of this book.
The author would like to specifically thank David J. Myslinki at Achieve and Lindsay Russell and Daniel
Turner of the ALEC Task Force on Education for their tireless work and guidance in the production of
this publication.
We also wish to thank Lisa B. Nelson, Bartlett Cleland, Bill Meierling, Molly Drenkard, Christine Phipps,
Shana Sally and the professional staff of ALEC for all aspects of this publication.
Acknowledgments
www.alec.org vii
The United States of America is at a crit-
ical moment in its history. In the 21st
century our nation faces economic, po-
litical, and cultural challenges across the globe.
To maintain our competitive advantages in inno-
vative technology, advanced agriculture, manu-
facturing, and scientific research we need every
student to have a world class education and leave
school ready compete in the global economy.
In Wisconsin we have responded to this chal-
lenge through a number of education reforms.
We made systematic changes to education gov-
ernance and finance through Act 10, to free
school districts from unfair agreements with
unions over benefits and wages. In the process
we saved taxpayers millions of dollars.
In addition to the financial benefits of Act 10, we
also created opportunities for long overdue ed-
ucational reforms. School districts can now hire
and fire teachers based upon merit, not seniority.
Districts have instituted performance based pay
programs and experimented with new schedul-
ing formats. Our reforms moved education from
a bureaucratic, top down approach to a local-
ly based system that gives communities control
over their schools. This has given school districts
the independence to decide how to best organize
and manage their schools based on what their
students need and what gets results.
We have also increased options for students
who want to attend schools outside the tradi-
tional public school system. Wisconsin was the
first state to create a modern school choice pro-
gram in Milwaukee in 1989. Since then, Wiscon-
sin’s parental choice program has grown signifi-
cantly from its beginnings as a limited program in
Milwaukee to a statewide program that is grow-
ing every year. Today, more than 27,000 students
are attending approximately 150 participating
schools, exercising choices these parents didn’t
have before.
With an eye toward providing even more options
for parents and students, we have open enroll-
ment policies, charter schools, and tax deduc-
tions for private school tuition. We are deter-
mined to ensure that a child’s education is not
limited due to their zip code but to what fits best
with that student’s individual educational needs
and skills.
The University of Wisconsin’s Flexible Options
program is our innovative approach to high-
er education in the 21st Century. Now students
can earn degrees based upon previous work,
Foreword
by Scott Walker, Governor of Wisconsin
viii Report Card on American Education
education or life experiences in an individualized,
competency based program. This is designed
to give students an alternative to the tradition-
al classroom model that is difficult and time con-
suming for working or non-traditional students.
It is vital that we give our citizens the ability to
be lifelong learners in the constantly changing na-
tional and global economy.
The opponents of reform often claim that any
changes will lead to dire consequences for schools
and student outcomes. In Wisconsin we have shat-
tered that myth.
Since we implemented our reforms, school dis-
tricts have saved millions of taxpayer dollars, used
new innovative teaching methods and instituted
merit pay to reward successful teachers. Our stu-
dents reaped the benefits; high school gradua-
tion rates are up, third grade reading scores are
up, and our students are ranked 2nd in the nation
for ACT scores.
The American Legislative Exchange Council’s Re-
port Card on American Education is a vital tool
that helps states measure their education reform
progress and learn from other states’ success-
es and failures. Often, education reform efforts
are met with vigorous public debate and can face
powerful opponents. Too often these opponents
are the very groups that benefit from the status
quo. We must not be discouraged by these spe-
cial interests. Instead, we must continue to de-
mand all students have access to a high quality
education that prepares them for higher learning,
service in the military, and the workforce. In Wis-
consin, we have shown that reform is possible.
Sincerely,
Scott Walker
Governor of Wisconsin
FOREWORD
1CHAPTER
Education Reform:
A Year in Review
2 Report Card on American Education
EDUCATION REFORM MAKES SIGNIFICANT
ADVANCES IN 2014-15
Since the publication of the 19th edition of the
ALEC Report Card on American Education, law-
makers have been active around the country in
passing K-12 reforms. Laws that give more stu-
dents public and private schooling options have
advanced, and lawmakers have improved pub-
lic school transparency. For instance, the United
States Department of Education broke out Amer-
ican scores on the Programme for Internation-
al Student Assessment (PISA) reading exam by
ethnicity. The Department study found levels of
reading achievement for American Black and His-
panic students similar to countries such as Tur-
key, Chile and Mexico.1
These nations spend a
fraction of the American spending per pupil and
have far greater absolute poverty problems. De-
spite continuing policy progress, many American
children still significantly underperform in com-
parison to their global peers.
When addressing reform strategies to meet the
individual state needs, policymakers should in-
vestigate the following best practices already ex-
ecuted in a number of states and also view the ex-
tensive information produced by legislators from
every state and housed at the American Legisla-
tive Exchange Council (ALEC).
SILVER STATE LAWMAKERS STRIKE K-12
REFORM GOLD
Nevada has more than its share of education chal-
lenges. Long among the fastest growing states on
a percentage basis, overcrowding remains an en-
demic problem in its public schools. A 2014 New
York Times piece on Clark County (Las Vegas area)
noted that the district had the equivalent of 40
elementary schools of students housed in por-
table buildings. “I could build 23 elementary
schools today, and they would open up full and
overcrowded,” said Clark County Superintendent
of Schools Pat Skorkowsky at a neighboring Hen-
derson County Chamber of Commerce breakfast,
according to the paper.2
Since schools are burst-
ing at the seams due to enrollment growth and
are failing to reach average levels of academ-
ic achievement, Nevada lawmakers face both gi-
gantic quantity and substantial quality problems.
In 2015, they took dramatic action to address
both problems simultaneously when Nevada
Governor Brian Sandoval signed multiple K-12 re-
form bills into law. Collectively, these new laws
constitute a comprehensive approach, including
broad parental choice and district reform efforts.
Most notably, Nevada created the nation’s stron-
gest parental choice program to date in terms of
both student eligibility and in the allowed uses
of funds. In addition, lawmakers took action to
end social promotion and increase charter school
offerings.
Signed into law June 2, 2015, Senate Bill 302, cre-
ated Nevada’s Education Savings Account (ESA)
program in which participating parents manage
a state-funded account for each student with
multiple but restricted uses under a system of
state oversight. Sponsored by state Senator Scott
Hammond and signed by Sandoval, SB 302 makes
all Nevada students with previous public school
attendance eligible for an ESA.
The Nevada Office of the State Treasurer will ad-
minister the program. Students with disabilities
and those from families with incomes at or below
Education Reform:
A Year in Review
www.alec.org 3
EDUCATION REFORM: A YEAR IN REVIEW
185 percent of the federal poverty level will re-
ceive an amount equal to 100 percent of the
statewide average basic support per pupil—cur-
rently around $5,700. Other students will receive
a level of funding equal to 90 percent of this fig-
ure—currently around $5,100.
	
Parents opting into the program can use funds for:
•	 Tuition and fees at an approved private
school
•	 Textbooks required for a student at an
approved private school
•	 Tutoring or other services provided
by a tutor or tutoring facility that is a
participating entity
•	 Tuition and fees for a distance-learning
program
•	 Fees for any national norm-referenced
achievement examination, advanced
placement or similar examination, or
standardized examination required for
admission to college or university
•	 Fees for any special instruction or special
services if the child is a pupil with a
disability
•	 Fees and tuition for a college or university
in Nevada if that student utilizes those
expenses for dual credit
•	 Textbooks for a college or university in
Nevada, also if that student utilizes those
expenses for dual credit
•	 Transportation to school up to $750.00
•	 Purchases of curriculum or any
supplemental materials
•	 Management fees
The state treasurer will oversee the program and
is able to deduct up to 3 percent from the ap-
propriated ESA funds to cover the costs of ad-
ministration. The treasurer has the authority to
remove either a vendor or a student from the
program for failure to comply with the legal re-
quirements of the program and refer cases to the
state attorney general for criminal prosecution.
Participating students must complete a nation-
ally norm-referenced test annually in mathemat-
ics and English; and report the results to the Ne-
vada Department of Education. The department
will aggregate the data according to grade level,
gender, race and family income level. After three
years, it will report ESA student graduation rates.3
Nevada’s program sets unprecedented education
policy. No existing private choice program can
match the state’s combination of broad student
eligibility and multiple educational uses. As with
most all-choice programs, the new Nevada ESA
program remains a work in progress. Future areas
of improvement could be the inclusion of funding
weights for children with disabilities and English
language learners to mirror the public school for-
mula. Currently, the legislation allows the rolling
over of unused funds from year to year and the
earning of college credit through dual enrollment
and advanced placement.
The state’s bold new choice law, however, was
not the only big advancement, as lawmakers
passed other substantial reforms. Nevada’s Sen-
ate Bill 391 -Read by Three Act will create pro-
grams to aggressively address early childhood il-
literacy through early identification and parental
notification of reading deficiencies, intensive in-
terventions for students and retention at the end
of third grade, as a last resort.
Nevada’s SB 491 appropriated $10 million for
the creation and operation of high-quality char-
ter schools to serve students who live in pover-
ty. Assembly Bill 448 created an Achievement
School District to identify low-performing dis-
trict schools and convert them into public char-
ter schools.
Assembly Bill 483 requires school districts to set
aside funding for additional performance pay for
highly effective teachers and administrators. The
law prioritizes student achievement and is not
subject to change through collective bargaining.
Senate Bill 92 took the further step of requiring
all layoff decisions for teachers and administra-
tors be guided by the statewide evaluation sys-
tem, ending the pernicious practice of “last in,
first out,” whereby teachers get laid off accord-
ing to seniority rather effectiveness.4
In addition to these crucial public school reforms,
Nevada lawmakers created two private choice
programs. Assembly Bill 165 created a corporate
4 Report Card on American Education
CHAPTER ONE
scholarship tax credit program for students from
low and middle-income households. The pro-
gram has an initial $5 million cap on credits with
a provision to increase the cap annually.
The Nevada Constitution guarantees public edu-
cation, so it will always be available. Due to the
constant pressure of current and projected en-
rollment growth, the Nevada public school sys-
tem needs all the help it can get. These legislative
efforts ensure Nevada schools are moving in the
right direction. The consistent experience of pre-
vious choice programs demonstrates that, there
will not be a mad exodus out of the Nevada pub-
lic school system, even with the ESA program’s
broad eligibility. Instead, the program will reduce
the strain on the public school system due to en-
rollment growth and create a crucial exit option
that will provide positive motivation for the pub-
lic schools to improve. Nevada lawmakers have
made history by initiating an audacious experi-
ment in liberty that gives parents the ability to
customize the education of their children. Big
problems require bold leadership.
VERGARA VS. CALIFORNIA DECISION:
POTENTIAL WATERSHED
In 2012, nine California students filed suit against
the State of California claiming that state poli-
cies—such as granting tenure after 18 months
on the job, extremely complex appeals process-
es that make it nearly impossible to terminate an
ineffective teacher and “last in, first out” —vio-
lated their opportunity to obtain a quality educa-
tion. On June 11, 2014, the Superior Court of the
State of California County of Los Angeles ruled in
favor of the students, saying:
Plaintiffs claim that the Challenged Statutes
result in grossly ineffective teachers obtain-
ing and retaining permanent employment,
and that these teachers are disproportion-
ately situated in schools serving predomi-
nantly low-income and minority students.
Plaintiffs’ equal protection claims assert that
the Challenged Statutes violate their funda-
mental rights to equality of education by ad-
versely affecting the quality of the education
they are afforded by the state.
This court is asked to directly assess how the
Challenged Statutes affect the educational
experience. It must decide whether the Chal-
lenged Statutes cause the potential and/or
unreasonable exposure of grossly ineffective
teachers to all California students in general
and to minority and/or low-income students
in particular, in violation of the equal protec-
tion clause of the California Constitution.5
This Court finds that the Plaintiffs have met
their burden of proof on all issues presented.
This landmark decision amounted to a political
earthquake. Despite having the full resources of
the State of California and the California Teach-
ers Association (CTA), the defendants proved in-
capable of defending the indefensible. The rul-
ing notes: “Evidence has been elicited in this trail
of the specific effect of the grossly ineffective
teachers on students. The evidence is compel-
ling. Indeed, it shocks the conscience.”
The ruling resulted in an inevitable appeal that
will take years to resolve in the California court
system. In the meantime, other groups have filed
similar lawsuits in other states. The decision re-
veals just how deeply discredited practices like
unconditional tenure and “last in, first out” have
become. Both sides put their best case forward
on these issues, and the court used both sides’
testimonies to reach their ruling.
GEORGIA AND TEXAS BECOME THE 16TH AND
17TH STATES TO ADOPT “A” THROUGH “F”
SCHOOL LETTER GRADES
Georgia lawmakers made Georgia the latest state
to pass transparent A through F letter grades to
describe public school academic performance.
The use of letter grades in state accountability
systems began in Florida in 1999, followed by Ari-
zona, Indiana, Louisiana, New Mexico, Oklahoma,
Utah, Alabama, Mississippi, North Carolina, Ohio,
South Carolina, Arkansas, Maine, West Virgin-
ia—and most recently the Peach State—between
1999 and 2015.
The Texas legislature also adopted campus-lev-
el A through F school grades in 2015, although it
www.alec.org 5
EDUCATION REFORM: A YEAR IN REVIEW
uses a formula that includes a number of non-ac-
ademic grading factors. It also allows districts to
choose some of their own grading criteria. This
means that the grading system will not be com-
parable across districts. The previous system of
campus labels, however, amounted to a “pass/
fail” with 91 percent of schools receiving a “met
standard” label in 2013 according to state crite-
ria. Simultaneously only 28 percent to 41 percent
of Texas students scored “proficient or better”
on the 2013 fourth and eighth-grade Nation-
al Assessment of Educational Progress (NAEP)
math and reading exams. Texas still has room for
improvement in the area of test-based school
accountability.
School grading policies suffered setbacks in plac-
es such as New York City, where Mayor Bill de Bla-
sio ended the use of letter grades. Lawmakers in
Virginia also chose to cancel the adoption of the
policy in the face of opposition from Governor
Terry McAuliffe. The Virginia law passed in 2013,
but state officials never actually implement-
ed the law. School grading proponents chose to
support the Virginia repeal rather than see the
grades enacted without fidelity to the principles
of the policy.
MULTIPLE STATES INTRODUCE EDUCATION
SAVINGS ACCOUNT LEGISLATION
Arizona became the first state to pass a new
variety of parental choice program in 2011
with the passage of the Empowerment Schol-
arship Account Program, which introduced ed-
ucation savings accounts. This model has sev-
eral advantages over the traditional school
voucher mechanism. First, it has proved more
robust to court challenge in Arizona than pre-
vious voucher programs. It survived legal chal-
lenge, whereas two previous voucher programs
were ruled unconstitutional under Arizona’s
Blaine Amendment. It is possible that a pro-
gram following this model might have a similar
FIGURE 1 | STATES WITH “A” THROUGHT “F” SCHOOL LETTER GRADE LAWS, 2015
STATES WITH “A” THROUGH “F” SCHOOL LETTER GRADE LAWS
STATES WITHOUT “A” THROUGH “F” SCHOOL LETTER GRADE LAWS
6 Report Card on American Education
CHAPTER ONE
advantage under other state constitutions.
The ESA model also provides more flexibili-
ty to parents than a voucher does. Parents use
vouchers to choose among schools, and vouch-
ers broaden their possible choices to include par-
ticipating private schools. ESA programs give par-
ents choices not just among schools, but also
among education methods and programs. Par-
ents can choose to enroll students in a school full-
time, but they also have other options, including
hiring private tutors and therapists, online edu-
cation programs and even purchasing individual
classes at schools or community colleges.
The ESA model also allows parents to save mon-
ey for future higher education expenses. This cre-
ates an incentive for parents to carefully choose
providers not only according to perceived quality
but also cost. Providers thereby are motivated to
provide high-quality services at affordable pric-
es—the exact opposite of the trend seen in the
district system in which spending surges and out-
comes largely stagnate.
Arizona lawmakers originally crafted their schol-
arship legislation to serve only students with dis-
abilities. Subsequently, however, lawmakers have
made additional students eligible—children in
public schools in districts with D or F grades, stu-
dents who have been through the foster care sys-
tem and the dependents or survivors of parents
in the military. In 2014, Arizona Governor Jan
Brewer signed legislation making the siblings of
already eligible students eligible for the Empow-
erment Scholarship Accounts. This change made
it possible, for instance, for a family with two chil-
dren—one of whom was eligible for the program
with an Individual Education Plan—to educate
both children in the same fashion or send both to
the same school.
In 2015, Arizona State Senator Carlyle Begay
sponsored legislation making children residing
FIGURE 2 | STATES INTRODUCING EDUCATION SAVINGS ACCOUNT LEGISLATION IN 2015
STATES THAT INTRODUCED EDUCATION SAVINGS ACCOUNT LEGISLATION
STATES THAT DID NOT INTRODUCE EDUCATION SAVINGS ACCOUNT LEGISLATION
www.alec.org 7
EDUCATION REFORM: A YEAR IN REVIEW
on Arizona American Indian reservations eligible
for the Empowerment Scholarship Accounts Pro-
gram. Arizona has 55,000 American Indian chil-
dren, and NAEP shows that their levels of academ-
ic achievement rank consistently below those of
their peers in other states and among the lowest
for any student subgroup in the nation.
Following the adoption of the Arizona program in
2011, ALEC adopted model ESA policy that was lat-
er updated to reflect significant changes in 2015.
NEVADA, FLORIDA, MISSISSIPPI AND
TENNESSEE JOIN ARIZONA IN THE ESA FAMILY
Lawmakers in a number of other states began to
introduce account-based choice programs in 2012.
In 2014, Florida lawmakers succeeded in passing
the Personal Learning Savings Accounts (PLSA)
program—the second of its kind in the nation.
The PLSA program initially focused on children
with relatively severe disabilities and was launched
in the fall of 2014. The innovative Florida program
is administered by nonprofit groups with state
oversight. (The Arizona Department of Education
and Office of the Treasury administer the original
program). Florida lawmakers initially appropriated
$18 million in 2014 for the PLSA program but in-
creased the appropriation to $53 million in 2015.
In Mississippi, the fight for ESAs for special-needs
children began in 2014, but problems have exist-
ed for decades. Jackson Clarion Ledger noted Feb.
2, 2014 that the graduation rate for special needs
students is the worst in the nation. Despite billions
in federal funding since the late 1990s, teachers
are still ill-trained, and graduation rates for stu-
dents with special needs have raised a mere 6 per-
cent since then. In 1997, the same paper noted a
graduation rate of just 17 percent for special needs
students.6
Mississippi lawmakers and parents fought hard
FIGURE 3 | STATES WITH EDUCATION SAVINGS ACCOUNTS PROGRAMS, 2015
STATES WITH EDUCATION SAVINGS ACCOUNTS PROGRAMS
STATES WITHOUT EDUCATION SAVINGS ACCOUNTS PROGRAMS
8 Report Card on American Education
CHAPTER ONE
for an account-based choice program, very near-
ly passing it in 2014 and finally achieving success
the following year. Governor Phil Bryant signed
the measure into law in 2015, making Mississippi
the third state to enact an account-based choice
program.
ChoiceadvocatesinTennesseedidnothavetowait
long for the fourth program, as lawmakers passed,
and Governor William Haslam signed, ESA legisla-
tion for students with special needs just weeks af-
ter Mississippi. Montana legislators passed an ESA
bill as well, but the measure was vetoed by Gover-
nor Stephen Bullock.
STATES AND DISTRICTS EXPAND WEIGHTED
STUDENT FUNDING SYSTEMS
School funding methods can give schools a strong
incentive to respond positively to competition. In-
diana, for example, until recently had a district
funding formula that included “ghost students.”
Through this method, the state continued to al-
locate funds to districts for students the schools
were no longer educating.7
Lawmakers wisely re-
placed this formula with current-year funding
when they introduced school vouchers. Without
making this change, the state would have double-
funded these students while reducing the incen-
tive of districts to respond to competition.
Weighted Student Funding (WSF) represents an
important, if commonly misunderstood, reform.
Most states fund districts according to a formu-
la, but the details are important. Many states fund
districts rather than schools, and they base it on
the previous year’s student count rather than the
current count.
Arizona has run parallel traditional and WSF sys-
tems for decades. For 20 years, Arizona has fund-
ed charter schools at the campus level using cur-
rent-year counts. All the while, the state has
funded its school districts based on the previous
year’s count—and has funded districts rather than
schools.
WSF has not proved a magic bullet to guarantee
schoolquality—manyArizonacharterschoolshave
closed, and more will likely close at the expiration
of their original charter. Comparisons between dis-
trict and charter schools have difficulty account-
ing for the many possible external causes for ap-
parent differences in outcomes. For example,
Harvard University scholar Paul Peterson noted
that students typically take a temporary academ-
ic hit when transferring between schools, and new
schools typically have a “shakedown” period dur-
ing which they have yet to hit peak performance.
Charter sectors with large numbers of new schools
full of newly transferred students can negatively
bias a snapshot comparison of charter schools.
Arizona’s school grading system, however, which
equally weighs overall proficiency and academ-
ic growth over time, shows a clear advantage for
charter schools. In 2013-2014, 40 percent of Arizo-
na charter schools earned an A grade compared to
only 28 percent of district schools that earned an
A. Arizona charters were also relatively underrep-
resented at the low end, with 7 percent receiving
D grades compared to 9 percent of district schools
earning a D.
Hawaii implemented WSF during the 2006-2007
school year. Between 2007 and 2013, Hawaii dou-
bled or tripled the national average for progress
on the four main NAEP examinations (fourth- and
eighth-grade reading and mathematics). While no
one can prove that WSF was the sole or even pri-
mary cause of this high level of improvement, a
general trend toward decentralization seems to
have served the state well.
In an American Institute for Research evalua-
tion of Hawaii’s WSF program, a survey of school
principals revealed a consensus that WSF had in-
creased equity, transparency and campus auton-
omy. While many principals expressed the desire
for greater resources to be at their disposal, some
principals noted that greater control over budgets
would prove far more meaningful if they also had
control over staffing.8
The move to directly fund schools rather than dis-
tricts gives school principals more control over
their budgets, better enabling them to compete.
Imagine being tasked with running a school with
little control over either the budget or staff. If
we want to hold school leaders accountable for
www.alec.org 9
EDUCATION REFORM: A YEAR IN REVIEW
results, it makes sense to give them the authority
they need to succeed.
STATES CONTINUE TO IMPROVE DIGITAL
LEARNING OPPORTUNITIES
Digital learning has opened opportunities for stu-
dents to take courses that would otherwise be un-
available. Online learning has the potential to con-
nect more students to high-quality teachers and
increase the number of students that highly effec-
tive instructors can serve. Students can access ev-
erything from technical and career education to
advanced science and mathematics instruction
to foreign language opportunities through digital
learning.
Digital Learning Now, an initiative of the Founda-
tion for Excellence in Education, produces an an-
nual Digital Learning Report Card to measure
state laws against the 10 Elements of High-Quality
Digital Learning. By 2014, states had implemented
and refined the 422 laws touching on digital learn-
ing—some far more effectively than others. Over-
all, the report card noted progress in 2014, with
half of the states improving their grades overall, 14
states moving up one letter grade and nine states
earning their way out of the F category since the
2013 report.
State policymakers play a critical role in acceler-
ating the adoption of new models of learning en-
abled by technology. State policy can either re-
move barriers to innovative approaches or it can
stifle them with restrictions and red tape to pro-
tect the status quo.
Despite the progress of recent years, only two
states—Florida and Utah—earned an A in the 2014
Digital Learning Report Card.9
Lawmakers have
made strides, but many miles remain ahead in the
journey.
FIGURE 4 | DIGITAL LEARNING NOW GRADES BY STATE, 2014
Grading KeyA B C D F
10 Report Card on American Education
CHAPTER ONE
LAWMAKERS INTRODUCE MULTIPLE
SCHOLARSHIP TAX CREDIT BILLS
Arizona lawmakers created the first scholarship
tax credit program in 1997 when they approved
a dollar-for-dollar credit against the state individ-
ual income tax for donations to nonprofit groups
that provide scholarships for children to attend
private schools. Pennsylvania and Florida fol-
lowed suit in 2001 with corporate scholarship
credits.
The 2014 legislative sessions were relatively un-
eventful in terms of school choice, although Kan-
sas lawmakers created the Tax Credit for Low In-
come Students Scholarship Program. The tax
credit allows corporations to claim a 70 percent
tax credit for contributions to approved nonprof-
its that grant private school scholarships. The to-
tal amount of tax credits awarded statewide is
limited to $10 million.
FIGURE 5 | STATES INTRODUCING SCHOLARSHIP TAX CREDIT LEGISLATION, 2015
Lawmakers were anything but inactive in 2015,
however, with 23 states introducing scholarship
tax credit legislation. In addition to the aforemen-
tioned Nevada scholarship tax credit program,
Arizona lawmakers included subchapter S corpo-
rations in the state’s preexisting corporate schol-
arship credit, which expanded the universe of po-
tential donors. Montana lawmakers also created
a modest scholarship tax credit program in 2015.
Although it remains unresolved at the time of
this writing, New York Governor Andrew Cuomo
took the lead in a bipartisan push for tax cred-
its in 2015. Win or lose, history was made with
a prominent Democrat governor aggressively ad-
vocating for a private choice program. The New
York Times reported the following from a public
appearance Cuomo made to promote tax credit
legislation:
STATES THAT INTRODUCED SCHOLARSHIP TAX CREDIT LEGISLATION
STATES THAT DID NOT INTRODUCE SCHOLARSHIP TAX CREDIT LEGISLATION
www.alec.org 11
EDUCATION REFORM: A YEAR IN REVIEW
“There are some areas, frankly, where the
public schools are not places where you
would want to send your children,” he said
at the Shrine Church of St. Jude in Canarsie,
Brooklyn. He added that “sending your child
to one of these failing public schools is in
many ways condemning your child to get a
second-class education.”10
“We want you to have the ability to choose
where to send your child,” Mr. Cuomo told
churchgoers, asking them to contact their
legislators.
Mr. Cuomo said his father, former Governor
Mario M. Cuomo, chose to send him to pa-
rochial school, believing that “I needed the
nuns to keep me on the straight and narrow.”
On the other hand, Mr. Cuomo said he sent
his three daughters to public school, citing
FIGURE 6 | STATES WITH TAX CREDIT PROGRAMS, 2015
the quality of the public schools in Westches-
ter County. (He did not mention that after at-
tending public school, two of his daughters
went on to graduate from Deerfield Acade-
my, a boarding school in Massachusetts.)
“There’s no right or wrong,” he said. “But it
should be your choice.”
SCHOOL VOUCHER PROGRAMS CONTINUE TO
ADVANCE
Lawmakers continued to debate school voucher
legislation in 2015, with Arkansas legislators pass-
ing a new school voucher program for children
with disabilities. Lawmakers in Wisconsin and
Ohio significantly expanded pre-existing voucher
programs. Most notably, lawmakers removed the
cap from Wisconsin’s statewide voucher program
and created a new program for special needs
children.
STATES WITH TAX CREDIT PROGRAMS
STATES WITHOUT TAX CREDIT PROGRAMS
12 Report Card on American Education
CHAPTER ONE
FIGURE 7 | STATES INTRODUCING SCHOOL VOUCHER LEGISLATION IN 2015
FIGURE 8 | STATES WITH ONE OR MORE SCHOOL VOUCHER PROGRAMS, 2015
STATES THAT INTRODUCED SCHOOL VOUCHER LEGISLATION
STATES THAT DID NOT INTRODUCE SCHOOL VOUCHER LEGISLATION
STATES WITH ONE OR MORE SCHOOL VOUCHER PROGRAMS
STATES WITHOUT SCHOOL VOUCHER PROGRAMS
www.alec.org 13
EDUCATION REFORM: A YEAR IN REVIEW
With the addition of Arkansas, Figure 8 presents
states having one or more school voucher pro-
gram. Florida, Louisiana and Ohio have multiple
school voucher programs.
AFTER THE 2015 SESSIONS A MAJORITY OF
STATES HAVE A PRIVATE CHOICE PROGRAM
First, the good news: a majority of states (26)
have one or more private choice programs. In
2015, a person could drive from Key West, Fla.,
to the California border near Lake Tahoe and nev-
er once enter a state without a private choice
program, as displayed in Figure 9. Many of these
states contain multiple programs, including Ala-
bama, Arizona, Florida, Georgia, Indiana, Iowa,
Louisiana, Mississippi, North Carolina, Ohio, Okla-
homa, Pennsylvania and Wisconsin.
On the other hand, more than 28 percent of
American school children live in California, Texas
FIGURE 9 | STATES WITH ONE OR MORE PRIVATE CHOICE PROGRAMS 2015
or New York, states in which no children have ac-
cess to a private choice program. To put this in
perspective, California’s 6.2 million school chil-
dren equal the combined student enrollments of
the 22 smallest states combined. The more than
five million students in Texas equal the combined
enrollments of the smallest 20 states.
STATE TESTS ALIGN MORE CLOSELY TO NAEP IN
20 STATES, LOWERED IN EIGHT
Fifty years have passed since Congress enacted the
Elementary and Secondary Education Act in 1965.
Congress renamed and revised the statute in 2002,
now known as No Child Left Behind (NCLB). As a
condition of receiving federal education dollars,
NCLB requires states to test students in grades
three through eight and again in high school on
math and reading achievement. Each state test
sets a cut score for what constitutes “proficient”
achievement on these math and reading tests. At
STATES WITH ONE OR MORE PRIVATE CHOICE PROGRAMS
STATES WITHOUT PRIVATE CHOICE PROGRAMS
14 Report Card on American Education
CHAPTER ONE
the time of this writing, Congress is considering
legislation to reauthorize this law, which has stood
unchanged since 2002 despite having been sched-
uled for renewal in 2007.
NCLB requires state participation in fourth-grade
and eighth-grade math and reading exams as part
of NAEP. NAEP tests have performance level cut
scores roughly equivalent to those set by interna-
tional organizations that estimate student profi-
ciency worldwide.11
In other words, if students are
proficient according to NAEP, they likely have a lev-
el of content mastery that is globally competitive.
Paul Peterson and Matthew Ackerman compared
the proficiency standards of state tests to those of
NAEP, thus serving as a measure of “truth in adver-
tising” for state accountability exams.
Their Summer 2015 contained good news overall:
In this paper we extend the five prior analy-
ses by identifying the changes in state profi-
ciency standards between 2011 and 2013,
the last year for which the relevant informa-
tion is available. We show that many states
have raised their proficiency bars since 2011.
Indeed, the 2013 data reveal that for the first
time, substantially more states have raised
their proficiency standards than have let those
standards slip to lower levels. Overall, 20
states strengthened their standards, while just
8 loosened them.12
Peterson and Ackerman found that Florida, Idaho,
Illinois, Iowa, Kansas, Kentucky, Maryland, Michi-
gan, Missouri, New Jersey, New York, North Car-
olina, Oregon, Pennsylvania, Utah, South Dakota,
Texas, Virginia, Wisconsin and Wyoming improved
their alignment with NAEP from 2011 to 2013. Ar-
kansas, Louisiana, Minnesota, Mississippi, New
Hampshire, New Mexico and Oklahoma lowered
the rigor of their state tests.
Figure 10 presents state grades by year, with A
grades denoting close alignment with NAEP profi-
ciency standards, F grades signifying a large gap—
much higher student performance on state tests
than NAEP.
The rigor of state tests fluctuates over time in
a dynamic fashion. The Peterson and Ackerman
study takes a snapshot of the 2011 to 2013 pe-
riod, but things will continue to change state by
state each year. In the end, state policymakers
(usually a state board of education) will make de-
cisions regarding state standards and proficiency
cut scores. Policymakers in states with low grades
should take action to provide truth in advertising
for their students, parents and taxpayers.
Many disagreements surround the process of
adopting and maintaining state academic stan-
dards and tests. No one, however, should support
using taxpayer dollars to create what amounts
to a state-sponsored system of smoke and mir-
rors. The ultimate victims of a state testing sys-
tem that labels illiterate and innumerate children
“proficient” are the children themselves.
CHARTER SCHOOL PARENTS WIN SHOWDOWN
WITH NEW YORK MAYOR BILL DE BLASIO
Former New York City Mayor Mike Bloomberg sup-
ported a policy of co-location for charter schools.
Given the considerable expense of Gotham real
estate and the availability of empty space in city-
owned school buildings, this represented a vital
enabling reform in the creation of charter schools.
Current New York City Mayor de Blasio, however,
made an effort to evict three highly effective char-
ter schools from their city-provided facilities, cre-
ating a showdown between charter supporters
and the new mayor.
Governor Cuomo and the New York legislature
resolved this dispute in favor of the charter par-
ents in a decisive fashion. With the active and vo-
cal support of the governor, a bipartisan majori-
ty of the New York legislature passed a state law
governing co-location policy. Chalkbeat New York,
a web site covering New York education, provid-
ed the following description of the impact of the
legislation:
The new law requires the city to provide new
charter schools with free space inside the city’s
www.alec.org 15
EDUCATION REFORM: A YEAR IN REVIEW
Strength of State Proficiency
Standards 2013
Overall Averages by Year
Change in
Difference
Between State
and NAEP
Rank State
4thGrade 8th Grade
2003 2005 2007 2009 2011 2013
2011–
2013**
2005–
2013**Math Reading Math Reading
1 New York A A A A B- C C+ D+ B- A 31.5 35.3
2 Wisconsin A A A A D+ C- C- D+ D+ A 28.8 38.7
3 Utah A A A A D+ D+ C- D+ A 31.6 40.2
4 North Carolina A A A A D- F D C- C- A 40.6 50.2
5 Pennsylvania A A A A C+ C C C C A 9.7 24.6
6 Massachusetts A A A B- A A A A A A 6.9 -9.6
7 Kentucky A A B+ A B B- C C C A 13.7 15.5
8 Missouri B+ A B+ A A A A A B+ A -7.0 -12.9
9 Tennessee A A C+ A F F F F A A 40.9 47.5
10 Florida B- B+ B- B+ B- C+ C+ C C B 17.7 9.1
11 Washington B+ C+ B+ B B- C B- B- B B 11.8 11.2
12 Colorado B- B B+ B- D+ D B- B- B B 30.1 28.0
13 Michigan A C A C+ C C- D D D- B 26.1 18.2
14 Illinois B- B C+ B C+ C D D D B- -4.9 10.5
15 Minnesota B+ C+ B C+ B- B- B B- -34.7 0.9*
16 New Mexico B+ B+ D+ B+ B- B- C+ B B- 2.0 -0.8
17 New Jersey C A B- C C C C C+ C+ B- 20.8 9.5
18 California D+ C A B- A B B+ C+ C+ C+ 3.0 -5.1
19 Maine B C+ C+ C A A B- C+ C+ C+ -5.0 -24.3
20 Virginia C+ B C+ C C- D+ D+ D D C+ 4.1 15.7
21 New Hampshire B C+ C+ C B- B- B C+ -35.6 -4.6*
22 Nevada D+ C- B+ B+ C+ C C C+ C+ -8.2 -0.2
23 Rhode Island B- B- C+ C B+ B B- C+ C+ C+ 11.5 -6.8
24 Oregon C+ C C C+ C C- C- C- C -7.6 -0.7
25 Maryland C C C+ C B C C- C- C- C 14.8 3.5
26 Hawaii B B- D+ C- A A A C+ C C 0.3 -19.6
27 Iowa C C D+ B- D+ C- D+ D+ C 13.9 7.9
28 North Dakota C C+ C C C+ C C C- C C 12.0 1.7
29 Montana B- D+ C+ C- C C+ C C C C 9.4 -6.2
30 District of Columbia C B- D- C C C C C -3.3 -5.9
31 Nebraska C C C C- D- F F C C 23.3 15.0
32 Wyoming C C C C A A C C C- C -11.5 -30.5
33 Delaware C C D+ C C C C- D+ C+ C -11.8 -0.6
34 Arizona C+ D+ C C- B+ D+ C- D+ C C 18.6 6.3
35 South Dakota C C- C- C C D+ D+ C C- C 13.5 5.9
36 Indiana C C- D C C C- C C C- C- 11.2 -1.1
37 Connecticut C- C+ D- C C C C C C- C- 8.9 -3.9
38 Texas C+ C- D+ D- F D+ D- F D- C- 17.4 3.9
39 Ohio C D C- D+ B- C C- C C- C- 6.5 -7.0
40 Mississippi D C F C D D- D- C C C- 18.2 10.2
41 Kansas C D+ C- D C C- C- D D D+ -6.5 -1.7
42 Alaska C- D+ C- D C- D+ D D+ D+ D+ 13.9 0.8
43 South Carolina D D D+ C A A A C- D+ D+ -20.8 -39.8
44 Arkansas D D D+ D+ B B C+ C- D+ D -8.2 -25.4
45 Oklahoma D+ C- D- D- D- D- F C C- D 19.4 3.8
46 Louisiana D D- D D+ C C C- D+ D+ D 5.2 -10.8
47 Idaho D D- D D- C- D D+ D D- D 15.1 -1.3
48 Georgia D F F F D- D- F F F F 15.7 -4.7
49 Alabama F F F F D- D- F F F 13.7 -7.0
Vermont B B B- B-
West Virginia F D- C B
FIGURE 10 | THE STRENGTH OF STATE PROFICIENCY STANDARDS
* 2005 data are missing; change is calculated from 2007
** A positive number indicates narrowing the difference between the NAEP and state exams
NOTE: Grades are blue in states with rising standards
Source: Paul Peterson’s and Matthew Ackerman’s calculations base on state tests and NAEP
16 Report Card on American Education
CHAPTER ONE
own buildings or public funding to cover rent
in a private facility. The legislation is a rebuke
from state lawmakers of de Blasio’s criticism
of charter schools during the mayoral cam-
paign and his early months in office.
One challenge the law poses for de Blasio is
that it makes financial sense to keep charter
schools in city buildings. If the city doesn’t pro-
vide space, the law provides for charters to re-
ceive an extra funding allowance for each stu-
dent, which in 2015 would be $2,775, from the
city.
Thirteen charter schools have already been
approved to open that year, serving 2,000 stu-
dents at first and 5,800 at full capacity. Private
space for those schools would cost as much as
$5 million in the 2015-16 school year and $16
million once they are all at capacity, based on
enrollment estimates.
In addition, the city is planning to spend $5.4
million next year for three displaced Success
Academy schools, which will have fewer than
500 students next year, to operate in Catholic
school buildings.13
The bipartisan victory of the New York charter
school community, with the benefit of hindsight,
may be viewed as a watershed moment for the en-
tire parental choice movement. New York parents
want more choice in education, and state lawmak-
ers delivered a decisive victory to them.
CHARTER SCHOOLS CONTINUE NATIONWIDE
ADVANCE
The number of states without a charter school law
on the books continues to shrink to a handful of
rural states. In 2013, Mississippi passed new char-
ter school legislation. In 2015, Alabama Governor
Robert Bentley made Alabama the latest state to
join the charter school family.
FIGURE 11 | STATES WITH A CHARTER SCHOOL LAW, 2015
STATES WITH A CHARTER SCHOOL LAW
STATES WITHOUT A CHARTER SCHOOL LAW
www.alec.org 17
EDUCATION REFORM: A YEAR IN REVIEW
Minnesota lawmakers passed the nation’s first
charter school law in 1991, and at the time of this
writing, almost three million students attend-
ed public charter schools in 42 states around the
country. Only a handful of states, however, have
FIGURE 12a | ESTIMATED NUMBER OF PUBLIC CHARTER SCHOOLS AND STUDENTS, 2014-15
State
New
Charters,
Fall 2014
Closed
Charters,
Spring 2014
Net Gain
Charters,
2014-15
Total Charter
Schools,
2014-15
Charter
School
Growth
Estimated
Enrollment,
2014-15
Charter
Enrollment
Growth
AK 0 0 0 27 0% 6,300 2%
AR 6 0 6 45 15% 23,100 41%
AZ 31 13 18 623 3% 225,000 20%
CA 88 36 52 1,184 5% 547,800 7%
CO 16 2 14 214 7% 98,000 5%
CT 4 0 4 22 22% 8,200 17%
DC
5
(+2 campuses)
4
(+2 campuses)
0 61 (on 112
Campuses)
0% 35,300 16%
DE 3 0 3 24 14% 12,500 13%
FL 56 28 28 653 4% 275,000 20%
GA 11 4 7 103 7% 80,600 16%
HI 1 0 1 34 3% 10,400 6%
IA 0 0 0 3 0% 300 -4%
ID 3 2 1 48 2% 19,600 -4%
IL
3
(+2 campuses)
2 2 66 (on 148
campuses)
3% 63,000 6%
IN 6 2 4 79 5% 44,300 25%
KS 0 0 0 11 0% 2,700 6%
LA 18 6 12 129 10% 74,000 25%
MA 3 6 -3 78 -4% 35,700 3%
MD 3 2 1 53v
2% 18,600 5%
ME 1 0 1 6 20% 900 135%
passed what studies rank as strong charter laws.
One sign of weak laws is an inability of charter
school operators to satisfy demand for charter
school seats. Nationwide, more than a million stu-
dents sit on charter school waiting lists.14
The Center for Education Reform annually grades
state charter school laws on an A through F scale.
In 2015 they gave the charter school laws of four
states—Arizona, Indiana, Michigan and Minneso-
ta, plus the District of Columbia—an A grade. An
additional eight states—California, Colorado, Flor-
ida, Idaho, Missouri, Nevada, South Carolina and
Utah—received B Grades.
TheNationalAllianceforPublicCharterSchoolslist-
ed 10 states that enacted legislation to strengthen
their authorizing environments in 2014, drawing
attention especially to Alaska, New York, South
Carolina and Tennessee
While a large majority of states now have char-
ter school laws, a majority of these laws still con-
tain significant weaknesses and departures from
best practices—such as caps on the number of
schools, single authorizers and district-only autho-
rizing. Figure 13 shows that only distinct minori-
ties of states have relatively strong charter laws,
18 Report Card on American Education
CHAPTER TWO
State
New
Charters,
Fall 2014
Closed
Charters,
Spring 2014
Net Gain
Charters,
2014-15
Total Charter
Schools,
2014-15
Charter
School
Growth
Estimated
Enrollment,
2014-15
Charter
Enrollment
Growth
MI 17 7 10 307 3% 159,000 16%
MN 10 1 9 158 6% 47,900 11%
MO 2 1 1 51 2% 20,000 8%
NC 25 1 24 151 19% 70,800 22%
NH 4 0 4 23 21% 3,000 43%
NJ 5 5 0 87 0% 41,000 27%
NM 4 2 2 97 2% 24,400 14%
NV 4 0 4 38 12% 28,200 15%
NY 17 2 15 248 6% 106,000 17%
OH 11 27 -16 384 -4% 146,000 18%
OK 3 1 2 27 8% 18,700 40%
OR 2 1 1 125 1% 32,000 12%
PA 4 4 0 176 0% 128,000 -1%
RI 3 0 3 21 17% 7,100 19%
SC 10 3 7 66 12% 27,400 18%
TN 14 5 9 80 13% 20,900 72%
TX
2
(+53campuses)
7
(+18campuses
35 275 (on 721
campuses)
15% 280,000 18%
UT 15 0 15 110 16% 65,400 19%
VA 1 0 1 7 17% 46,800 7%
WA 1 0 1 1 45
WI 22 22 0 245 0% 46,800 7%
WY 0 0 0 4 0% 600 27%
Total 491 216 278 6,724 4% 2,890,000 14%
FIGURE 12b | ESTIMATED NUMBER OF PUBLIC CHARTER SCHOOLS AND STUDENTS, 2014-15
Public charter school data can be found on the Public Charter School Dashboard:
http://dashboard.publiccharters.org/dashboard/home
www.alec.org 19
EDUCATION REFORM: A YEAR IN REVIEW
FIGURE 13 | STATES WITH A- OR B- GRADED CHARTER SCHOOL LAWS
and hundreds of thousands of children sit on the
waiting lists of charter schools in the states with
“strong” laws.
REFORM IS ROLLING BUT HAS MUCH FARTHER
TO GO
While reform momentum continues, the accom-
plishments to date only represent critical steps in
a long journey. Average children continue to face
waiting lists if they want to attend high-quality
charter schools and have limited access to private
choice programs. They also attend schools gov-
erned by human resource policies of the sort de-
cried in the Vergara.
STATES WITH A- OR B- GRADED CHARTER SCHOOL LAWS
STATES WITHOUT A- OR B- GRADED CHARTER SCHOOL LAWS
Nevertheless, decades of K-12 practice have begun
a fundamental shift. Lawmakers are now think-
ing far more deeply about what it will take to im-
prove academic outcomes after decades of re-
form strategies that amounted to sending school
districts more money and hoping for the best. Pa-
rental choice has proved both successful and pop-
ular with parents. Lawmakers have begun serious
efforts to address injurious human resource issues
that threaten students. The political forces invest-
ed in maintaining the status quo remain incredibly
powerful, but over the past decade it has become
increasingly common for dedicated lawmakers to
prevail. Reformers are not only seeing more victo-
ries, but also increasingly able to obtain strong bi-
partisan for their efforts.
20 Report Card on American Education
CHAPTER ONE
ENDNOTES
1.	 Fleischman, H.L. et al. 2010. “Highlights From PISA 2009: Performance of U.S. 15-Year-Old Students in Reading, Math-
ematics, and Science Literacy in an International Context.” National Center for Education Statistics. Available at http://
nces.ed.gov/pubs2011/2011004.pdf.
2.	 Nagourney, Adam. 2014. “Las Vegas Schools Groan From Growing Pains.” The New York Times Oct. 6, 2014.” Available
at http://www.nytimes.com/2014/10/07/us/las-vegas-schools-groan-from-growing-pains.html.
3.	 Chartier, Michael. 2015. “Everything You Need to Know About Nevada’s Universal ESA Bill.” Friedman Foundation for
Educational Choice. Available at http://www.edchoice.org/Blog/May-2015/Everything-You-Need-to-Know-About-
Nevada-s-Univers.
4.	 Foundation for Excellence in Education. 2015. “Nevada Becomes National Leader in Education Reform.” Available at
http://excelined.org/news/nevada-becomes-national-leader-in-education-reform/.
5.	 Decision available at http://studentsmatter.org/wp-content/uploads/2014/06/Tenative-Decision.pdf.
6.	 Editorial Board. 2014. “Special Ed Vouchers Would Give Parents Some Choices.” The Clarion-Ledger http://archive.
clarionledger.com/article/20140225/OPINION01/302250022.
7.	 Hayden, Maureen. 2011. “Formula to fund Indiana public schools gets overhauled.” Indiana Economic Digest Apr.
30, 2011. Available at http://www.indianaeconomicdigest.net/main.asp?SectionID=31&subsectionID=135&article
ID=59770.
8.	 Levin, Jesse et al. 2013. “Evaluation of Hawaii’s Weighted Student Funding.” American Institutes for Research, June
2013. Available at https://www.hawaiipublicschools.org/DOE%20Forms/WSF/WeightedStudentFormulaEval061913.
pdf.
9.	 Foundation for Excellence in Education. 2014. “Digital Learning Report Card 2014.” Available at http://excelined.
org/2014DLNReportCard/offline/download.pdf.
10.	 Kaplan, Thomas. 2015. “Cuomo Promotes Tax Credits for Families of Students at Private Schools.” The New York Times,
May 17, 2015. Available at http://www.nytimes.com/2015/05/18/nyregion/cuomo-promotes-tax-credits-for-families-
of-students-at-private-schools.html?_r=0.
11.	 Peterson, Paul E. and Matthew Ackerman. 2015. “States Raise Proficiency Standards in Math and Reading.” Education
Next Summer 2015, Available at http://educationnext.org/states-raise-proficiency-standards-math-reading/.
12.	 Ibid.
13.	 Decker, Geoff. 2014. “As Charter Sector Continues to Swell, a Space Dilemma Grows for De Blasio.” Chalkbeat New York
Jun. 6, 2014. Available at http://ny.chalkbeat.org/2014/06/06/as-charter-sector-continues-to-swell-a-space-dilemma-
grows-for-de-blasio/#.VYmjV_lVikq.
14.	 Kern, Nora and Wentana Gebru. 2014. “Waiting Lists to Attend Charter Schools Top 1 Million Names.” National Alliance
for Public Charter Schools, May 2014. Available at http://www.publiccharters.org/wp-content/uploads/2014/05/
NAPCS-2014-Wait-List-Report.pdf.
2CHAPTER
Appropriately Equipping
Our Students Today for a
Prosperous Tomorrow
22 Report Card on American Education
Appropriately Equipping Our
Students Today for a Prosperous
Tomorrow
Education policy cannot hope to solve the prob-
lem alone, but it can contribute. Current age de-
mographic projections foretell an impending fu-
ture in which the demand for public dollars in
the form of health care, public pension outlays
and education expenses exceeds the likely sup-
ply of public dollars—absent a substantial and
sustained period of above-average econom-
ic growth. Better-educated students today will
translate into growth and innovation tomorrow.
Appropriately equipping the America of to-
morrow must start today. Academic achieve-
ment and attainment both strongly predict fu-
ture earnings. Improved mastery of reading and
mathematics strongly influences future college
and career success for students in both low- and
high-income households. For instance, the Na-
tional Center for Education Statistics recently
completed a tracking study of 2002 high school
sophomores and their success in earning bach-
elors’ degrees by 2012. Figure 2 shows the dif-
ferences in college success among students from
low-income families by their mathematics per-
formance quartile.
Among students from low-income households,
those scoring in the highest 25 percent of overall
mathematics achievement were more than eight
times more likely to have completed a bache-
lor’s degree than those who scored in the low-
est performing mathematics quartile. Students
from low-income families in the lowest quartile
of achievement, meanwhile, had only a one-in-20
rate of obtaining a bachelor’s degree.
Over the next 15 years public pensions will
be strained and tax revenues may shift
as many baby boomers move from their
prime earning years to fixed incomes. In addition,
demands for public health spending, at the state
level primarily through the Medicaid program,
will rise as the elderly population increases.
In 2010, the nation’s largest retirement desti-
nation, Florida, had the nation’s largest elderly
population as a percentage of its total. However,
looking forward in census projections to the year
2030, the vast majority of states will have a larg-
er percentage of elderly population than Amer-
ica’s prime retirement destination does today.
Figure 1 shows the projections by state for pop-
ulations of people 65 and older in 2030, along
with Florida’s percentage of the same in 2010.
Many states face increased spending pressures
from both ends of the age spectrum due to the
large increase in the retired populations coupled
with large projected increases in their youth pop-
ulation. The percentage of the population in the
prime working years (ages 18 to 64) will shrink in
all 50 states as both the elderly and youth pop-
ulations increase. The youth of today will face
considerable challenges as they become middle-
aged taxpayers supporting an increasingly aging
populace. Much of the working-age population
in 2030 and beyond, those primarily tasked with
keeping vital public services viable, sit in K-12
classrooms now. One major responsibility of pol-
icymakers today is to ensure the policies enacted
now increase return on K-12 investment.
www.alec.org 23
APPROPRIATELY EQUIPPING OUR STUDENTS TODAY FOR A PROSPEROUS TOMORROW
FIGURE 1 | PROJECTIONS FOR THE PERCENTAGE OF POPULATION AGED 65+ IN 2030
Source: United States Census Bureau
13.2%	
  
14.7%	
  
15.6%	
  
15.9%	
  
16.5%	
  
17.6%	
  
17.8%	
  
17.8%	
  
17.8%	
  
18.0%	
  
18.1%	
  
18.1%	
  
18.2%	
  
18.3%	
  
18.6%	
  
18.8%	
  
18.9%	
  
19.2%	
  
19.4%	
  
19.5%	
  
19.7%	
  
19.7%	
  
19.8%	
  
20.0%	
  
20.1%	
  
20.2%	
  
20.2%	
  
20.3%	
  
20.4%	
  
20.5%	
  
20.6%	
  
20.9%	
  
21.3%	
  
21.3%	
  
21.4%	
  
21.4%	
  
21.5%	
  
22.0%	
  
22.1%	
  
22.3%	
  
22.4%	
  
22.6%	
  
23.1%	
  
23.5%	
  
24.4%	
  
24.8%	
  
25.1%	
  
25.8%	
  
26.4%	
  
26.5%	
  
26.5%	
  
27.1%	
  
0.0%	
   5.0%	
   10.0%	
   15.0%	
   20.0%	
   25.0%	
   30.0%	
  
Utah	
  
Alaska	
  
Texas	
  
Georgia	
  
Colorado	
  
Maryland	
  
California	
  
North	
  Carolina	
  
2010	
  Florida	
  (NaGon's	
  Highest	
  in	
  2010)	
  
Illinois	
  
Washington	
  
Indiana	
  
Oregon	
  
Idaho	
  
Nevada	
  
Virginia	
  
Minnesota	
  
Tennessee	
  
Oklahoma	
  	
  
Michigan	
  	
  
Louisiana	
  
United	
  States	
  
Kentucky	
  
New	
  Jersey	
  
New	
  York	
  
Missouri	
  
Kansas	
  
Arkansas	
  
Ohio	
  
Mississippi	
  
Nebraska	
  
Massachuse[s	
  
Wisconsin	
  
Alabama	
  
New	
  Hampshire	
  
Rhode	
  Island	
  
ConnecGcut	
  
South	
  Carolina	
  	
  
Arizona	
  
Hawaii	
  
Iowa	
  
Pennsylvania	
  
South	
  Dakota	
  
Delaware	
  
Vermont	
  
West	
  Virginia	
  
North	
  Dakota	
  
Montana	
  
New	
  Mexico	
  
Maine	
  
Wyoming	
  	
  
Florida	
  
24 Report Card on American Education
CHAPTER TWO
FIGURE 2 | LOW-INCOME SPRING 2002 SOPHOMORES WHO EARNED A BACHELOR’S DEGREE OR
HIGHER BY 2012
FIGURE 3 | HIGH-INCOME SPRING 2002 SOPHOMORES WHO EARNED A BACHELOR’S DEGREE OR
HIGHER BY 2012
Source: National Center for Education Statistics
5%	
  
12%	
  
23%	
  
41%	
  
Lowest	
  Quar2le	
   Second	
  Quar2le	
   Third	
  Quar2le	
   Highest	
  Quar2le	
  
21%	
  
41%	
  
61%	
  
74%	
  
Lowest	
  Quar2le	
   Second	
  Quar2le	
   Third	
  Quar2le	
   Highest	
  Quar2le	
  
NAEP Mathematics Quartile
www.alec.org 25
APPROPRIATELY EQUIPPING OUR STUDENTS TODAY FOR A PROSPEROUS TOMORROW
dropouts, in essence, begin with the problems of
the K-12 system. Fixing the leaks in America’s bro-
ken human capital pipeline is a matter of utmost
urgency for lawmakers.
NAEP READING SCORES AS A PREDICTOR OF
COLLEGE SUCCESS
How well-prepared are students to face the chal-
lenges of tomorrow? The National Center for Ed-
ucation Statistics recently conducted a study that
sheds light on this question. The National Assess-
ment Governing Board established a commis-
sion to study the use of 12th-grade NAEP read-
ing and mathematics exams to estimate college
readiness. The commission conducted a series
of technical studies and reached the following
conclusion:
Students who are considered ready for college
are generally expected to be academically pre-
pared for entry-level college coursework. A
combination of factors contributes to students’
readiness for college, including content knowl-
edge, cognitive strategies, learning skills, and
transitioning skills.4
As a measure of students’
knowledge in core subject areas, the potential
use of NAEP results as an indicator of students’
academic preparedness for postsecondary ed-
ucation and training is being explored by the
Governing Board.
A series of studies conducted since 2008 sup-
ported inferences about performance on the
grade 12 NAEP mathematics and reading as-
sessments in relation to academic preparedness
for college. The results of the research studies
indicate that students scoring at or above 163
on the NAEP mathematics scale, and students
scoring at or above 302 on the NAEP reading
scale are likely to possess the knowledge, skills,
and abilities in those subjects that would make
them academically prepared for college.
Based upon the 2013 NAEP, the commission
found that only 39 percent of the class of 2013
qualified as “college ready” in math and 38 per-
cent in reading.2
These results provide an impor-
tant clue as to why so many students drop out of
college. The rate of college attendance for recent
Figure 3 presents similar data for students from
middle- and higher-income households.
Income plays a large role when it comes to earn-
ing degrees. Students in high-income households
scoring in the lowest quartile had a 21 percent
rate of earning a bachelor’s degree by 2012 com-
pared to only 5 percent among similar peers from
lower-income families. High-scoring students
from middle- and high-income backgrounds ob-
tained a degree at a much higher rate than their
low-income peers with similar math ability—71
percent to 41 percent.
In addition to family income, K-12 academic
achievement also played a big role in college suc-
cess—with the highest-scoring students from mid-
dle- and high-income households earning bache-
lors’ degrees at a 74 percent rate. This was more
than three-times the rate of their economic peers
with bottom quartile mathematics achievement.1
America’s approaching age demographic chal-
lenge means the expression “a mind is a terrible
thing to waste” will loom ever larger. The coun-
try does not have children whose educations it
can afford to waste—whether they are from low-
, middle- or high-income families. The future of
America needs all students sitting in the class-
room today to become productive and innova-
tive prosperity generators. This, of course, does
not mean that every student needs to attend col-
lege. In fact, many students who choose to enter
the workforce rather than an institution of high-
er learning find themselves earning higher wages
with less debt than their peers with college de-
grees. Many productive and innovative people
either did so or (à la Bill Gates, Michael Dell, and
others) dropped out of college to pursue their
careers.
A solid foundation of academic skills and knowl-
edge is incredibly useful in whatever walk of life
students pursue. All students should have the ac-
ademic skills to succeed in college and career.
The pages that follow demonstrate that Ameri-
can colleges currently accept far more students
than the American K-12 system adequately pre-
pares for college success. High rates of college
26 Report Card on American Education
CHAPTER TWO
high school graduates reached 70 percent nation-
wide in 2009.3
The problem is that the rate of stu-
dents attending college far exceeds the percent-
age of those who are properly prepared.
In a column from the Thomas B. Fordham Insti-
tute titled “Want more college graduates? Im-
prove our K–12 system,” Mike Petrilli collected
data on the national rates of college prepared-
ness based on NAEP reading scores, the rate of
college attendance for high school graduates and
the rate of degree attainment within an eight
year window of high school graduation.
In examining this data (Figure 4), Petrilli noted:
Back in 1992, 40 percent of twelfth graders
were “college-prepared” in reading, accord-
ing to the National Assessment of Educational
Progress. Yet eight years later, just 29 percent
of Americans aged 25–29 had obtained at least
a bachelor’s degree. Some of that gap can be
explained by high school dropouts—kids who
left school before twelfth grade and would not
FIGURE 4 | COLLEGE ATTENDANCE, READINESS AND COMPLETION RATES
be expected to get a college degree. But most
could be seen as lost potential—young people
who were academically prepared for college
but either didn’t go or didn’t finish.
But note what happened by the high school
class of 2005. Thirty-five percent of twelfth
graders were prepared for college in reading
(and 36 percent in math); eight years later, 34
percent of their age cohort had completed a
college degree. This is good news: We closed
the gap between college readiness and col-
lege attainment. But it also implies that if we
want to increase college attainment, we need
to make progress on college readiness.4
This figure clearly illustrates the sizeable gulf be-
tween college attendance and college gradua-
tion across the board in the national rates—only
about half of enrollees finish—and the much
smaller gap between the NAEP college readiness
rate and the college completion rate. Others can
debate whether admitting under-prepared stu-
dents into college to ultimately watch more of
Source: Thomas B. Fordham Institute
61%	
   61%	
  
65%	
   65%	
  
68%	
  
70%	
  
66%	
  
40%	
  
36%	
  
40%	
  
36%	
   35%	
  
38%	
   38%	
  
29%	
   28%	
   28%	
  
32%	
   34%	
  
1992	
   1994	
   1998	
   2002	
   2005	
   2009	
   2013	


  College	
  A3endance	


  College	
  Readiness	
  (Reading)	
   	
  	
  Bachelor	
  Degree	
  CompleCon	
  aDer	
  8	
  years	
  
www.alec.org 27
APPROPRIATELY EQUIPPING OUR STUDENTS TODAY FOR A PROSPEROUS TOMORROW
them fail to finish represents good policy. How-
ever, it’s an unambiguously good thing if more
K-12 students obtain the academic skills needed
to succeed in college and career.
Unfortunately, 12th-grade NAEP reading profi-
ciency rates are only available from a handful of
states, and the mathematics college readiness
rate for any state cannot be accessed. Fortunate-
ly, NAEP samples state cohorts of students at dif-
ferent times in their K-12 careers.5
This chapter
will demonstrate that the eighth-grade proficien-
cy rates of a student cohort closely correspond
to the proficiency rates for the same cohort of
students when they reach 12th-grade. The good
news, therefore, is that NAEP eighth-grade pro-
ficiency rates reveal something important about
the quality of the college readiness pipeline in
each state.
The bad news is that the information received on
college readiness by state varies only in degrees
of negativity, as demonstrated below.
STATE-LEVEL PIPELINES: LINKING EIGHTH- AND
12TH-GRADE NAEP SCORES BY COHORT
The National Center for Education Statistics has
established that NAEP 12th-grade reading pro-
ficiency predicts success in college. Only a small
number of states have reported 12th-grade NAEP
reading proficiency rates. A quick examination of
those rates demonstrates a strong relationship
between 12th-grade rates and the eighth-grade
rates for the same cohort of students four years
earlier. NAEP provides eighth-grade reading pro-
ficiency rates for all 50 states, and these rates
provide a sense of the college readiness pipeline
in each state.
NAEP’s finding of a national 39 percent college
readiness rate based on mathematics achieve-
ment and 38 percent rate based upon reading has
limitations. NAEP tests representative samples of
students in order to draw conclusions about larg-
er populations. The reading and math samples in
any given year represent different samples of stu-
dents. Therefore, the percentage of students pre-
pared for college in both reading and mathemat-
ics cannot be determined through NAEP scores,
because of the small percentage of students test-
ed in both subjects.
Because the percentage of students college-
ready in both math and reading at the state lev-
el cannot be determined from NAEP data, only
reading scores will be considered. It is certain-
ly possible for a student to be college-ready in
reading, while being prevented from graduating
by a lack of math skills. Readers should view the
college-readiness reading rates as a ceiling for a
state’s total college readiness rate. The total rate
only can be lower than the reading rate; it can-
not be higher. Reading comprehension, after all,
represents a crucial mathematical skill when at-
tempting to reason one’s way through a word
problem. A lack of math skills among highly liter-
ate high school graduates may sink them in col-
lege, but an inability to read will almost certainly
prove fatal to a college career. Many college ma-
jors allow students to skirt high-level mathemat-
ics courses, but none allow them to avoid learn-
ing from written texts.
With this understanding, consider NAEP reading
proficiency rates by state. National averages can
only inform state-level policy making to a limit-
ed degree. Unfortunately, NAEP only provides
12th-grade reading data (and thus college read-
iness rates based on reading) for a small number
of states.
NAEP eighth-grade reading proficiency rates
(available in all states) strongly predict subse-
quent 12th-grade proficiency rates for the same
cohort of students. For example, the reading pro-
ficiency rates for the class of 2013 as eighth-grad-
ers (in 2009) were similar to that of the reading
proficiency rates for the same cohort of stu-
dents as high school seniors in 2013. In essence, a
state’s eighth-grade reading proficiency is an in-
dicator of likely future post-secondary success at
the aggregate level. NAEP eighth-grade reading
proficiency therefore represents an important
indicator of a state’s college readiness pipeline.
Federal law creates a powerful financial in-
centive for states to participate in fourth- and
eighth-grade NAEP testing, but 12th-grade test-
ing remains voluntary at the state level. Thirteen
28 Report Card on American Education
CHAPTER TWO
FIGURE 5 | READING PROFICIENCY RATES FOR THE CLASS OF 2013 AS EIGHTH GRADERS IN 2009 AND
12TH GRADERS IN 2013
Arkansas
C
onnecticut
Idaho
Illinois
Iow
aM
assachusetts
M
ichigan
N
ew
H
am
pshire
N
ew
JerseySouth
D
akota
TennesseW
estVirginia
Arkansas
C
onnecticut
Idaho
Illinois
Iow
aM
assachusetts
M
ichigan
N
ew
H
am
pshire
N
ew
JerseySouth
D
akota
TennesseW
estVirginia
2013 12TH GRADE READING PROFICIENCY			 2009 8TH GRADE READING PROFICIENCY
2009 12TH GRADE READING PROFICIENCY			 2005 8TH GRADE READING PROFICIENCY
29%	
  
43%	
  
32%	
  
39%	
  
40%	
  
39%	
  
46%	
  
44%	
  
39%	
  
40%	
  
29%	
  
26%	
  
34%	
  
25%	
  
32%	
  
31%	
  
34%	
  
44%	
  
38%	
   38%	
  
37%	
  
22%	
  
Arkansas	
  
Connec7cut	
  
Florida	
  
Idaho	
  
Illinois	
  
Iow
a	
  M
assachuseBs	
  New
	
  Ham
pshire	
  
New
	
  Jersey	
  	
  South	
  Dakota	
  W
est	
  Virginia	
  	
  
33%	
  
50%	
  
36%	
  
41%	
  
39%	
   40%	
  
43%	
  
37%	
  
45%	
  
41%	
  
39%	
  
31%	
  
28%	
  27%	
  
43%	
  
32%	
   33%	
   33%	
   32%	
  
43%	
  
31%	
  
39%	
  
42%	
  
37%	
  
28%	
  
22%	
  
Arkansas	
  Connec7cut	
  
Florida	
  
Idaho	
  
Illinois	
  
Iow
a	
  
M
assachuseBs	
  
M
ichigan	
  
New
	
  Ham
pshire	
  New
	
  Jersey	
  	
  South	
  Dakota	
  
Tennesse	
  W
est	
  Virginia	
  	
  
FIGURE 6 | READING PROFICIENCY RATES FOR THE CLASS OF 2009 AS EIGHTH GRADERS IN 2005 AND
TWELFTH GRADERS IN 2009
Source: National Center for Education Statistics
www.alec.org 29
APPROPRIATELY EQUIPPING OUR STUDENTS TODAY FOR A PROSPEROUS TOMORROW
fit comfortably with the NAEP college readiness
rate. The ACT found a college readiness rate of 64
percent for English, 44 percent for reading, 44 per-
cent for math and 36 percent for science. Thus, the
ACT reading rate was somewhat higher than that
provided by NAEP, but the difference between a
broad population measure (NAEP) and a self-se-
lected group (ACT) easily could explain a gap of 6
percent, even if the standards were identical. The
ACT found that only 26 percent of students who
took the ACT test in 2013 met the college-readi-
ness benchmark in all four subjects (English, read-
ing, math and science).6
The difference between
the college readiness rate based on the read-
ing test alone (44 percent) and the percentage of
those college ready in all four subjects (26 percent)
should further reinforce that NAEP reading scores
serve only as a ceiling for college-readiness.
Again, when considering the NAEP data, some stu-
dents prepared in reading can be poorly prepared
in other subjects. The actual percentage of well-
prepared students in reading should be considered
higher than the actual percentage of college-ready
students in every case. In other words, reading
readiness alone overestimates total college read-
iness with regards to the NAEP data just as it does
in the ACT (where 44 percent scored college ready
according to their reading scores but only 26 per-
cent qualified as college ready in all subjects).
Given this context, NAEP eighth-grade reading
proficiency rates serve as a rough upper limit on
the college proficiency pipeline for each state’s
near future. A student’s lack of preparation in oth-
er academic subjects can certainly further impede
college success, but a lack of ability to process and
fully comprehend text will inhibit post-secondary
success.
Figure 7 presents eighth-grade reading proficiency
rates for the entire student population by state or
jurisdiction from the 2013 NAEP.
These rates are low for all states. Even the top per-
forming state, Massachusetts, has a minority of
eighth graders on track for college success based
upon their reading ability alone. Also, achievement
gaps play a strong role in the list. The top 10 states
stand apart from the national average in both
states—Arkansas, Connecticut, Florida, Idaho, Illi-
nois, Iowa, Massachusetts, Michigan, New Hamp-
shire, New Jersey, South Dakota, Tennessee and
West Virginia—volunteered to have their 12th
graders participate in the 2013 NAEP.
A similar pattern emerges when examining the
eighth- and 12th-grade reading proficiency rates
for the class of 2009, as seen in Figure 6.
Data from both the class of 2009 and the class of
2013 demonstrate that eighth- and 12th-grade
reading proficiency rates do not change dramat-
ically, with a similar tendency for slightly higher
rates for the cohort as 12th graders. One should
expect the higher rates for 12th graders given stu-
dent attrition rates. Individual students, of course,
move in and out of states over time, making them
eligible for inclusion in the NAEP samples of differ-
ent states. The aggregate impact of this should be
minimal, however, unless a particular state is sys-
tematically losing well-prepared students while
gaining poorly performing students from other
states.
Dropouts, however, represent a more pervasive
cause of the change in these numbers, and almost
certainly help explain why the 12th-grade num-
bers are consistently higher than the eighth- grade
numbers. Many academically lower-performing
students drop out of school between their eighth-
and 12th-grade years, making them unavail-
able for NAEP testing as 12th-graders. Therefore,
12th-grade scores (for the students still attend-
ing school) would likely look better than eighth-
grade scores, all else being equal, even if the co-
hort makes an average amount of progress during
their high school careers.
The numbers presented in this chart comport
well with an analysis by the American College Test
(ACT), which calculates the percentage of students
taking the nationwide ACT college readiness ex-
ams. These standards differ from those of NAEP
in rigor and they are only for students taking the
ACT tests—not for the general population. Thus,
the rate of students taking ACT exams can influ-
ence the rates of college readiness.
Despitetheselimitations,theACTnationalnumbers
30 Report Card on American Education
CHAPTER TWO
FIGURE 7 | NAEP EIGHTH GRADE READING PROFICIENCY RATES, 2013
17%	
  
20%	
  
22%	
  
24%	
  
25%	
  
25%	
  
28%	
  
28%	
  
29%	
  
29%	
  
29%	
  
30%	
  
30%	
  
31%	
  
31%	
  
32%	
  
33%	
  
33%	
  
33%	
  
33%	
  
33%	
  
34%	
  
35%	
  
35%	
  
36%	
  
36%	
  
36%	
  
36%	
  
36%	
  
36%	
  
36%	
  
37%	
  
37%	
  
37%	
  
38%	
  
38%	
  
38%	
  
38%	
  
39%	
  
39%	
  
40%	
  
40%	
  
41%	
  
42%	
  
42%	
  
42%	
  
44%	
  
45%	
  
45%	
  
46%	
  
48%	
  
0	
   0.1	
   0.2	
   0.3	
   0.4	
   0.5	
   0.6	
  
District	
  of	
  Columbia	
  
Mississippi	
  
New	
  Mexico	
  
Louisiana	
  
Alabama	
  
West	
  Virginia	
  
Arizona	
  
Hawaii	
  
Oklahoma	
  
California	
  
South	
  Carolina	
  
Arkansas	
  
Nevada	
  
Texas	
  
Alaska	
  
Georgia	
  	
  
North	
  Carolina	
  
Michigan	
  
Tennessee	
  
Florida	
  
Delaware	
  
North	
  Dakota	
  
Indiana	
  
New	
  York	
  
South	
  Dakota	
  
Missouri	
  
Kansas	
  
Rhode	
  Island	
  
Illinois	
  
Virginia	
  
Wisconsin	
  
Nebraska	
  
Iowa	
  
Oregon	
  
Wyoming	
  
Kentucky	
  
Maine	
  
Idaho	
  
Ohio	
  
Utah	
  
Colorado	
  
Montana	
  
Minnesota	
  
Washington	
  
Pennsylvania	
  
Maryland	
  
New	
  Hampshire	
  
Vermont	
  
ConnecZcut	
  
New	
  Jersey	
  
Massachuses	
  
0% 5% 10% 15% 20% 25% 30% 35% 40% 45% 50%
Source: National Center for Education Statistics
www.alec.org 31
APPROPRIATELY EQUIPPING OUR STUDENTS TODAY FOR A PROSPEROUS TOMORROW
FIGURE 8 | NAEP EIGHTH GRADE GENERAL-EDUCATION STUDENTS ELIGIBLE FOR A FREE OR REDUCED
LUNCH STUDENTS SCORING “PROFICIENT OR BETTER”
13%	
  
15%	
  
15%	
  
19%	
  
19%	
  
20%	
  
21%	
  
21%	
  
21%	
  
22%	
  
22%	
  
22%	
  
22%	
  
23%	
  
23%	
  
23%	
  
24%	
  
24%	
  
25%	
  
25%	
  
25%	
  
26%	
  
26%	
  
26%	
  
26%	
  
26%	
  
26%	
  
27%	
  
27%	
  
27%	
  
27%	
  
27%	
  
28%	
  
28%	
  
28%	
  
28%	
  
28%	
  
29%	
  
29%	
  
29%	
  
31%	
  
31%	
  
31%	
  
31%	
  
31%	
  
32%	
  
32%	
  
32%	
  
34%	
  
36%	
  
37%	
  
0%	
   5%	
   10%	
   15%	
   20%	
   25%	
   30%	
   35%	
   40%	
  
District	
  of	
  Columbia	
  
Mississippi	
  
Alabama	
  
Arizona	
  
Louisiana	
  
South	
  Carolina	
  
New	
  Mexico	
  
West	
  Virginia	
  
Michigan	
  
Virginia	
  
California	
  
Georgia	
  
Texas	
  
North	
  Dakota	
  
Delaware	
  
North	
  Carolina	
  
Arkansas	
  
Illinois	
  
Oklahoma	
  
Tennessee	
  
Alaska	
  
Maryland	
  
Rhode	
  Island	
  
Hawaii	
  
Nevada	
  
Ohio	
  
Florida	
  
Nebraska	
  
Missouri	
  
Indiana	
  
Kansas	
  
New	
  York	
  
Iowa	
  
Oregon	
  
Kentucky	
  
Wisconsin	
  
Minnesota	
  
South	
  Dakota	
  
ConnecWcut	
  
Colorado	
  
Montana	
  
New	
  Hampshire	
  
Utah	
  
Wyoming	
  
Idaho	
  
Pennsylvania	
  
New	
  Jersey	
  
Washington	
  
Maine	
  
Vermont	
  
Massachuse[s	
  
32 Report Card on American Education
CHAPTER TWO
family income and student ethnicity but still fail
to teach a majority of children to read proficiently.
Judging the relative effectiveness of state K-12 ef-
forts, Figure 8 presents the same eighth-grade
reading proficiency data, but the table also con-
siders socio-economic status and student special
programs like English language learners and spe-
cial education. As discussed in previous editions
of the Report Card on American Education, some
states have much higher average family incomes
than others. States also vary in rates of special pro-
gram participation.
While it is impossible to determine where fami-
ly education success ends and school success be-
gins, it is worth noting that many defenders of the
status quo plead helplessness in the face of stu-
dent poverty, while willingly giving the K-12 sys-
tem full credit for the academic success of children
from high-income families. For instance, research-
ers sometimes compare middle- and high-income
American students with entire national averages.
A sober analysis of the international data would
note that American students are often outscored
by countries that spend a quarter of what the U.S.
spends on public school education—a condition
only made possible by the affluence of the Unit-
ed States. Instead, status quo defenders implicitly
postulate that Americans hold a global monopoly
on student poverty.7
In order to minimize the role such factors play in
determining academic outcomes and thus get a
better understanding of the relative effectiveness
of state efforts, Figure 8 provides NAEP eighth-
grade reading proficiency rates for students quali-
fying for a free or reduced-price lunch under feder-
al guidelines and who do not participate in special
programs such as English language learners or spe-
cial education. Examining the scores of only low-
income general-education children does not con-
stitute a perfect control for student demographic
characteristics; it is simply much better than ex-
amining raw performance to determine the rela-
tive effectiveness of state efforts.
Previous editions of the Report Card have present-
ed the case that racial and ethnic differences in
academic achievement should be viewed as a cul-
tural challenge. The essence of effective school-
ing involves adult guidance of student culture to
ensure learning occurs. While schools and states
can narrow achievement gaps through schools
with strong cultures (many examples exist), Figure
8 shows how much room states have to improve
on this front. Even after taking economic and spe-
cial-program differences into account, the ra-
cial and ethnic profile of the top 10 ranking states
looks strikingly different from that of the bottom
10 states.
The most important point, however, is that all of
thesenumbersarefartoolow.Ifthemosteffective
public education system in the country (Massachu-
setts) can only teach 37 percent of general-educa-
tion low-income children to read proficiently, edu-
cators and parents need to consider entirely new
policies. Looking ahead to America’s approach-
ing age demographic crisis, no state can afford to
have 63 percent of low-income students off-track
for college in eighth-grade.
SENDING STUDENTS TO COLLEGE WITHOUT
NECESSARY READING SKILLS
Figure 9 compares the measured proficiency rates
of a cohort of students on the NAEP reading exam
in 2005 to the college attendance rate in the fall
of 2010. In each state, the rate of college atten-
dance greatly exceeds the rate of previously mea-
sured reading proficiency. Thus, in California only
21 percent of the class of 2010 read as proficient-
ly as eighth graders, but 79 percent of high school
graduates attended college in the fall semester af-
ter their scheduled spring graduation in May 2010.
Again, these numbers should be viewed rough-
ly rather than deterministically. This does not ar-
gue that only 21 percent of the California class of
2010 ought to have been admitted into college, or
that it is known which particular students ought
to have been admitted from the California class. It
can, however, be predicted that college is likely to
go badly for students who were not reading profi-
ciently in eighth grade.
www.alec.org 33
APPROPRIATELY EQUIPPING OUR STUDENTS TODAY FOR A PROSPEROUS TOMORROW
22%	
  
26%	
  
23%	
  
26%	
  
21%	
  
32%	
  
34%	
  
30%	
  
12%	
  
25%	
  
25%	
  
18%	
  
32%	
  
31%	
  
28%	
  
34%	
  
35%	
  
31%	
  
20%	
  
38%	
  
30%	
  
44%	
  
28%	
  
37%	
  
18%	
  
31%	
  
37%	
  
35%	
  
22%	
  
38%	
  
38%	
  
19%	
  
33%	
  
27%	
  
37%	
  
36%	
  
25%	
  
33%	
  
36%	
  
29%	
  
25%	
  
35%	
  
26%	
  
26%	
  
29%	
  
37%	
  
36%	
  
34%	
  
22%	
  
35%	
  
36%	
  
64%	
  
46%	
  
58%	
  
65%	
  
62%	
  
61%	
  
79%	
  
47%	
  
51%	
  
63%	
  
68%	
  
64%	
  
45%	
  
59%	
  
66%	
  
67%	
  
65%	
  
63%	
  
65%	
  
56%	
  
64%	
  
73%	
  
62%	
  
71%	
  
79%	
  
61%	
  
61%	
  
70%	
  
52%	
  
64%	
  
69%	
  
72%	
  
69%	
  
64%	
  
67%	
  
61%	
  
60%	
  
48%	
  
61%	
  
65%	
  
68%	
  
72%	
  
62%	
  
56%	
  
53%	
  
54%	
  
64%	
  
48%	
  
59%	
  
60%	
  
60%	
  
Alabama	
  
Alaska	
  
Arizona	
  
Arkansas	
  
California	
  
Colorado	
  
Connec>cut	
  
Delaware	
  
District	
  of	
  Columbia	
  
Florida	
  
Georgia	
  
Hawaii	
  
Idaho	
  
Illinois	
  
Indiana	
  
Iowa	
  
Kansas	
  
Kentucky	
  
Louisiana	
  
Maine	
  
Maryland	
  
MassachuseMs	
  
Michigan	
  
Minnesota	
  
Mississippi	
  
Missouri	
  
Montana	
  
Nebraska	
  
Nevada	
  
New	
  Hampshire	
  
New	
  Jersey	
  
New	
  Mexico	
  
New	
  York	
  
North	
  Carolina	
  
North	
  Dakota	
  
Ohio	
  
Oklahoma	
  
Oregon	
  
Pennsylvania	
  
Rhode	
  Island	
  
South	
  Carolina	
  
South	
  Dakota	
  
Tennessee	
  
Texas	
  
Utah	
  
Vermont	
  
Virginia	
  
Washington	
  
West	
  Virginia	
  
Wisconsin	
  
Wyoming	
  
FIGURE 9 | NAEP EIGHTH GRADE PROFICIENCY RATES AND THE FALL 2010 COLLEGE ATTENDANCE
RATES FOR THE CLASS OF 2009
Source: National Center for Education Statistics
34 Report Card on American Education
CHAPTER TWO
DETAILED DATA FROM ARIZONA: WHAT
HAPPENS WHEN UNPREPARED STUDENTS
ATTEND COLLEGE
The Arizona Board of Regents commissioned Ari-
zona’s College Completion Report to specifically
track the entire public school class of 2006 through
the higher education system. The study provides
a great deal of insight into the consequences of
poor K-12 preparation for higher-education suc-
cess.8
The study makes use of the National Clear-
inghouse, which tracks student progress in public
and private universities across the country.
As indicated in Figure 9, the 2005 NAEP recorded
that only 22 percent of the Arizona eighth-grade
class of 2005 read proficiently, but that 58 per-
cent of students were attending college in the fall
of 2010. How does this play out as they move on
to college? The Arizona Republic summarized the
findings:
Half of the state’s public high schools saw 5 per-
cent or fewer of their graduates from 2006 earn
bachelor’s degrees, a new study finds.
And 62 percent of the college degrees earned by
the high-school Class of 2006 went to students
from just 40 of the state’s 460 high schools.
The report out today from the Arizona Board of
Regents is the first in the state to provide a snap-
shot of college-completion rates for individual
high schools. For six years, the regents tracked
53,392 Arizona students who graduated from
high school in the 2005-06 school year, regard-
less of whether they moved or attended college
out of state.
Using data from colleges nationwide, the report
found that 57 percent of the Arizona students
who graduated from high school in 2005-06
went on to college, but only 19 percent gradu-
ated from a four-year institution within six years.
An additional 6 percent graduated from a two-
year college or trade school.9
The eighth-grade NAEP reading scores of the ear-
ly years of the new millennium would lead one
to believe that the upper threshold percentage
for college preparedness was in the low 20s. Un-
doubtedly some students fail to complete college
because of algebra after getting through freshman
composition. Life has many other pitfalls to snare
college students as well. In Arizona, however, the
college completion rate was eerily close to what
NAEP eighth-grade reading scores suggested years
before: the Class of 2006 had a 23 percent read-
ing proficiency rate in 2002 when they were eighth
graders, and 18.6 percent had finished a four-year
degree six years after graduation from high school.
Only one word can describe these results: cata-
strophic. But this problem is not isolated to just
one state. Arizona’s reading proficiency rates for
eighth-grade students have plenty of company in
the low 20 percent range. A tracking study similar
to the one performed by the Arizona Board of Re-
gents in any of these other low-performing states
might reveal the same thing.
The higher education system certainly bears some
responsibility for this low graduation rate. Low en-
try standards set the tone for K-12, and in so doing
set up many Arizona students to fail. The univer-
sities and colleges take money from unprepared
kids and then proceed to flunk them out in droves.
They might play a more productive role by setting
some minimum standards related to college suc-
cess and communicate those standards forcefully
to the K-12 system.
Ultimately, however, responsibility for this prob-
lem primarily rests with the K-12 system. Higher
education officials can—and often will—frame ad-
mission issues as one of “access” and “opportuni-
ty.” Access and opportunity are indeed incredibly
important, but they are no substitute for proper
academic preparation.
There are a few bright spots, mostly found among
schools of choice in the state (charter and mag-
net), but on the whole, the 5 percent (or less) rate
of college graduates from half of Arizona’s schools
is unacceptable. Defenders of the system will be
quick to claim that Arizona’s relatively low spend-
ing per pupil is to blame, but this is factually untrue
for two reasons. First, Arizona administrators cur-
rently spend more than their predecessors from
www.alec.org 35
APPROPRIATELY EQUIPPING OUR STUDENTS TODAY FOR A PROSPEROUS TOMORROW
previous decades on a per-pupil basis after adjust-
ing for inflation. While rankings of state spend-
ing per pupil are a useful framing mechanism for
those seeking increased funding, spending has in-
creased substantially in all states.
Multiple rankings over many years allow spending
advocates to substitute as many as eight states at
any given time as 49th in per-pupil spending. The
truth is that all states spend far more than they
did in the past. Arizona would not spend its way
to high-quality schools, even if this was possible—
and it may not be. Much better should be expect-
ed from one of the most generously funded K-12
systems in the world.
The Arizona Board of Regents’ analysis should
be understood as a time capsule from the world
of 2006. Many of the state’s high-quality charter
school operators had few or no campuses gradu-
ating seniors in 2006. The Regents’ report did not
include private or home schools. NAEP shows that
the aggregate eighth-grade proficiency rate im-
proved from 22 percent in 2002 to 28 percent in
2013.
It is hard to escape the sinking feeling, however,
that this will prove too little, too late for the Grand
Canyon State at its current rate of improvement.
All states need to address their education policy
now if they want to meet the challenges of the
future.
CONCLUSION: LIGHT AT THE END OF THE TUN-
NEL OR ONCOMING TRAIN?
Age demographics positioned the 1980s and
1990s for strong economic growth. The large baby
boom population reached its prime earning years.
High rates of economic growth also produced larg-
er state tax revenues. Baby boom had turned to
“baby bust,” lowering the percentage of the popu-
lation in school and the associated costs. The large
size of the baby boom generation relative to the
number of retirees and children along with strong
economic growth allowed increased spending on
both the elderly and children. A similar pattern
of baby boom followed by bust, with increased
spending on both the young and the elderly, oc-
curred not just in the United States, but to varying
degrees throughout the developed world in the
latter half of the 20th century.10
This process, however, has already reversed. The
baby boom generation began qualifying for fed-
eral retirement benefits in 2008. The age demo-
graphic bounty of the late 20th century will force
difficult choices in the coming years. A consider-
able burden lies ahead for millennials as they si-
multaneously attempt to finance their parents’
elderly entitlements and the education of their
own children. More high school and college grad-
uates and fewer high school and college dropouts
among the youth of today would aid enormously
in facing the considerable challenges of tomorrow.
The concerns of American policymakers have con-
tinued to grow at a much faster pace than schools
have improved. Americans have faced even great-
er challenges in the past—the twin defeats of glob-
al fascism and communism come readily to mind.
The primary task facing American policymakers is
to secure a considerably higher return on each dol-
lar invested in the delivery of vital public services,
such as education and health care. Maintaining the
status quo is not an option, whether one views it
as benign or flawed.
Public funding for K-12 education is guaranteed in
every state constitution and strongly supported by
the public. It is here to stay, but policymakers need
to pursue far more robust reforms to get the edu-
cation system to work for all students as soon as
possible. Based on their reading scores, in 2013, all
states had a majority of students off-track to fin-
ish college. In 20 states, a quarter or fewer of their
students were on-track for college success based
on their reading scores alone. States universally
have huge percentages of students attending in-
stitutions of higher learning without the academic
knowledge and skills necessary for success.
36 Report Card on American Education
CHAPTER TWO
ENDNOTES
1.	 National Center for Education Statistics. 2015. “Postsecondary Attainment: Differences by Socioeconomic Status.”
Publication of the National Center for Education Statistics. May 2015. Available at http://nces.ed.gov/programs/coe/
indicator_tva.asp.National Center for Education Statistics. 2013.
2.	 “NAEP as an Indicator of Students’ Academic Preparedness for College.” Available at http://www.nationsreportcard.
gov/reading_math_g12_2013/#/preparedness.
3.	 Available at http://www.census.gov/compendia/statab/2012/tables/12s0276.pdf.
4.	 Petrilli, Mike. 2015. “Want More College Graduates? Improve Our K-12 System.” Thomas B. Fordham Institute. Available
at http://edexcellence.net/articles/want-more-college-graduates-improve-our-k%E2%80%9312-system.
5.	 The NAEP data explorer allows a user to get average scores for a jurisdiction and achievement percentages, but not the
percentage above a particular cut score. The reading cut score however corresponds with that of “Proficient or Better.”
6.	 ACT, Inc. 2013. “The Condition of College & Career Readiness 2013 National.” Publication of the ACT Inc. Available at
http://www.act.org/research/policymakers/cccr13/pdf/CCCR13-NationalReadinessRpt.pdf.
7.	 Ladner, Matthew and Dave Myslinski. 2013. “More Things in Heaven and Earth, Dr. Ravitch, than are Dreamt of in Your
Ideology.” Foundation for Excellence in Education. September 2013. Available at http://excelined.org/2013/09/20/
things-heaven-earth-dr-ravitch-dreamt-ideology-ravitch-vs-reality-part-iii/#sthash.EsDquE4A.dpuf.
8.	 Arizona Board of Regents. 2013. “Arizona College Completion Report.” Arizona Board of Regents, available at https://
azregents.asu.edu/Documents/AZ%20HS%20Class%20of%202005-06%20Postsecondary%20Outcomes%20After%20
Six%20Years%2011-5-13.pdf.
9.	 Ryman, Ann. 2013. “State’s high schools show huge disparity in college grad rates.”The Arizona Republic. Nov. 13, 2013.
Available at http://www.azcentral.com/news/arizona/articles/20131112arizona-high-schools-show-huge-disparity-
college-grad-rates.html?nclick_check=1.
10.	 Isaac, Julia B. 2009. “A Comparative Perspective on Public Spending on Children.” Brookings Institution. November
2009. Available at http://www.brookings.edu/~/media/Research/Files/Reports/2009/11/05%20spending%20chil-
dren%20isaacs/2_comparative_perspective_isaacs.PDF, page 15.
3CHAPTER
Student Performance and
State Education Policy Grades
38 Report Card on American Education
Student Performance and
State Education Policy Grades
Building on the past year’s state educa-
tion policy advances highlighted so far in
this Report Card, state policies can now
be viewed in context alongside each state’s stu-
dent performance.
The following state profiles underscore state ed-
ucation policies with a focus on academic prog-
ress. Keeping in mind that no two states started
at the same place, the states were evaluated on
their education systems based on absolute scores
combined with academic growth. This pushes
states with above-average education systems
not to rest on their laurels, but rather to strive
for even better results. At the same time, states
that have historically struggled but are mak-
ing remarkable gains receive due credit for their
progress.
Recognizing that this Report Card looks at a snap-
shot in time of student performance, the trends
seen over the past few years give insight into the
direction of each state’s K-12 system and can
guide policymakers as they seek to improve stu-
dent outcomes in their states.
RANKING STATES ON THE PERFORMANCE OF
GENERAL EDUCATION LOW-INCOME STUDENTS
Numerous studies reveal that children from
wealthier families tend to score better in the
classroom than those from low-income fami-
lies. This occurs for a variety of reasons, including
generally greater opportunities to learn more at
home. Thus they enter the school system with a
distinct advantage over their lower-income peers.
Consequently, students from lower-income fam-
ilies are more reliant upon the education system
for a majority of their education.
Like the previous four editions of the ALEC Report
Card, this edition focuses the impact of education
policy on disadvantaged students. The perfor-
mance ranking portion, however, examines how
well states are living up to the task of providing a
high-quality education for all students.
Each state has a unique student population.
Wealth and income levels vary wildly by state, as
does regional cost of living. States also have dif-
fering numbers of students who qualify as English
language learners or for an individualized educa-
tion program. Therefore, the following rankings
and grades are made as much of an “apples-to-ap-
ples” comparison as possible by evaluating states
based on similar students. In order to maximize
comparability, the ranking system judges each
state based on the NAEP performance of children
eligible for free or reduced-priced lunches under
the National School Lunch Program, which deter-
mines eligibility by family income. The ranking
system only looks at general education students
who are not enrolled in either special education
or English language learner programs.
By tracking the absolute performance and prog-
ress (or lack thereof) of general-education pro-
gram students from families with low incomes,
the vast differences among state K–12 popu-
lations in relation to a relatively common met-
ric are minimized. Comparing children from low-
income households outside special programs
across jurisdictions allows one to better assess
the relative success and/or failure of particular
public policies.
www.alec.org 39
STUDENT PERFORMANCE AND STATE EDUCATION POLICY GRADES
district schools, public charter schools, private
schools, homeschools and digital learning provid-
ers. These grades were partially based on mea-
sures and grading systems from education or-
ganizations and experts who analyzed various
aspects of education reform.
To develop each state’s overall policy grade, each
policy category was first analyzed individually.
For example, the Teacher Quality Policies catego-
ry has four components that determine its over-
all category grade, while Digital Learning has one
component. The subcategories were averaged
together to form category grades. Each state’s
six category grades were then given equal weight
and averaged together for the overall state poli-
cy grade.
POLICY CATEGORIES
In this 20th Report Card, state education policy
grades are composed of the following categories:
Academic Standards, Charter Schools, Home-
schooling, Private School Choice, Teacher Quali-
ty and Digital Learning. These categories remain
constant from the 19th Report Card, although in-
dividual components of those categories have
been updated as described below.
ACADEMIC STANDARDS
States’ academic standards lay the foundation for
what content knowledge is expected of students
as they progress through grade levels. Using data
provided by Paul Peterson and Matthew Acker-
man at EducationNext, this policy category exam-
ines the proficiency bar set by states as they com-
pare to those set by NAEP.1
States have generally
been subjected to political pressure to set their
proficiency bar low, giving the false illusion of ac-
ademic proficiency and creating false advertising
of their schools’ performances. In this policy cat-
egory, Peterson and Kaplan’s examination of each
state’s self-reported proficiency rates compared
to NAEP proficiency results were instructive.
CHARTER SCHOOLS
Charter schools are innovative public schools
that agree to meet performance standards set
These comparisons are imperfect, as no per-
fect comparisons exist. However, the compari-
sons here are much more equitable than a simple
comparison of state scores.
To calculate the performance rankings in this Re-
port Card, the scores of general-education low-
income students on each state’s four main 2003
to 2013 NAEP exams (fourth- and eighth-grade
reading and mathematics) were considered. This
Report Card examines two components of those
four exams: the actual scores on the 2013 NAEP;
and the gains (or losses) made between 2003 and
2013. The 2013 scores are given equal weight
with the gains made over the past decade. From
these numbers, states earn their performance
ranking.
One caveat regarding NAEP exams: NAEP gives
exams to random samples of students with mea-
surable ranges of sampling error. Sampling errors
are random in nature and thus the errors cancel
themselves out. (For example, if a state’s NAEP
4th grade reading test is randomly a bit on the
high end, it can be mitigated by another test be-
ing on the low end.) Overall, readers should take
greater note of whether their state falls on the
high, middle or low end of the rankings, rather
than fixating on an exact numerical ranking.
GRADING EDUCATION POLICIES
This Report Card is based on the presupposition
that a high-quality education should be available
to every child. Accordingly, as states make ad-
vances in education policies, the grading meth-
odology must take into account these advances.
OVERALL EDUCATION POLICY GRADE
The goal of these policy grades is to identify the
policies that provide all students with education-
al opportunities most appropriate for their indi-
vidual needs. The education policy grading sys-
tem evaluates state policies that place the focus
on the needs of individual students. Policy areas
include quality testing and accountability mech-
anisms; improving teacher quality; and expand-
ing parents’ abilities to choose the best learning
environment for their children, including public
40 Report Card on American Education
CHAPTER THREE
by governing authorities but are otherwise free
from most regulations governing traditional pub-
lic schools. This autonomy allows for new teach-
ing methods, special curricula and academic pro-
grams, and flexible governance policies, such as
holding longer school days. The charter school
grades note whether a state has a charter school
law and, if so, analyze how strong the law is in
supporting the success of charter schools. The
Center for Education Reform provides this infor-
mation in their annual Charter School Law Rank-
ing and Scorecard.2
HOMESCHOOLING REGULATION BURDEN LEVEL
Two million students are home schooled each year.
With an annual growth rate of approximately 5
percent, this is the fastest growing sector of school
options. The homeschooling regulation burden
level indicates the regulatory requirements par-
ents face when homeschooling their children. The
Home School Legal Defense Association rates the
states’ homeschooling oversight in four catego-
ries: “none,” “low,” “moderate” and “high.”3
PRIVATE SCHOOL CHOICE
A growing body of empirical evidence suggests
that private school policies that allow families to
choose the best school for their children yield pos-
itive outcomes, including improved family satisfac-
tion, higher academic achievement and improved
graduation rates. For these reasons, each state is
evaluatedonwhetherithasaprivateschoolchoice
program, such as vouchers or scholarships, tuition
or scholarship tax credits or education savings ac-
counts. Several factors determine grades, includ-
ing statewide student eligibility for private school
choice programs, the purchasing power these pro-
grams provide for families and budget caps, which
limit the availability of these programs for families.
This analysis is based on a review of state school
choice policies and is supported by research from
the Friedman Foundation for Educational Choice.4
TEACHER QUALITY POLICIES
Academic research shows that the greatest de-
termining factor regarding a student’s academic
success within a school is teacher effectiveness.
Every student deserves the opportunity to learn
from a great teacher. This category looks at states’
abilities to provide high-quality teachers in each
classroom, ensuring students aren’t subjected
to ineffective teachers. The National Council on
Teacher Quality’s 2014 State Teacher Policy Year-
book provides grades for how well states identi-
fy high-quality teachers, retain effective teachers
and remove ineffective ones.5
DIGITAL LEARNING
A fast-changing state education policy is digital
learning. These policy grades are derived from
the Foundation for Excellence in Education’s 2014
Digital Learning Now initiative, which produc-
es its annual Digital Learning Report Card. States
are measured on their progress toward creating a
statewide environment that supports high-quality
digital learning options for all students.6
POLICY GRADE METHODOLOGY
States’ education policy grades were calculated in
the following manner. First, all analyses were con-
vertedintolettergradeswherepossible.Forexam-
ple, homeschooling regulation burden levels were
converted as such: none = A, low = B, moderate = C
and high = D. Next, all letter grades were convert-
ed to a numerical score based on a grade point av-
erage scale (A=4, B=3, C=2, D=1, F=0). Those scores
were tallied and divided by the number of catego-
ries in which a score was present.
For some categories, grades were awarded
with pluses and minuses, and numerical conver-
sions were altered appropriately. A grade of B-,
for example, was converted to a numeric score
of 2.667, while a C+ was converted to 2.333.)
ADDITIONAL INFORMATION
In addition to the policy grades and performance
rankings, each state profile contains additional in-
formation, such as per-pupil spending levels and
student populations. This data is purely for infor-
mational purposes and is not included in the grad-
ing or ranking of the states.7 8 9 10
www.alec.org 41
STUDENT PERFORMANCE AND STATE EDUCATION POLICY GRADES
Table 1 | LETTER GRADE KEY
Grade Low Score High Score
A 3.834 4.166
A- 3.5 3.833
B+ 3.167 3.499
B 2.834 3.166
B- 2.5 2.833
C+ 2.167 2.499
C 1.834 2.166
C- 1.5 1.833
D+ 1.167 1.499
D 0.834 1.166
D- 0.5 0.833
F 0.00 0.499
ENDNOTES
1.	 	 Peterson, Paul and Matthew Ackerman. “States Raise Proficiency Standards in Math and Reading: Commitments to
Common Core may be Driving the Proficiency Bar Upward”. EducationNext. Summer 2015. Available at http://educa-
tionnext.org/states-raise-proficiency-standards-math-reading/.
2.	 Consoletti, Alison Zgainer and Kara Kerwin “Charter School Laws across the States: 2015 Rankings and Scorecard.”
Center for Education Reform. Available at https://www.edreform.com/2015/03/charter-school-laws-across-the-states-
2015-rankings-scorecard/.
3.	 Home School Legal Defense Association. “State Laws.” Available at http://www.hslda.org/laws/default.asp.
4.	 “School Choice by State.” Friedman Foundation for Educational Choice. Available at http://www.edchoice.org/school-
choice/school-choice-in-america/.
5.	 “State Teacher Policy Yearbook.” National Council on Teacher Quality. Available at http://www.nctq.org/statePoli-
cy/2014/statePolicyFindings.do?stateId=1.
6.	 “2014 Digital Learning Report Card.” Digital Learning Now. Available at http://www.digitallearningnow.com.
7.	 “Common Core of Data.” National Center for Education Statistics, Institute of Education Sciences. Available at http://
nces.ed.gov/ccd/tables/ACGR_2010-11_to_2012-13.asp.
8.	 “Public High School 4-year Adjusted Cohort Graduation Rate (ACGR) for the United States, the 50 states and the District
of Columbia: School years 2010-11 to 2012-13.” (n.d.). Common Core of Data. National Center for Education Statistics
Online. Available at http://nces.ed.gov/ccd/tables/ACGR_2010-11_to_2012-13.asp.
9.	 “Public Education Finances: 2013.” United States Census Bureau, U.S. Department of Commerce. Available at http://
www2.census.gov/govs/school/13f33pub.pdf.
10.	 “Elementary/Secondary Information System.” National Center for Education Statistics, Institute of Education Sciences.
Available at http://nces.ed.gov/ccd/elsi/tableGenerator.aspx.
42 Report Card on American Education
CHAPTER THREE
www.alec.org 43
STATE SNAPSHOTS
NAEP Scores for Low-Income General Education
Students (2003-2013)
NAEP Low-Income General Education Student
Score Distribution (2013)
442013 NAEP Performance Rank
ALEC Historical Ranking 2009 NAEP: 40th
| 2011 NAEP: 34th
Measures the overall scores for low-income general education
students (non-ELL and non-IEP) and their gains/losses on the
National Assessment of Educational Progress (NAEP) fourth-
and eighth-grade reading and mathematics exams from 2003
to 2013.
n	States AL
outperformed
Education Policy Grade
ALEC Historical Grading 	 2011: D+ | 2012: D+ | 2013: D+
Grades state-level education policies that provide high-quality
educational options to all students.
0
25
50
75
100
At Proficient
At Advanced
At Basic
Below Basic
4th-Grade
Reading
8th-Grade
Reading
4th-Grade
Math
8th-Grade
Math
3%
18%
38%
15%
48%
37%
18%
50%
31%
8%
42%
50%42%
0%
25%
50%
75%
100% 2% 1% 1% 0%
200
213
214
238
268
BASIC
PROFICIENT
ADVANCED
4th-Grade
Reading
8th-Grade
Reading
4th-Grade
Math
8th-Grade
Math
2003 2013
248
252 217
226
254
261
243
281
323
214
249
282
262
299
333
D
State Academic Standards F
Charter Schools
Charter Schools Allowed	 No
Charter School Law Grade —
Homeschool Regulation Burden	
(A=None, B=Low, C=Moderate, D=High)
B
Private School Choice Programs C
Teacher Quality and Policies:
Overall Grade
D
Delivering Well Prepared Teachers B-
Expanding the Teaching Pool C
Identifying Effective Teachers D
Retaining Effective Teachers D-
Exiting Ineffective Teachers D
Digital Learning D-
The Cotton State
Alabama
Graduation Rate
Average
Class Size
Annual Cost Per
Student
71.8% 15.77 $9,874
Supplemental Information
(The following is provided solely for informative reasons. It does not
influence the above grade or ranking.)
14.6%
31.6%
53.8%
Funding Sources
Federal Funds
State Funds
Local Funds
44 Report Card on American Education
2014 STUDENT PERFORMANCE AND STATE EDUCATION POLICY GRADES INDEX
The Last Frontier
Alaska
NAEP Scores for Low-Income General Education
Students (2003-2013)
NAEP Low-Income General Education Student
Score Distribution (2013)
392013 NAEP Performance Rank
ALEC Historical Ranking 2009 NAEP: 11th
| 2011 NAEP: 32nd
Measures the overall scores for low-income general education
students (non-ELL and non-IEP) and their gains/losses on the
National Assessment of Educational Progress (NAEP) fourth-
and eighth-grade reading and mathematics exams from 2003
to 2013.
n	States AK
outperformed
Education Policy Grade
ALECHistoricalGrading 2011:B-|2012:C-|2013:C-
Grades state-level education policies that provide high-quality
educational options to all students.
0
25
50
75
100
At Proficient
At Advanced
At Basic
Below Basic
4th-Grade
Reading
8th-Grade
Reading
4th-Grade
Math
8th-Grade
Math
3%
19%
37%
24%
51%
24%
28%
50%
19%
24%
47%
25%
41%
0%
25%
50%
75%
100% 3% 1% 3% 3%
243
281
323
214
249
282
262
299
333
207 213214
238
268
BASIC
PROFICIENT
ADVANCED
4th-Grade
Reading
8th-Grade
Reading
4th-Grade
Math
8th-Grade
Math
2003 2013
252
262 229
236
273
282
D+
State Academic Standards D+
Charter Schools
Charter Schools Allowed	 Yes
Charter School Law Grade D
Home School Regulation Burden	
(A=None, B=Low, C=Moderate, D=High)
A
Private School Choice Programs F
Teacher Quality and Policies:
Overall Grade
D
Delivering Well Prepared Teachers F
Expanding the Teaching Pool D
Identifying Effective Teachers D+
Retaining Effective Teachers D
Exiting Ineffective Teachers D-
Digital Learning D+
Graduation Rate
Average
Class Size
Annual Cost Per
Student
75.5% 16.29 $17,902
Supplemental Information
(The following is provided solely for informative reasons. It does not
influence the above grade or ranking.)
17.8%22.1%
60.1%
Funding Sources
Federal Funds
State Funds
Local Funds
www.alec.org 44G
www.alec.org 45
STATE SNAPSHOTS
The Grand Canyon State
Arizona
NAEP Scores for Low-Income General Education
Students (2003-2013)
NAEP Low-Income General Education Student
Score Distribution (2013)
472013 NAEP Performance Rank
ALEC Historical Ranking 2009 NAEP: 45th
| 2011 NAEP: 36th
Measures the overall scores for low-income general education
students (non-ELL and non-IEP) and their gains/losses on the
National Assessment of Educational Progress (NAEP) fourth-
and eighth-grade reading and mathematics exams from 2003
to 2013.
n	States AZ
outperformed
Education Policy Grade
ALEC Historical Grading 	 2011: B | 2012: B+| 2013: B-
Grades state-level education policies that provide high-quality
educational options to all students.
0
25
50
75
100
At Proficient
At Advanced
At Basic
Below Basic
4th-Grade
Reading
8th-Grade
Reading
4th-Grade
Math
8th-Grade
Math
3%
17%
37%
18%
50%
31%
28%
51%
18%
18%
43%
36%44%
0%
25%
50%
75%
100% 1% 1% 3% 2%
243
281
323
214
249
282
262
299
333
204
211214
238
268
BASIC
PROFICIENT
ADVANCED
4th-Grade
Reading
8th-Grade
Reading
4th-Grade
Math
8th-Grade
Math
2003 2013
252 256 225
236
266
273
B-
State Academic Standards C
Charter Schools
Charter Schools Allowed	 Yes
Charter School Law Grade A
Homeschool Regulation Burden	
(A=None, B=Low, C=Moderate, D=High)
B
Private School Choice Programs A
Teacher Quality and Policies:
Overall Grade
C-
Delivering Well Prepared Teachers D
Expanding the Teaching Pool C-
Identifying Effective Teachers C
Retaining Effective Teachers C
Exiting Ineffective Teachers D+
Digital Learning C+
Graduation Rate
Average
Class Size
Annual Cost Per
Student
74.7% 20.75 $8,806
Supplemental Information
(The following is provided solely for informative reasons. It does not
influence the above grade or ranking.)
14.9%
48.4%
36.6%
Funding Sources
Federal Funds
State Funds
Local Funds
46 Report Card on American Education
2014 STUDENT PERFORMANCE AND STATE EDUCATION POLICY GRADES INDEX
The Natural State
Arkansas
NAEP Scores for Low-Income General Education
Students (2003-2013)
NAEP Low-Income General Education Student
Score Distribution (2013)
452013 NAEP Performance Rank
ALEC Historical Ranking 2009 NAEP: 44th
| 2011 NAEP: 45th
Measures the overall scores for low-income general education
students (non-ELL and non-IEP) and their gains/losses on the
National Assessment of Educational Progress (NAEP) fourth-
and eighth-grade reading and mathematics exams from 2003
to 2013.
n	States AR
outperformed
Education Policy Grade
ALEC Historical Grading 2011: C | 2012: C | 2013: D+
Grades state-level education policies that provide high-quality
educational options to all students.
0
25
50
75
100
At Proficient
At Advanced
At Basic
Below Basic
4th-Grade
Reading
8th-Grade
Reading
4th-Grade
Math
8th-Grade
Math
3%
22%
39%
23%
48%
28%
29%
50%
18%
17%
45%
36%35%
0%
25%
50%
75%
100%
4% 1% 2% 2%
243
281
323
214
249
282
262
299
333
210
218
214
238
268
BASIC
PROFICIENT
ADVANCED
4th-Grade
Reading
8th-Grade
Reading
4th-Grade
Math
8th-Grade
Math
2003 2013
256 260 226
236
266
273
C
State Academic Standards D
Charter Schools
Charter Schools Allowed	 Yes
Charter School Law Grade D
Homeschool Regulation Burden	
(A=None, B=Low, C=Moderate, D=High)
C
Private School Choice Programs B
Teacher Quality and Policies:
Overall Grade
B-
Delivering Well Prepared Teachers C+
Expanding the Teaching Pool B
Identifying Effective Teachers C-
Retaining Effective Teachers B-
Exiting Ineffective Teachers C-
Digital Learning C
Graduation Rate
Average
Class Size
Annual Cost Per
Student
75.0% 12.9 $10,844
Supplemental Information
(The following is provided solely for informative reasons. It does not
influence the above grade or ranking.)
16.0%
12.2%
71.8%
Funding Sources
Federal Funds
State Funds
Local Funds
www.alec.org 47
STATE SNAPSHOTS
The Golden State
California
NAEP Scores for Low-Income General Education
Students (2003-2013)
NAEP Low-Income General Education Student
Score Distribution (2013)
272013 NAEP Performance Rank
ALEC Historical Ranking 2009 NAEP: 30th
| 2011 NAEP: 30th
Measures the overall scores for low-income general education
students (non-ELL and non-IEP) and their gains/losses on the
National Assessment of Educational Progress (NAEP) fourth-
and eighth-grade reading and mathematics exams from 2003
to 2013.
n	States CA
outperformed
Education Policy Grade
ALEC Historical Grading 	 2011: B | 2012: C+| 2013: C
Grades state-level education policies that provide high-quality
educational options to all students.
0
25
50
75
100
At Proficient
At Advanced
At Basic
Below Basic
4th-Grade
Reading
8th-Grade
Reading
4th-Grade
Math
8th-Grade
Math
3%
19%
38%
21%
54%
25%
25%
49%
22%
17%
45%
35%40%
0%
25%
50%
75%
100%
3% 1% 3% 2%
243
281
323
214
249
282
262
299
333
201
215
214
238
268
BASIC
PROFICIENT
ADVANCED
4th-Grade
Reading
8th-Grade
Reading
4th-Grade
Math
8th-Grade
Math
2003 2013
252
261 224
234
262
273
C-
State Academic Standards C+
Charter Schools
Charter Schools Allowed	 Yes
Charter School Law Grade B
Homeschool Regulation Burden	
(A=None, B=Low, C=Moderate, D=High)
B
Private School Choice Programs F
Teacher Quality and Policies:
Overall Grade
D+
Delivering Well Prepared Teachers D+
Expanding the Teaching Pool C-
Identifying Effective Teachers D-
Retaining Effective Teachers C+
Exiting Ineffective Teachers F
Digital Learning D-
Graduation Rate
Average
Class Size
Annual Cost Per
Student
78.2% 19.8 $10,581
Supplemental Information
(The following is provided solely for informative reasons. It does not
influence the above grade or ranking.)
14.6%
30.4%
55.0%
Funding Sources
Federal Funds
State Funds
Local Funds
48 Report Card on American Education
2014 STUDENT PERFORMANCE AND STATE EDUCATION POLICY GRADES INDEX
The Centennial State
Colorado
NAEP Scores for Low-Income General Education
Students (2003-2013)
NAEP Low-Income General Education Student
Score Distribution (2013)
52013 NAEP Performance Rank
ALEC Historical Ranking 2009 NAEP: 17th
| 2011 NAEP: 4th
Measures the overall scores for low-income general education
students (non-ELL and non-IEP) and their gains/losses on the
National Assessment of Educational Progress (NAEP) fourth-
and eighth-grade reading and mathematics exams from 2003
to 2013.
n	States CO
outperformed
Education Policy Grade
ALEC Historical Grading 2011: B | 2012: C+| 2013: C+
Grades state-level education policies that provide high-quality
educational options to all students.
0
25
50
75
100
At Proficient
At Advanced
At Basic
Below Basic
4th-Grade
Reading
8th-Grade
Reading
4th-Grade
Math
8th-Grade
Math
3%
25%
43%
27%
51%
20%
35%
47%
12%
25%
43%
27%27%
0%
25%
50%
75%
100%
5% 2% 5% 5%
243
281
323
214
249
282
262
299
333
216
223
214
238
268
BASIC
PROFICIENT
ADVANCED
4th-Grade
Reading
8th-Grade
Reading
4th-Grade
Math
8th-Grade
Math
2003 2013
257
266
227
243
269
282
C
State Academic Standards B
Charter Schools
Charter Schools Allowed	 Yes
Charter School Law Grade B
Homeschool Regulation Burden	
(A=None, B=Low, C=Moderate, D=High)
C
Private School Choice Programs F
Teacher Quality and Policies:
Overall Grade
C+
Delivering Well Prepared Teachers D-
Expanding the Teaching Pool D+
Identifying Effective Teachers B-
Retaining Effective Teachers C
Exiting Ineffective Teachers A
Digital Learning D+
Graduation Rate
Average
Class Size
Annual Cost Per
Student
79.8% 16.97 $10,421
Supplemental Information
(The following is provided solely for informative reasons. It does not
influence the above grade or ranking.)
11.1%
48.7%
40.2%
Funding Sources
Federal Funds
State Funds
Local Funds
www.alec.org 49
STATE SNAPSHOTS
The Constitution State
Connecticut
NAEP Scores for Low-Income General Education
Students (2003-2013)
NAEP Low-Income General Education Student
Score Distribution (2013)
372013 NAEP Performance Rank
ALEC Historical Ranking 2009 NAEP: 29th
| 2011 NAEP: 39th
Measures the overall scores for low-income general education
students (non-ELL and non-IEP) and their gains/losses on the
National Assessment of Educational Progress (NAEP) fourth-
and eighth-grade reading and mathematics exams from 2003
to 2013.
n	States CT
outperformed
Education Policy Grade
ALEC Historical Grading 	 2011: C+ | 2012: C-| 2013: C-
Grades state-level education policies that provide high-quality
educational options to all students.
0
25
50
75
100
At Proficient
At Advanced
At Basic
Below Basic
4th-Grade
Reading
8th-Grade
Reading
4th-Grade
Math
8th-Grade
Math
3%
20%
43%
27%
50%
21%
23%
49%
27%
17%
43%
37%34%
0%
25%
50%
75%
100%
3% 2% 2% 3%
243
281
323
214
249
282
262
299
333
211
218
214
238
268
BASIC
PROFICIENT
ADVANCED
4th-Grade
Reading
8th-Grade
Reading
4th-Grade
Math
8th-Grade
Math
2003 2013
252
265
223
230
267
273
C-
State Academic Standards C-
Charter Schools
Charter Schools Allowed	 Yes
Charter School Law Grade D
Homeschool Regulation Burden	
(A=None, B=Low, C=Moderate, D=High)
A
Private School Choice Programs F
Teacher Quality and Policies:
Overall Grade
B-
Delivering Well Prepared Teachers B-
Expanding the Teaching Pool C+
Identifying Effective Teachers B
Retaining Effective Teachers C
Exiting Ineffective Teachers C-
Digital Learning F
Graduation Rate
Average
Class Size
Annual Cost Per
Student
75.1% 12.94 $18,061
Supplemental Information
(The following is provided solely for informative reasons. It does not
influence the above grade or ranking.)
8.3%
58.6%
33.1%
Funding Sources
Federal Funds
State Funds
Local Funds
50 Report Card on American Education
2014 STUDENT PERFORMANCE AND STATE EDUCATION POLICY GRADES INDEX
The First State
Delaware
NAEP Scores for Low-Income General Education
Students (2003-2013)
NAEP Low-Income General Education Student
Score Distribution (2013)
282013 NAEP Performance Rank
ALEC Historical Ranking 2009 NAEP: 19th
| 2011 NAEP: 22nd
Measures the overall scores for low-income general education
students (non-ELL and non-IEP) and their gains/losses on the
National Assessment of Educational Progress (NAEP) fourth-
and eighth-grade reading and mathematics exams from 2003
to 2013.
n	States DE
outperformed
Education Policy Grade
ALEC Historical Grading 2011: C+ | 2012: C| 2013: C
Grades state-level education policies that provide high-quality
educational options to all students.
0
25
50
75
100
At Proficient
At Advanced
At Basic
Below Basic
4th-Grade
Reading
8th-Grade
Reading
4th-Grade
Math
8th-Grade
Math
3%
24%
41%
22%
52%
25%
29%
54%
14%
19%
47%
32%30%
0%
25%
50%
75%
100%
5% 1% 3% 2%
243
281
323
214
249
282
262
299
333
214
222
214
238
268
BASIC
PROFICIENT
ADVANCED
4th-Grade
Reading
8th-Grade
Reading
4th-Grade
Math
8th-Grade
Math
2003 2013
256 261 228
238
267
276
C-
State Academic Standards C
Charter Schools
Charter Schools Allowed	 Yes
Charter School Law Grade C
Homeschool Regulation Burden	
(A=None, B=Low, C=Moderate, D=High)
B
Private School Choice Programs F
Teacher Quality and Policies:
Overall Grade
C+
Delivering Well Prepared Teachers B-
Expanding the Teaching Pool C+
Identifying Effective Teachers B
Retaining Effective Teachers C
Exiting Ineffective Teachers D
Digital Learning D-
Graduation Rate
Average
Class Size
Annual Cost Per
Student
75.5% 14.68 $14,280
Supplemental Information
(The following is provided solely for informative reasons. It does not
influence the above grade or ranking.)
11.2%
29.8%
59.0%
Funding Sources
Federal Funds
State Funds
Local Funds
www.alec.org 51
STATE SNAPSHOTS
The Federal City
District of Columbia
NAEP Scores for Low-Income General Education
Students (2003-2013)
NAEP Low-Income General Education Student
Score Distribution (2013)
222013 NAEP Performance Rank
ALEC Historical Ranking 2009 NAEP: 26th
| 2011 NAEP: 24th
Measures the overall scores for low-income general education
students (non-ELL and non-IEP) and their gains/losses on the
National Assessment of Educational Progress (NAEP) fourth-
and eighth-grade reading and mathematics exams from 2003
to 2013.
n	States D.C.
outperformed
Education Policy Grade
ALEC Historical Grading 	 2011: B | 2012: B-| 2013: B-
Grades state-level education policies that provide high-quality
educational options to all students.
0
25
50
75
100
At Proficient
At Advanced
At Basic
Below Basic
4th-Grade
Reading
8th-Grade
Reading
4th-Grade
Math
8th-Grade
Math
3%
13%
32%
13%
47%
40%
19%
46%
34%
14%
42%
43%53%
0%
25%
50%
75%
100%
2% 1% 2%
243
281
323
214
249
282
262
299
333
186
204214
238
268
BASIC
PROFICIENT
ADVANCED
4th-Grade
Reading
8th-Grade
Reading
4th-Grade
Math
8th-Grade
Math
2003 2013
236
250
203
225
241
267
C-
State Academic Standards C
Charter Schools
Charter Schools Allowed	 Yes
Charter School Law Grade A
Homeschool Regulation Burden	
(A=None, B=Low, C=Moderate, D=High)
C
Private School Choice Programs D
Teacher Quality and Policies:
Overall Grade
D+
Delivering Well Prepared Teachers C-
Expanding the Teaching Pool C
Identifying Effective Teachers D
Retaining Effective Teachers F
Exiting Ineffective Teachers D
Digital Learning –
Graduation Rate
Average
Class Size
Annual Cost Per
Student
59.9% 11.86 $29,029
Supplemental Information
(The following is provided solely for informative reasons. It does not
influence the above grade or ranking.)
12.1%
87.9%
Funding Sources
Federal Funds
State Funds (N/A)
Local Funds
52 Report Card on American Education
2014 STUDENT PERFORMANCE AND STATE EDUCATION POLICY GRADES INDEX
The Sunshine State
Florida
NAEP Scores for Low-Income General Education
Students (2003-2013)
NAEP Low-Income General Education Student
Score Distribution (2013)
102013 NAEP Performance Rank
ALEC Historical Ranking 2009 NAEP: 3rd
| 2011 NAEP: 12th
Measures the overall scores for low-income general education
students (non-ELL and non-IEP) and their gains/losses on the
National Assessment of Educational Progress (NAEP) fourth-
and eighth-grade reading and mathematics exams from 2003
to 2013.
n	States FL
outperformed
Education Policy Grade
ALEC Historical Grading 2011: B+ | 2012: B | 2013: B
Grades state-level education policies that provide high-quality
educational options to all students.
0
25
50
75
100
At Proficient
At Advanced
At Basic
Below Basic
4th-Grade
Reading
8th-Grade
Reading
4th-Grade
Math
8th-Grade
Math
3%
27%
43%
25%
51%
23%
30%
52%
15%
20%
44%
32%24%
0%
25%
50%
75%
100%
5% 1% 3% 3%
243
281
323
214
249
282
262
299
333
213
226
214
238
268
BASIC
PROFICIENT
ADVANCED
4th-Grade
Reading
8th-Grade
Reading
4th-Grade
Math
8th-Grade
Math
2003 2013
254
263 228
239
265
277
B
State Academic Standards B
Charter Schools
Charter Schools Allowed	 Yes
Charter School Law Grade B
Homeschool Regulation Burden	
(A=None, B=Low, C=Moderate, D=High)
C
Private School Choice Programs A
Teacher Quality and Policies:
Overall Grade
B+
Delivering Well Prepared Teachers B+
Expanding the Teaching Pool B
Identifying Effective Teachers B+
Retaining Effective Teachers B+
Exiting Ineffective Teachers B-
Digital Learning A-
Graduation Rate
Average
Class Size
Annual Cost Per
Student
70.8% 14.33 $10,031
Supplemental Information
(The following is provided solely for informative reasons. It does not
influence the above grade or ranking.)
17.8%
47.9%
34.3%
Funding Sources
Federal Funds
State Funds
Local Funds
www.alec.org 53
STATE SNAPSHOTS
The Peach State
Georgia
NAEP Scores for Low-Income General Education
Students (2003-2013)
NAEP Low-Income General Education Student
Score Distribution (2013)
232013 NAEP Performance Rank
ALEC Historical Ranking 2009 NAEP: 27th
| 2011 NAEP: 27th
Measures the overall scores for low-income general education
students (non-ELL and non-IEP) and their gains/losses on the
National Assessment of Educational Progress (NAEP) fourth-
and eighth-grade reading and mathematics exams from 2003
to 2013.
n	States GA
outperformed
Education Policy Grade
ALEC Historical Grading 	 2011: B | 2012: B- | 2013: C+
Grades state-level education policies that provide high-quality
educational options to all students.
0
25
50
75
100
At Proficient
At Advanced
At Basic
Below Basic
4th-Grade
Reading
8th-Grade
Reading
4th-Grade
Math
8th-Grade
Math
3%
20%
36%
21%
50%
28%
25%
50%
22%
17%
43%
37%40%
0%
25%
50%
75%
100%
4% 1% 3% 2%
243
281
323
214
249
282
262
299
333
204
215
214
238
268
BASIC
PROFICIENT
ADVANCED
4th-Grade
Reading
8th-Grade
Reading
4th-Grade
Math
8th-Grade
Math
2003 2013
249
259 222
234
257
272
C+
State Academic Standards F
Charter Schools
Charter Schools Allowed	 Yes
Charter School Law Grade C
Homeschool Regulation Burden	
(A=None, B=Low, C=Moderate, D=High)
B
Private School Choice Programs B
Teacher Quality and Policies:
Overall Grade
B-
Delivering Well Prepared Teachers C+
Expanding the Teaching Pool B
Identifying Effective Teachers C+
Retaining Effective Teachers C
Exiting Ineffective Teachers B+
Digital Learning B
Graduation Rate
Average
Class Size
Annual Cost Per
Student
69.9% 14.39 $10,821
Supplemental Information
(The following is provided solely for informative reasons. It does not
influence the above grade or ranking.)
12.6%
45.9%
41.6%
Funding Sources
Federal Funds
State Funds
Local Funds
54 Report Card on American Education
2014 STUDENT PERFORMANCE AND STATE EDUCATION POLICY GRADES INDEX
The Aloha State
Hawaii
NAEP Scores for Low-Income General Education
Students (2003-2013)
NAEP Low-Income General Education Student
Score Distribution (2013)
62013 NAEP Performance Rank
ALEC Historical Ranking 2009 NAEP: 15th
| 2011 NAEP: 13th
Measures the overall scores for low-income general education
students (non-ELL and non-IEP) and their gains/losses on the
National Assessment of Educational Progress (NAEP) fourth-
and eighth-grade reading and mathematics exams from 2003
to 2013.
n	States HI
outperformed
Education Policy Grade
ALEC Historical Grading 2011: C+ | 2012: C-| 2013: C-
Grades state-level education policies that provide high-quality
educational options to all students.
0
25
50
75
100
At Proficient
At Advanced
At Basic
Below Basic
4th-Grade
Reading
8th-Grade
Reading
4th-Grade
Math
8th-Grade
Math
3%
18%
36%
25%
51%
23%
35%
45%
14%
26%
46%
24%
42%
0%
25%
50%
75%
100% 3% 1% 5% 5%
243
281
323
214
249
282
262
299
333
206
213214
238
268
BASIC
PROFICIENT
ADVANCED
4th-Grade
Reading
8th-Grade
Reading
4th-Grade
Math
8th-Grade
Math
2003 2013
251
263
222
242
263
284
D+
State Academic Standards C
Charter Schools
Charter Schools Allowed	 Yes
Charter School Law Grade C
Homeschool Regulation Burden	
(A=None, B=Low, C=Moderate, D=High)
C
Private School Choice Programs F
Teacher Quality and Policies:
Overall Grade
D+
Delivering Well Prepared Teachers D-
Expanding the Teaching Pool F
Identifying Effective Teachers B
Retaining Effective Teachers C+
Exiting Ineffective Teachers D
Digital Learning D
Graduation Rate
Average
Class Size
Annual Cost Per
Student
75.4% 15.71 $13,917
Supplemental Information
(The following is provided solely for informative reasons. It does not
influence the above grade or ranking.)
13.9%
2.5%
83.6%
Funding Sources
Federal Funds
State Funds
Local Funds
www.alec.org 55
STATE SNAPSHOTS
The Gem State
Idaho
NAEP Scores for Low-Income General Education
Students (2003-2013)
NAEP Low-Income General Education Student
Score Distribution (2013)
332013 NAEP Performance Rank
ALEC Historical Ranking 2009 NAEP: 22nd
| 2011 NAEP: 29th
Measures the overall scores for low-income general education
students (non-ELL and non-IEP) and their gains/losses on the
National Assessment of Educational Progress (NAEP) fourth-
and eighth-grade reading and mathematics exams from 2003
to 2013.
n	States ID
outperformed
Education Policy Grade
ALEC Historical Grading 	 2011: B- | 2012: B-| 2013: C
Grades state-level education policies that provide high-quality
educational options to all students.
0
25
50
75
100
At Proficient
At Advanced
At Basic
Below Basic
4th-Grade
Reading
8th-Grade
Reading
4th-Grade
Math
8th-Grade
Math
3%
22%
39%
29%
52%
17%
30%
51%
16%
24%
48%
23%35%
0%
25%
50%
75%
100%
4% 2% 4% 4%
243
281
323
214
249
282
262
299
333
217 219
214
238
268
BASIC
PROFICIENT
ADVANCED
4th-Grade
Reading
8th-Grade
Reading
4th-Grade
Math
8th-Grade
Math
2003 2013
263 268 233 238 277
283
C
State Academic Standards D
Charter Schools
Charter Schools Allowed	 Yes
Charter School Law Grade B
Homeschool Regulation Burden	
(A=None, B=Low, C=Moderate, D=High)
A
Private School Choice Programs F
Teacher Quality and Policies:
Overall Grade
D+
Delivering Well Prepared Teachers D+
Expanding the Teaching Pool D
Identifying Effective Teachers C-
Retaining Effective Teachers D-
Exiting Ineffective Teachers D
Digital Learning C
Graduation Rate
Average
Class Size
Annual Cost Per
Student
84.0% 18.18 $7,863
Supplemental Information
(The following is provided solely for informative reasons. It does not
influence the above grade or ranking.)
14.0%
22.8%
63.2%
Funding Sources
Federal Funds
State Funds
Local Funds
56 Report Card on American Education
2014 STUDENT PERFORMANCE AND STATE EDUCATION POLICY GRADES INDEX
The Prairie State
Illinois
NAEP Scores for Low-Income General Education
Students (2003-2013)
NAEP Low-Income General Education Student
Score Distribution (2013)
302013 NAEP Performance Rank
ALEC Historical Ranking 2009 NAEP: 38th
| 2011 NAEP: 28th
Measures the overall scores for low-income general education
students (non-ELL and non-IEP) and their gains/losses on the
National Assessment of Educational Progress (NAEP) fourth-
and eighth-grade reading and mathematics exams from 2003
to 2013.
n	States IL
outperformed
Education Policy Grade
ALEC Historical Grading 2011: C+ | 2012: C | 2013: C
Grades state-level education policies that provide high-quality
educational options to all students.
0
25
50
75
100
At Proficient
At Advanced
At Basic
Below Basic
4th-Grade
Reading
8th-Grade
Reading
4th-Grade
Math
8th-Grade
Math
3%
18%
38%
23%
51%
25%
24%
50%
23%
20%
45%
32%42%
0%
25%
50%
75%
100%
2% 1% 3% 3%
243
281
323
214
249
282
262
299
333
206
213
214
238
268
BASIC
PROFICIENT
ADVANCED
4th-Grade
Reading
8th-Grade
Reading
4th-Grade
Math
8th-Grade
Math
2003 2013
254
261
221
233
264
276
C+
State Academic Standards B-
Charter Schools
Charter Schools Allowed	 Yes
Charter School Law Grade C
Homeschool Regulation Burden	
(A=None, B=Low, C=Moderate, D=High)
A
Private School Choice Programs C
Teacher Quality and Policies:
Overall Grade
C+
Delivering Well Prepared Teachers D+
Expanding the Teaching Pool C-
Identifying Effective Teachers C+
Retaining Effective Teachers C-
Exiting Ineffective Teachers A
Digital Learning D-
Graduation Rate
Average
Class Size
Annual Cost Per
Student
81.9% 15.19 $13,848
Supplemental Information
(The following is provided solely for informative reasons. It does not
influence the above grade or ranking.)
10.1%
55.0%
35.0%
Funding Sources
Federal Funds
State Funds
Local Funds
www.alec.org 57
STATE SNAPSHOTS
The Hoosier State
Indiana
NAEP Scores for Low-Income General Education
Students (2003-2013)
NAEP Low-Income General Education Student
Score Distribution (2013)
42013 NAEP Performance Rank
ALEC Historical Ranking 2009 NAEP: 13th
| 2011 NAEP: 17th
Measures the overall scores for low-income general education
students (non-ELL and non-IEP) and their gains/losses on the
National Assessment of Educational Progress (NAEP) fourth-
and eighth-grade reading and mathematics exams from 2003
to 2013.
n	States IN
outperformed
Education Policy Grade
ALEC Historical Grading 	 2011: B | 2012: B+| 2013: B+
Grades state-level education policies that provide high-quality
educational options to all students.
0
25
50
75
100
At Proficient
At Advanced
At Basic
Below Basic
4th-Grade
Reading
8th-Grade
Reading
4th-Grade
Math
8th-Grade
Math
3%
27%
43%
26%
51%
22%
39%
47%
9%
23%
47%
25%26%
0%
25%
50%
75%
100%
5% 1% 5% 4%
243
281
323
214
249
282
262
299
333
210
225
214
238
268
BASIC
PROFICIENT
ADVANCED
4th-Grade
Reading
8th-Grade
Reading
4th-Grade
Math
8th-Grade
Math
2003 2013
256
264 228
245
273
282
B+
State Academic Standards C-
Charter Schools
Charter Schools Allowed	 Yes
Charter School Law Grade A
Homeschool Regulation Burden	
(A=None, B=Low, C=Moderate, D=High)
A
Private School Choice Programs A
Teacher Quality and Policies:
Overall Grade
B-
Delivering Well Prepared Teachers B+
Expanding the Teaching Pool C-
Identifying Effective Teachers C
Retaining Effective Teachers C-
Exiting Ineffective Teachers B
Digital Learning B-
Graduation Rate
Average
Class Size
Annual Cost Per
Student
77.2% 16.81 $11,583
Supplemental Information
(The following is provided solely for informative reasons. It does not
influence the above grade or ranking.)
8.6%
29.4%
61.9%
Funding Sources
Federal Funds
State Funds
Local Funds
58 Report Card on American Education
2014 STUDENT PERFORMANCE AND STATE EDUCATION POLICY GRADES INDEX
The Hawkeye State
Iowa
NAEP Scores for Low-Income General Education
Students (2003-2013)
NAEP Low-Income General Education Student
Score Distribution (2013)
312013 NAEP Performance Rank
ALEC Historical Ranking 2009 NAEP: 31st
| 2011 NAEP: 31st
Measures the overall scores for low-income general education
students (non-ELL and non-IEP) and their gains/losses on the
National Assessment of Educational Progress (NAEP) fourth-
and eighth-grade reading and mathematics exams from 2003
to 2013.
n	States IA
outperformed
Education Policy Grade
ALEC Historical Grading 2011: C- | 2012: C| 2013: C-
Grades state-level education policies that provide high-quality
educational options to all students.
0
25
50
75
100
At Proficient
At Advanced
At Basic
Below Basic
4th-Grade
Reading
8th-Grade
Reading
4th-Grade
Math
8th-Grade
Math
3%
26%
38%
27%
56%
17%
33%
49%
16%
21%
49%
27%31%
0%
25%
50%
75%
100%
5% 1% 3% 3%
243
281
323
214
249
282
262
299
333
215
222
214
238
268
BASIC
PROFICIENT
ADVANCED
4th-Grade
Reading
8th-Grade
Reading
4th-Grade
Math
8th-Grade
Math
2003 2013
261 266 234
239
276 279
C-
State Academic Standards C
Charter Schools
Charter Schools Allowed	 Yes
Charter School Law Grade D
Homeschool Regulation Burden	
(A=None, B=Low, C=Moderate, D=High)
A
Private School Choice Programs C
Teacher Quality and Policies:
Overall Grade
D
Delivering Well Prepared Teachers D+
Expanding the Teaching Pool D+
Identifying Effective Teachers D-
Retaining Effective Teachers D
Exiting Ineffective Teachers D
Digital Learning D
Graduation Rate
Average
Class Size
Annual Cost Per
Student
87.9% 13.72 $11,909
Supplemental Information
(The following is provided solely for informative reasons. It does not
influence the above grade or ranking.)
10.2%
46.7%
43.2%
Funding Sources
Federal Funds
State Funds
Local Funds
www.alec.org 59
STATE SNAPSHOTS
The Sunflower State
Kansas
NAEP Scores for Low-Income General Education
Students (2003-2013)
NAEP Low-Income General Education Student
Score Distribution (2013)
202013 NAEP Performance Rank
ALEC Historical Ranking 2009 NAEP: 7th
| 2011 NAEP: 8th
Measures the overall scores for low-income general education
students (non-ELL and non-IEP) and their gains/losses on the
National Assessment of Educational Progress (NAEP) fourth-
and eighth-grade reading and mathematics exams from 2003
to 2013.
n	States KS
outperformed
Education Policy Grade
ALEC Historical Grading 	 2011: C- | 2012: C-| 2013: D+
Grades state-level education policies that provide high-quality
educational options to all students.
0
25
50
75
100
At Proficient
At Advanced
At Basic
Below Basic
4th-Grade
Reading
8th-Grade
Reading
4th-Grade
Math
8th-Grade
Math
3%
25%
41%
26%
50%
23%
36%
50%
10%
26%
47%
22%30%
0%
25%
50%
75%
100%
4% 1% 3% 5%
243
281
323
214
249
282
262
299
333
212
221
214
238
268
BASIC
PROFICIENT
ADVANCED
4th-Grade
Reading
8th-Grade
Reading
4th-Grade
Math
8th-Grade
Math
2003 2013
260 263
234
243
277
285
C-
State Academic Standards D+
Charter Schools
Charter Schools Allowed	 Yes
Charter School Law Grade F
Homeschool Regulation Burden	
(A=None, B=Low, C=Moderate, D=High)
B
Private School Choice Programs D
Teacher Quality and Policies:
Overall Grade
D
Delivering Well Prepared Teachers D+
Expanding the Teaching Pool D-
Identifying Effective Teachers D+
Retaining Effective Teachers D
Exiting Ineffective Teachers F
Digital Learning B-
Graduation Rate
Average
Class Size
Annual Cost Per
Student
84.5% 13.67 $11,472
Supplemental Information
(The following is provided solely for informative reasons. It does not
influence the above grade or ranking.)
11.1%
35.8%
53.2%
Funding Sources
Federal Funds
State Funds
Local Funds
60 Report Card on American Education
2014 STUDENT PERFORMANCE AND STATE EDUCATION POLICY GRADES INDEX
The Bluegrass State
Kentucky
NAEP Scores for Low-Income General Education
Students (2003-2013)
NAEP Low-Income General Education Student
Score Distribution (2013)
422013 NAEP Performance Rank
ALEC Historical Ranking 2009 NAEP: 37th
| 2011 NAEP: 37th
Measures the overall scores for low-income general education
students (non-ELL and non-IEP) and their gains/losses on the
National Assessment of Educational Progress (NAEP) fourth-
and eighth-grade reading and mathematics exams from 2003
to 2013.
n	States KY
outperformed
Education Policy Grade
ALEC Historical Grading 2011: C | 2012: D+| 2013: C-
Grades state-level education policies that provide high-quality
educational options to all students.
0
25
50
75
100
At Proficient
At Advanced
At Basic
Below Basic
4th-Grade
Reading
8th-Grade
Reading
4th-Grade
Math
8th-Grade
Math
3%
23%
39%
26%
48%
25%
29%
51%
18%
16%
46%
35%34%
0%
25%
50%
75%
100%
4% 2% 3% 2%
243
281
323
214
249
282
262
299
333
212
219
214
238
268
BASIC
PROFICIENT
ADVANCED
4th-Grade
Reading
8th-Grade
Reading
4th-Grade
Math
8th-Grade
Math
2003 2013
260 263 224
236
267 273
C-
State Academic Standards A
Charter Schools
Charter Schools Allowed	 No
Charter School Law Grade –
Homeschool Regulation Burden	
(A=None, B=Low, C=Moderate, D=High)
B
Private School Choice Programs F
Teacher Quality and Policies:
Overall Grade
C
Delivering Well Prepared Teachers B-
Expanding the Teaching Pool C
Identifying Effective Teachers C-
Retaining Effective Teachers C
Exiting Ineffective Teachers D
Digital Learning D-
Graduation Rate
Average
Class Size
Annual Cost Per
Student
79.9% 16.2 $10,555
Supplemental Information
(The following is provided solely for informative reasons. It does not
influence the above grade or ranking.)
16.4%31.5%
52.1%
Funding Sources
Federal Funds
State Funds
Local Funds
www.alec.org 61
STATE SNAPSHOTS
The Pelican State
Louisiana
NAEP Scores for Low-Income General Education
Students (2003-2013)
NAEP Low-Income General Education Student
Score Distribution (2013)
482013 NAEP Performance Rank
ALEC Historical Ranking 2009 NAEP: 47th
| 2011 NAEP: 49th
Measures the overall scores for low-income general education
students (non-ELL and non-IEP) and their gains/losses on the
National Assessment of Educational Progress (NAEP) fourth-
and eighth-grade reading and mathematics exams from 2003
to 2013.
n	States LA
outperformed
Education Policy Grade
ALEC Historical Grading 	 2011: B- | 2012: B| 2013: B-
Grades state-level education policies that provide high-quality
educational options to all students.
0
25
50
75
100
At Proficient
At Advanced
At Basic
Below Basic
4th-Grade
Reading
8th-Grade
Reading
4th-Grade
Math
8th-Grade
Math
3%
17%
37%
18%
49%
32%
21%
53%
25%
14%
45%
39%44%
0%
25%
50%
75%
100%
2% 1% 1% 2%
243
281
323
214
249
282
262
299
333
202
212214
238
268
BASIC
PROFICIENT
ADVANCED
4th-Grade
Reading
8th-Grade
Reading
4th-Grade
Math
8th-Grade
Math
2003 2013
249
256 224
231
261
271
C+
State Academic Standards D
Charter Schools
Charter Schools Allowed	 Yes
Charter School Law Grade C
Homeschool Regulation Burden	
(A=None, B=Low, C=Moderate, D=High)
C
Private School Choice Programs A
Teacher Quality and Policies:
Overall Grade
B
Delivering Well Prepared Teachers C
Expanding the Teaching Pool C+
Identifying Effective Teachers A-
Retaining Effective Teachers B+
Exiting Ineffective Teachers C
Digital Learning B-
Graduation Rate
Average
Class Size
Annual Cost Per
Student
68.8% 13.92 $12,054
Supplemental Information
(The following is provided solely for informative reasons. It does not
influence the above grade or ranking.)
18.7%
40.5%
40.8%
Funding Sources
Federal Funds
State Funds
Local Funds
62 Report Card on American Education
2014 STUDENT PERFORMANCE AND STATE EDUCATION POLICY GRADES INDEX
The Pine Tree State
Maine
NAEP Scores for Low-Income General Education
Students (2003-2013)
NAEP Low-Income General Education Student
Score Distribution (2013)
142013 NAEP Performance Rank
ALEC Historical Ranking 2009 NAEP: 14th
| 2011 NAEP: 14th
Measures the overall scores for low-income general education
students (non-ELL and non-IEP) and their gains/losses on the
National Assessment of Educational Progress (NAEP) fourth-
and eighth-grade reading and mathematics exams from 2003
to 2013.
n	States ME
outperformed
Education Policy Grade
ALEC Historical Grading 2011: C- | 2012: C-| 2013: C
Grades state-level education policies that provide high-quality
educational options to all students.
0
25
50
75
100
At Proficient
At Advanced
At Basic
Below Basic
4th-Grade
Reading
8th-Grade
Reading
4th-Grade
Math
8th-Grade
Math
3%
26%
42%
31%
47%
19%
36%
51%
9%
26%
48%
21%27%
0%
25%
50%
75%
100%
5% 2% 4% 5%
243
281
323
214
249
282
262
299
333
219
225
214
238
268
BASIC
PROFICIENT
ADVANCED
4th-Grade
Reading
8th-Grade
Reading
4th-Grade
Math
8th-Grade
Math
2003 2013
264 268 233
243
274
284
C
State Academic Standards C+
Charter Schools
Charter Schools Allowed	 Yes
Charter School Law Grade C
Homeschool Regulation Burden	
(A=None, B=Low, C=Moderate, D=High)
C
Private School Choice Programs C
Teacher Quality and Policies:
Overall Grade
C-
Delivering Well Prepared Teachers D+
Expanding the Teaching Pool C-
Identifying Effective Teachers D-
Retaining Effective Teachers C+
Exiting Ineffective Teachers C
Digital Learning C
Graduation Rate
Average
Class Size
Annual Cost Per
Student
82.8% 11.59 $12,704
Supplemental Information
(The following is provided solely for informative reasons. It does not
influence the above grade or ranking.)
12.2%
53.3%
34.6%
Funding Sources
Federal Funds
State Funds
Local Funds
www.alec.org 63
STATE SNAPSHOTS
The Old Line State
Maryland
NAEP Scores for Low-Income General Education
Students (2003-2013)
NAEP Low-Income General Education Student
Score Distribution (2013)
112013 NAEP Performance Rank
ALEC Historical Ranking 2009 NAEP: 20th
| 2011 NAEP: 20th
Measures the overall scores for low-income general education
students (non-ELL and non-IEP) and their gains/losses on the
National Assessment of Educational Progress (NAEP) fourth-
and eighth-grade reading and mathematics exams from 2003
to 2013.
n	States MD
outperformed
Education Policy Grade
ALEC Historical Grading 	 2011: C- | 2012: D+| 2013: D+
Grades state-level education policies that provide high-quality
educational options to all students.
0
25
50
75
100
At Proficient
At Advanced
At Basic
Below Basic
4th-Grade
Reading
8th-Grade
Reading
4th-Grade
Math
8th-Grade
Math
3%
21%
38%
23%
49%
26%
26%
49%
22%
19%
45%
32%36%
0%
25%
50%
75%
100%
5% 2% 4% 4%
243
281
323
214
249
282
262
299
333
202
218
214
238
268
BASIC
PROFICIENT
ADVANCED
4th-Grade
Reading
8th-Grade
Reading
4th-Grade
Math
8th-Grade
Math
2003 2013
249
262
218
235
261
277
D+
State Academic Standards C
Charter Schools
Charter Schools Allowed	 Yes
Charter School Law Grade F
Homeschool Regulation Burden	
(A=None, B=Low, C=Moderate, D=High)
C
Private School Choice Programs F
Teacher Quality and Policies:
Overall Grade
D+
Delivering Well Prepared Teachers D+
Expanding the Teaching Pool C-
Identifying Effective Teachers C-
Retaining Effective Teachers C-
Exiting Ineffective Teachers F
Digital Learning C
Graduation Rate
Average
Class Size
Annual Cost Per
Student
82.2% 14.51 $15,774
Supplemental Information
(The following is provided solely for informative reasons. It does not
influence the above grade or ranking.)
9.3%
49.7%
41.0%
Funding Sources
Federal Funds
State Funds
Local Funds
64 Report Card on American Education
2014 STUDENT PERFORMANCE AND STATE EDUCATION POLICY GRADES INDEX
The Bay State
Massachusetts
NAEP Scores for Low-Income General Education
Students (2003-2013)
NAEP Low-Income General Education Student
Score Distribution (2013)
12013 NAEP Performance Rank
ALEC Historical Ranking 2009 NAEP: 2nd
| 2011 NAEP: 1st
Measures the overall scores for low-income general education
students (non-ELL and non-IEP) and their gains/losses on the
National Assessment of Educational Progress (NAEP) fourth-
and eighth-grade reading and mathematics exams from 2003
to 2013.
n	States MA
outperformed
Education Policy Grade
ALEC Historical Grading 2011: B- | 2012: C| 2013: C
Grades state-level education policies that provide high-quality
educational options to all students.
0
25
50
75
100
At Proficient
At Advanced
At Basic
Below Basic
4th-Grade
Reading
8th-Grade
Reading
4th-Grade
Math
8th-Grade
Math
3%
31%
42%
34%
48%
15%
40%
45%
8%
33%
45%
14%22%
0%
25%
50%
75%
100%
5% 3% 7% 7%
243
281
323
214
249
282
262
299
333
217
227
214
238
268
BASIC
PROFICIENT
ADVANCED
4th-Grade
Reading
8th-Grade
Reading
4th-Grade
Math
8th-Grade
Math
2003 2013
260
272
231
247
270
292
C-
State Academic Standards A
Charter Schools
Charter Schools Allowed	 Yes
Charter School Law Grade C
Homeschool Regulation Burden	
(A=None, B=Low, C=Moderate, D=High)
D
Private School Choice Programs F
Teacher Quality and Policies:
Overall Grade
B-
Delivering Well Prepared Teachers B-
Expanding the Teaching Pool C+
Identifying Effective Teachers C-
Retaining Effective Teachers C+
Exiting Ineffective Teachers B
Digital Learning D+
Graduation Rate
Average
Class Size
Annual Cost Per
Student
82.6% 13.69 $16,495
Supplemental Information
(The following is provided solely for informative reasons. It does not
influence the above grade or ranking.)
7.8%
54.2%
37.9%
Funding Sources
Federal Funds
State Funds
Local Funds
www.alec.org 65
STATE SNAPSHOTS
The Great Lakes State
Michigan
NAEP Scores for Low-Income General Education
Students (2003-2013)
NAEP Low-Income General Education Student
Score Distribution (2013)
402013 NAEP Performance Rank
ALEC Historical Ranking 2009 NAEP: 49th
| 2011 NAEP: 46th
Measures the overall scores for low-income general education
students (non-ELL and non-IEP) and their gains/losses on the
National Assessment of Educational Progress (NAEP) fourth-
and eighth-grade reading and mathematics exams from 2003
to 2013.
n	States MI
outperformed
Education Policy Grade
ALEC Historical Grading 	 2011: B- | 2012: B-| 2013: C+
Grades state-level education policies that provide high-quality
educational options to all students.
0
25
50
75
100
At Proficient
At Advanced
At Basic
Below Basic
4th-Grade
Reading
8th-Grade
Reading
4th-Grade
Math
8th-Grade
Math
3%
19%
36%
21%
51%
28%
22%
47%
29%
17%
42%
38%41%
0%
25%
50%
75%
100%
4% 1% 3% 3%
243
281
323
214
249
282
262
299
333
204
214
214
238
268
BASIC
PROFICIENT
ADVANCED
4th-Grade
Reading
8th-Grade
Reading
4th-Grade
Math
8th-Grade
Math
2003 2013
251
259 221
229
263
272
B-
State Academic Standards B
Charter Schools
Charter Schools Allowed	 Yes
Charter School Law Grade A
Homeschool Regulation Burden	
(A=None, B=Low, C=Moderate, D=High)
A
Private School Choice Programs F
Teacher Quality and Policies:
Overall Grade
B-
Delivering Well Prepared Teachers D+
Expanding the Teaching Pool B-
Identifying Effective Teachers B
Retaining Effective Teachers B-
Exiting Ineffective Teachers C+
Digital Learning C
Graduation Rate
Average
Class Size
Annual Cost Per
Student
75.9% 17.79 $12,644
Supplemental Information
(The following is provided solely for informative reasons. It does not
influence the above grade or ranking.)
13.7%
32.8%
53.5%
Funding Sources
Federal Funds
State Funds
Local Funds
66 Report Card on American Education
2014 STUDENT PERFORMANCE AND STATE EDUCATION POLICY GRADES INDEX
The North Star State
Minnesota
NAEP Scores for Low-Income General Education
Students (2003-2013)
NAEP Low-Income General Education Student
Score Distribution (2013)
132013 NAEP Performance Rank
ALEC Historical Ranking 2009 NAEP: 23rd
| 2011 NAEP: 18th
Measures the overall scores for low-income general education
students (non-ELL and non-IEP) and their gains/losses on the
National Assessment of Educational Progress (NAEP) fourth-
and eighth-grade reading and mathematics exams from 2003
to 2013.
n	States MN
outperformed
Education Policy Grade
ALEC Historical Grading 2011: B+ | 2012: C+| 2013: C+
Grades state-level education policies that provide high-quality
educational options to all students.
0
25
50
75
100
At Proficient
At Advanced
At Basic
Below Basic
4th-Grade
Reading
8th-Grade
Reading
4th-Grade
Math
8th-Grade
Math
3%
26%
39%
26%
51%
20%
43%
42%
10%
26%
45%
21%
31%
0%
25%
50%
75%
100% 5% 2% 5% 7%
243
281
323
214
249
282
262
299
333
217 222
214
238
268
BASIC
PROFICIENT
ADVANCED
4th-Grade
Reading
8th-Grade
Reading
4th-Grade
Math
8th-Grade
Math
2003 2013
257
266 232
246
281
287
B-
State Academic Standards B-
Charter Schools
Charter Schools Allowed	 Yes
Charter School Law Grade A
Homeschool Regulation Burden	
(A=None, B=Low, C=Moderate, D=High)
C
Private School Choice Programs C
Teacher Quality and Policies:
Overall Grade
C-
Delivering Well Prepared Teachers C+
Expanding the Teaching Pool C
Identifying Effective Teachers C-
Retaining Effective Teachers D+
Exiting Ineffective Teachers F
Digital Learning B+
Graduation Rate
Average
Class Size
Annual Cost Per
Student
88.8% 15.84 $13,464
Supplemental Information
(The following is provided solely for informative reasons. It does not
influence the above grade or ranking.)
7.8%
33.7%
58.5%
Funding Sources
Federal Funds
State Funds
Local Funds
www.alec.org 67
STATE SNAPSHOTS
The Magnolia State
Mississippi
NAEP Scores for Low-Income General Education
Students (2003-2013)
NAEP Low-Income General Education Student
Score Distribution (2013)
432013 NAEP Performance Rank
ALEC Historical Ranking 2009 NAEP: 46th
| 2011 NAEP: 48th
Measures the overall scores for low-income general education
students (non-ELL and non-IEP) and their gains/losses on the
National Assessment of Educational Progress (NAEP) fourth-
and eighth-grade reading and mathematics exams from 2003
to 2013.
n	States MS
outperformed
Education Policy Grade
ALEC Historical Grading 	 2011: C | 2012: C-| 2013: C-
Grades state-level education policies that provide high-quality
educational options to all students.
0
25
50
75
100
At Proficient
At Advanced
At Basic
Below Basic
4th-Grade
Reading
8th-Grade
Reading
4th-Grade
Math
8th-Grade
Math
3%
14%
33%
14%
45%
41%
18%
52%
29%
14%
40%
44%51%
0%
25%
50%
75%
100% 2% 0% 1% 2%
243
281
323
214
249
282
262
299
333
197
206214
238
268
BASIC
PROFICIENT
ADVANCED
4th-Grade
Reading
8th-Grade
Reading
4th-Grade
Math
8th-Grade
Math
2003 2013
248 250 217
228
252
267
C
State Academic Standards C-
Charter Schools
Charter Schools Allowed	 Yes
Charter School Law Grade D
Homeschool Regulation Burden	
(A=None, B=Low, C=Moderate, D=High)
B
Private School Choice Programs B
Teacher Quality and Policies:
Overall Grade
C
Delivering Well Prepared Teachers C
Expanding the Teaching Pool C+
Identifying Effective Teachers C-
Retaining Effective Teachers C
Exiting Ineffective Teachers D+
Digital Learning D-
Graduation Rate
Average
Class Size
Annual Cost Per
Student
63.8% 14.88 $9,190
Supplemental Information
(The following is provided solely for informative reasons. It does not
influence the above grade or ranking.)
22.3%
31.7%
46.0%
Funding Sources
Federal Funds
State Funds
Local Funds
68 Report Card on American Education
2014 STUDENT PERFORMANCE AND STATE EDUCATION POLICY GRADES INDEX
The Show-Me State
Missouri
NAEP Scores for Low-Income General Education
Students (2003-2013)
NAEP Low-Income General Education Student
Score Distribution (2013)
462013 NAEP Performance Rank
ALEC Historical Ranking 2009 NAEP: 34th
| 2011 NAEP: 47th
Measures the overall scores for low-income general education
students (non-ELL and non-IEP) and their gains/losses on the
National Assessment of Educational Progress (NAEP) fourth-
and eighth-grade reading and mathematics exams from 2003
to 2013.
n	States MO
outperformed
Education Policy Grade
ALEC Historical Grading 2011: A- | 2012: C | 2013: B-
Grades state-level education policies that provide high-quality
educational options to all students.
0
25
50
75
100
At Proficient
At Advanced
At Basic
Below Basic
4th-Grade
Reading
8th-Grade
Reading
4th-Grade
Math
8th-Grade
Math
3%
22%
37%
25%
50%
24%
26%
51%
21%
18%
48%
31%36%
0%
25%
50%
75%
100%
4% 1% 2% 3%
243
281
323
214
249
282
262
299
333
211
218
214
238
268
BASIC
PROFICIENT
ADVANCED
4th-Grade
Reading
8th-Grade
Reading
4th-Grade
Math
8th-Grade
Math
2003 2013
258 263 227
234
269 275
C+
State Academic Standards A
Charter Schools
Charter Schools Allowed	 Yes
Charter School Law Grade B
Homeschool Regulation Burden	
(A=None, B=Low, C=Moderate, D=High)
A
Private School Choice Programs F
Teacher Quality and Policies:
Overall Grade
C-
Delivering Well Prepared Teachers B-
Expanding the Teaching Pool D+
Identifying Effective Teachers D+
Retaining Effective Teachers C
Exiting Ineffective Teachers D+
Digital Learning D+
Graduation Rate
Average
Class Size
Annual Cost Per
Student
83.7% 13.54 $10,977
Supplemental Information
(The following is provided solely for informative reasons. It does not
influence the above grade or ranking.)
13.7%
47.4%
38.9%
Funding Sources
Federal Funds
State Funds
Local Funds
www.alec.org 69
STATE SNAPSHOTS
The Treasure State
Montana
NAEP Scores for Low-Income General Education
Students (2003-2013)
NAEP Low-Income General Education Student
Score Distribution (2013)
342013 NAEP Performance Rank
ALEC Historical Ranking 2009 NAEP: 9th
| 2011 NAEP: 16th
Measures the overall scores for low-income general education
students (non-ELL and non-IEP) and their gains/losses on the
National Assessment of Educational Progress (NAEP) fourth-
and eighth-grade reading and mathematics exams from 2003
to 2013.
n	States MT
outperformed
Education Policy Grade
ALEC Historical Grading 	 2011: C | 2012: D | 2013: D+
Grades state-level education policies that provide high-quality
educational options to all students.
0
25
50
75
100
At Proficient
At Advanced
At Basic
Below Basic
4th-Grade
Reading
8th-Grade
Reading
4th-Grade
Math
8th-Grade
Math
3%
22%
39%
30%
51%
18%
33%
50%
14%
26%
45%
25%
35%
0%
25%
50%
75%
100%
4% 1% 3% 4%
243
281
323
214
249
282
262
299
333
215 219
214
238
268
BASIC
PROFICIENT
ADVANCED
4th-Grade
Reading
8th-Grade
Reading
4th-Grade
Math
8th-Grade
Math
2003 2013
265 267 233
240 281 283
D
State Academic Standards C
Charter Schools
Charter Schools Allowed	 No
Charter School Law Grade –
Homeschool Regulation Burden	
(A=None, B=Low, C=Moderate, D=High)
B
Private School Choice Programs D
Teacher Quality and Policies:
Overall Grade
F
Delivering Well Prepared Teachers F
Expanding the Teaching Pool F
Identifying Effective Teachers F
Retaining Effective Teachers D-
Exiting Ineffective Teachers F
Digital Learning F
Graduation Rate
Average
Class Size
Annual Cost Per
Student
81.9% 13.48 $11,434
Supplemental Information
(The following is provided solely for informative reasons. It does not
influence the above grade or ranking.)
16.3%
39.6%
44.1%
Funding Sources
Federal Funds
State Funds
Local Funds
70 Report Card on American Education
2014 STUDENT PERFORMANCE AND STATE EDUCATION POLICY GRADES INDEX
The Cornhusker State
Nebraska
NAEP Scores for Low-Income General Education
Students (2003-2013)
NAEP Low-Income General Education Student
Score Distribution (2013)
352013 NAEP Performance Rank
ALEC Historical Ranking 2009 NAEP: 33rd
| 2011 NAEP: 42nd
Measures the overall scores for low-income general education
students (non-ELL and non-IEP) and their gains/losses on the
National Assessment of Educational Progress (NAEP) fourth-
and eighth-grade reading and mathematics exams from 2003
to 2013.
n	States NE
outperformed
Education Policy Grade
ALEC Historical Grading 2011: D+ | 2012: D | 2013: D+
Grades state-level education policies that provide high-quality
educational options to all students.
0
25
50
75
100
At Proficient
At Advanced
At Basic
Below Basic
4th-Grade
Reading
8th-Grade
Reading
4th-Grade
Math
8th-Grade
Math
3%
25%
39%
25%
52%
21%
30%
49%
18%
21%
46%
30%31%
0%
25%
50%
75%
100%
4% 1% 3% 3%
243
281
323
214
249
282
262
299
333
215
221
214
238
268
BASIC
PROFICIENT
ADVANCED
4th-Grade
Reading
8th-Grade
Reading
4th-Grade
Math
8th-Grade
Math
2003 2013
260 264 228
237
271
278
D
State Academic Standards C
Charter Schools
Charter Schools Allowed	 No
Charter School Law Grade –
Homeschool Regulation Burden	
(A=None, B=Low, C=Moderate, D=High)
B
Private School Choice Programs F
Teacher Quality and Policies:
Overall Grade
D-
Delivering Well Prepared Teachers D-
Expanding the Teaching Pool D-
Identifying Effective Teachers D
Retaining Effective Teachers D+
Exiting Ineffective Teachers F
Digital Learning F
Graduation Rate
Average
Class Size
Annual Cost Per
Student
83.8% 13.27 $12,773
Supplemental Information
(The following is provided solely for informative reasons. It does not
influence the above grade or ranking.)
15.0%
54.6%
30.3%
Funding Sources
Federal Funds
State Funds
Local Funds
www.alec.org 71
STATE SNAPSHOTS
The Silver State
Nevada
NAEP Scores for Low-Income General Education
Students (2003-2013)
NAEP Low-Income General Education Student
Score Distribution (2013)
122013 NAEP Performance Rank
ALEC Historical Ranking 2009 NAEP: 18th
| 2011 NAEP: 15th
Measures the overall scores for low-income general education
students (non-ELL and non-IEP) and their gains/losses on the
National Assessment of Educational Progress (NAEP) fourth-
and eighth-grade reading and mathematics exams from 2003
to 2013.
n	States NV
outperformed
Education Policy Grade
ALEC Historical Grading 	 2011: C+ | 2012: C+| 2013: C
Grades state-level education policies that provide high-quality
educational options to all students.
0
25
50
75
100
At Proficient
At Advanced
At Basic
Below Basic
4th-Grade
Reading
8th-Grade
Reading
4th-Grade
Math
8th-Grade
Math
3%
21%
42%
24%
49%
24%
30%
50%
17%
19%
47%
31%34%
0%
25%
50%
75%
100%
4% 2% 3% 2%
243
281
323
214
249
282
262
299
333
201
219
214
238
268
BASIC
PROFICIENT
ADVANCED
4th-Grade
Reading
8th-Grade
Reading
4th-Grade
Math
8th-Grade
Math
2003 2013
249
262 223
237
262
277
B-
State Academic Standards C+
Charter Schools
Charter Schools Allowed	 Yes
Charter School Law Grade C
Homeschool Regulation Burden	
(A=None, B=Low, C=Moderate, D=High)
B
Private School Choice Programs A
Teacher Quality and Policies:
Overall Grade
C-
Delivering Well Prepared Teachers D-
Expanding the Teaching Pool D
Identifying Effective Teachers B-
Retaining Effective Teachers D+
Exiting Ineffective Teachers B
Digital Learning B+
Graduation Rate
Average
Class Size
Annual Cost Per
Student
57.8% 19.41 $9,649
Supplemental Information
(The following is provided solely for informative reasons. It does not
influence the above grade or ranking.)
10.8%
32.3%
56.9%
Funding Sources
Federal Funds
State Funds
Local Funds
72 Report Card on American Education
2014 STUDENT PERFORMANCE AND STATE EDUCATION POLICY GRADES INDEX
The Granite State
New Hampshire
NAEP Scores for Low-Income General Education
Students (2003-2013)
NAEP Low-Income General Education Student
Score Distribution (2013)
92013 NAEP Performance Rank
ALEC Historical Ranking 2009 NAEP: 4th
| 2011 NAEP: 9th
Measures the overall scores for low-income general education
students (non-ELL and non-IEP) and their gains/losses on the
National Assessment of Educational Progress (NAEP) fourth-
and eighth-grade reading and mathematics exams from 2003
to 2013.
n	States NH
outperformed
Education Policy Grade
ALEC Historical Grading 2011: C+ | 2012: C | 2013: C
Grades state-level education policies that provide high-quality
educational options to all students.
0
25
50
75
100
At Proficient
At Advanced
At Basic
Below Basic
4th-Grade
Reading
8th-Grade
Reading
4th-Grade
Math
8th-Grade
Math
3%
26%
45%
29%
52%
17%
41%
47%
7%
29%
48%
17%25%
0%
25%
50%
75%
100%
4% 2% 5% 6%
243
281
323
214
249
282
262
299
333
218
225
214
238
268
BASIC
PROFICIENT
ADVANCED
4th-Grade
Reading
8th-Grade
Reading
4th-Grade
Math
8th-Grade
Math
2003 2013
264 268 236
247
278
289
D+
State Academic Standards C+
Charter Schools
Charter Schools Allowed	 Yes
Charter School Law Grade D
Homeschool Regulation Burden	
(A=None, B=Low, C=Moderate, D=High)
C
Private School Choice Programs D
Teacher Quality and Policies:
Overall Grade
D
Delivering Well Prepared Teachers C-
Expanding the Teaching Pool D
Identifying Effective Teachers D-
Retaining Effective Teachers F
Exiting Ineffective Teachers D
Digital Learning D
Graduation Rate
Average
Class Size
Annual Cost Per
Student
86.3% 12.73 $15,032
Supplemental Information
(The following is provided solely for informative reasons. It does not
influence the above grade or ranking.)
6.5%
56.2%
37.3%
Funding Sources
Federal Funds
State Funds
Local Funds
www.alec.org 73
STATE SNAPSHOTS
The Garden State
New Jersey
NAEP Scores for Low-Income General Education
Students (2003-2013)
NAEP Low-Income General Education Student
Score Distribution (2013)
22013 NAEP Performance Rank
ALEC Historical Ranking 2009 NAEP: 10th
| 2011 NAEP: 3rd
Measures the overall scores for low-income general education
students (non-ELL and non-IEP) and their gains/losses on the
National Assessment of Educational Progress (NAEP) fourth-
and eighth-grade reading and mathematics exams from 2003
to 2013.
n	States NJ
outperformed
Education Policy Grade
ALEC Historical Grading 	 2011: B- | 2012: C | 2013: C+
Grades state-level education policies that provide high-quality
educational options to all students.
0
25
50
75
100
At Proficient
At Advanced
At Basic
Below Basic
4th-Grade
Reading
8th-Grade
Reading
4th-Grade
Math
8th-Grade
Math
3%
23%
41%
30%
50%
18%
30%
52%
15%
29%
45%
20%32%
0%
25%
50%
75%
100%
4% 2% 3% 6%
243
281
323
214
249
282
262
299
333
207
220
214
238
268
BASIC
PROFICIENT
ADVANCED
4th-Grade
Reading
8th-Grade
Reading
4th-Grade
Math
8th-Grade
Math
2003 2013
256
268
226
238
265
288
C
State Academic Standards B-
Charter Schools
Charter Schools Allowed	 Yes
Charter School Law Grade C
Homeschool Regulation Burden	
(A=None, B=Low, C=Moderate, D=High)
A
Private School Choice Programs F
Teacher Quality and Policies:
Overall Grade
B-
Delivering Well Prepared Teachers B-
Expanding the Teaching Pool B-
Identifying Effective Teachers B-
Retaining Effective Teachers C
Exiting Ineffective Teachers C
Digital Learning D-
Graduation Rate
Average
Class Size
Annual Cost Per
Student
87.2% 12.11 $18,083
Supplemental Information
(The following is provided solely for informative reasons. It does not
influence the above grade or ranking.)
5.1%
58.1%
36.9%
Funding Sources
Federal Funds
State Funds
Local Funds
74 Report Card on American Education
2014 STUDENT PERFORMANCE AND STATE EDUCATION POLICY GRADES INDEX
The Land of Enchantment
New Mexico
NAEP Scores for Low-Income General Education
Students (2003-2013)
NAEP Low-Income General Education Student
Score Distribution (2013)
322013 NAEP Performance Rank
ALEC Historical Ranking 2009 NAEP: 48th
| 2011 NAEP: 35th
Measures the overall scores for low-income general education
students (non-ELL and non-IEP) and their gains/losses on the
National Assessment of Educational Progress (NAEP) fourth-
and eighth-grade reading and mathematics exams from 2003
to 2013.
n	States NM
outperformed
Education Policy Grade
ALEC Historical Grading 2011: B | 2012: C | 2013: C
Grades state-level education policies that provide high-quality
educational options to all students.
0
25
50
75
100
At Proficient
At Advanced
At Basic
Below Basic
4th-Grade
Reading
8th-Grade
Reading
4th-Grade
Math
8th-Grade
Math
3%
18%
38%
20%
53%
27%
28%
50%
19%
19%
47%
32%41%
0%
25%
50%
75%
100%
3% 1% 2% 2%
243
281
323
214
249
282
262
299
333
207
214
214
238
268
BASIC
PROFICIENT
ADVANCED
4th-Grade
Reading
8th-Grade
Reading
4th-Grade
Math
8th-Grade
Math
2003 2013
251
259 225
236
263
275
C-
State Academic Standards B-
Charter Schools
Charter Schools Allowed	 Yes
Charter School Law Grade C
Homeschool Regulation Burden	
(A=None, B=Low, C=Moderate, D=High)
B
Private School Choice Programs F
Teacher Quality and Policies:
Overall Grade
D+
Delivering Well Prepared Teachers D+
Expanding the Teaching Pool D-
Identifying Effective Teachers C-
Retaining Effective Teachers C-
Exiting Ineffective Teachers C
Digital Learning C
Graduation Rate
Average
Class Size
Annual Cost Per
Student
67.3% 14.72 $10,838
Supplemental Information
(The following is provided solely for informative reasons. It does not
influence the above grade or ranking.)
17.7%16.7%
65.6%
Funding Sources
Federal Funds
State Funds
Local Funds
www.alec.org 75
STATE SNAPSHOTS
The Empire State
New York
NAEP Scores for Low-Income General Education
Students (2003-2013)
NAEP Low-Income General Education Student
Score Distribution (2013)
192013 NAEP Performance Rank
ALEC Historical Ranking 2009 NAEP: 5th
| 2011 NAEP: 10th
Measures the overall scores for low-income general education
students (non-ELL and non-IEP) and their gains/losses on the
National Assessment of Educational Progress (NAEP) fourth-
and eighth-grade reading and mathematics exams from 2003
to 2013.
n	States NY
outperformed
Education Policy Grade
ALEC Historical Grading 	 2011: C- | 2012: C- | 2013: C
Grades state-level education policies that provide high-quality
educational options to all students.
0
25
50
75
100
At Proficient
At Advanced
At Basic
Below Basic
4th-Grade
Reading
8th-Grade
Reading
4th-Grade
Math
8th-Grade
Math
3%
25%
40%
26%
51%
21%
29%
51%
17%
19%
46%
29%30%
0%
25%
50%
75%
100%
5% 2% 4% 6%
243
281
323
214
249
282
262
299
333
212
222
214
238
268
BASIC
PROFICIENT
ADVANCED
4th-Grade
Reading
8th-Grade
Reading
4th-Grade
Math
8th-Grade
Math
2003 2013
258 264 229
238
271
279
C
State Academic Standards A
Charter Schools
Charter Schools Allowed	 Yes
Charter School Law Grade B
Homeschool Regulation Burden	
(A=None, B=Low, C=Moderate, D=High)
D
Private School Choice Programs F
Teacher Quality and Policies:
Overall Grade
B-
Delivering Well Prepared Teachers B
Expanding the Teaching Pool C+
Identifying Effective Teachers B-
Retaining Effective Teachers C+
Exiting Ineffective Teachers C-
Digital Learning D-
Graduation Rate
Average
Class Size
Annual Cost Per
Student
76.0% 12.88 $21,489
Supplemental Information
(The following is provided solely for informative reasons. It does not
influence the above grade or ranking.)
8.9%
50.8%
40.3%
Funding Sources
Federal Funds
State Funds
Local Funds
76 Report Card on American Education
2014 STUDENT PERFORMANCE AND STATE EDUCATION POLICY GRADES INDEX
The Old North State
North Carolina
NAEP Scores for Low-Income General Education
Students (2003-2013)
NAEP Low-Income General Education Student
Score Distribution (2013)
162013 NAEP Performance Rank
ALEC Historical Ranking 2009 NAEP: 41st
| 2011 NAEP: 7th
Measures the overall scores for low-income general education
students (non-ELL and non-IEP) and their gains/losses on the
National Assessment of Educational Progress (NAEP) fourth-
and eighth-grade reading and mathematics exams from 2003
to 2013.
n	States NC
outperformed
Education Policy Grade
ALEC Historical Grading 2011: C | 2012: C | 2013: C+
Grades state-level education policies that provide high-quality
educational options to all students.
0
25
50
75
100
At Proficient
At Advanced
At Basic
Below Basic
4th-Grade
Reading
8th-Grade
Reading
4th-Grade
Math
8th-Grade
Math
3%
24%
42%
22%
51%
25%
32%
52%
13%
24%
46%
26%31%
0%
25%
50%
75%
100%
3% 1% 2% 5%
243
281
323
214
249
282
262
299
333
210
221
214
238
268
BASIC
PROFICIENT
ADVANCED
4th-Grade
Reading
8th-Grade
Reading
4th-Grade
Math
8th-Grade
Math
2003 2013
251
261 231
240
269
282
B-
State Academic Standards A
Charter Schools
Charter Schools Allowed	 Yes
Charter School Law Grade C
Homeschool Regulation Burden	
(A=None, B=Low, C=Moderate, D=High)
C
Private School Choice Programs B
Teacher Quality and Policies:
Overall Grade
C
Delivering Well Prepared Teachers C+
Expanding the Teaching Pool D+
Identifying Effective Teachers B-
Retaining Effective Teachers B-
Exiting Ineffective Teachers F
Digital Learning C
Graduation Rate
Average
Class Size
Annual Cost Per
Student
76.9% 14.12 $9,951
Supplemental Information
(The following is provided solely for informative reasons. It does not
influence the above grade or ranking.)
14.2%
33.8%
52.0%
Funding Sources
Federal Funds
State Funds
Local Funds
www.alec.org 77
STATE SNAPSHOTS
The Peace Garden State
North Dakota	
NAEP Scores for Low-Income General Education
Students (2003-2013)
NAEP Low-Income General Education Student
Score Distribution (2013)
382013 NAEP Performance Rank
ALEC Historical Ranking 2009 NAEP: 24th
| 2011 NAEP: 33rd
Measures the overall scores for low-income general education
students (non-ELL and non-IEP) and their gains/losses on the
National Assessment of Educational Progress (NAEP) fourth-
and eighth-grade reading and mathematics exams from 2003
to 2013.
n	States ND
outperformed
Education Policy Grade
ALEC Historical Grading 	 2011: D+ | 2012: D | 2013: D
Grades state-level education policies that provide high-quality
educational options to all students.
0
25
50
75
100
At Proficient
At Advanced
At Basic
Below Basic
4th-Grade
Reading
8th-Grade
Reading
4th-Grade
Math
8th-Grade
Math
3%
23%
41%
22%
55%
22%
33%
48%
15%
24%
50%
22%33%
0%
25%
50%
75%
100%
3% 1% 4% 4%
243
281
323
214
249
282
262
299
333
217 219
214
238
268
BASIC
PROFICIENT
ADVANCED
4th-Grade
Reading
8th-Grade
Reading
4th-Grade
Math
8th-Grade
Math
2003 2013
266 262
235 240 284 283
D-
State Academic Standards C
Charter Schools
Charter Schools Allowed	 No
Charter School Law Grade –
Homeschool Regulation Burden	
(A=None, B=Low, C=Moderate, D=High)
C
Private School Choice Programs F
Teacher Quality and Policies:
Overall Grade
D
Delivering Well Prepared Teachers D
Expanding the Teaching Pool F
Identifying Effective Teachers D
Retaining Effective Teachers D
Exiting Ineffective Teachers D
Digital Learning F
Graduation Rate
Average
Class Size
Annual Cost Per
Student
88.4% 11.36 $13,118
Supplemental Information
(The following is provided solely for informative reasons. It does not
influence the above grade or ranking.)
14.8%
35.3%
49.9%
Funding Sources
Federal Funds
State Funds
Local Funds
78 Report Card on American Education
2014 STUDENT PERFORMANCE AND STATE EDUCATION POLICY GRADES INDEX
The Buckeye State
Ohio
NAEP Scores for Low-Income General Education
Students (2003-2013)
NAEP Low-Income General Education Student
Score Distribution (2013)
292013 NAEP Performance Rank
ALEC Historical Ranking 2009 NAEP: 35th
| 2011 NAEP: 21st
Measures the overall scores for low-income general education
students (non-ELL and non-IEP) and their gains/losses on the
National Assessment of Educational Progress (NAEP) fourth-
and eighth-grade reading and mathematics exams from 2003
to 2013.
n	States OH
outperformed
Education Policy Grade
ALEC Historical Grading 2011: B | 2012: B | 2013: C
Grades state-level education policies that provide high-quality
educational options to all students.
0
25
50
75
100
At Proficient
At Advanced
At Basic
Below Basic
4th-Grade
Reading
8th-Grade
Reading
4th-Grade
Math
8th-Grade
Math
3%
20%
39%
25%
49%
25%
29%
49%
19%
21%
49%
25%
38%
0%
25%
50%
75%
100%
3% 1% 3% 4%
243
281
323
214
249
282
262
299
333
211 215
214
238
268
BASIC
PROFICIENT
ADVANCED
4th-Grade
Reading
8th-Grade
Reading
4th-Grade
Math
8th-Grade
Math
2003 2013
255
262 226
236
269
281
C+
State Academic Standards C-
Charter Schools
Charter Schools Allowed	 Yes
Charter School Law Grade C
Homeschool Regulation Burden	
(A=None, B=Low, C=Moderate, D=High)
C
Private School Choice Programs A
Teacher Quality and Policies:
Overall Grade
B-
Delivering Well Prepared Teachers C
Expanding the Teaching Pool B
Identifying Effective Teachers C
Retaining Effective Teachers C+
Exiting Ineffective Teachers B-
Digital Learning D
Graduation Rate
Average
Class Size
Annual Cost Per
Student
81.4% 15.84 $13,764
Supplemental Information
(The following is provided solely for informative reasons. It does not
influence the above grade or ranking.)
11.1%
45.7%
43.2%
Funding Sources
Federal Funds
State Funds
Local Funds
www.alec.org 79
STATE SNAPSHOTS
The Sooner State
Oklahoma
NAEP Scores for Low-Income General Education
Students (2003-2013)
NAEP Low-Income General Education Student
Score Distribution (2013)
412013 NAEP Performance Rank
ALEC Historical Ranking 2009 NAEP: 43rd
| 2011 NAEP: 43rd
Measures the overall scores for low-income general education
students (non-ELL and non-IEP) and their gains/losses on the
National Assessment of Educational Progress (NAEP) fourth-
and eighth-grade reading and mathematics exams from 2003
to 2013.
n	States OK
outperformed
Education Policy Grade
ALEC Historical Grading 	 2011: B | 2012: B+ | 2013: B-
Grades state-level education policies that provide high-quality
educational options to all students.
0
25
50
75
100
At Proficient
At Advanced
At Basic
Below Basic
4th-Grade
Reading
8th-Grade
Reading
4th-Grade
Math
8th-Grade
Math
3%
22%
41%
23%
53%
22%
29%
52%
16%
16%
49%
32%34%
0%
25%
50%
75%
100%
3% 1% 3% 2%
243
281
323
214
249
282
262
299
333
212
219
214
238
268
BASIC
PROFICIENT
ADVANCED
4th-Grade
Reading
8th-Grade
Reading
4th-Grade
Math
8th-Grade
Math
2003 2013
259 263 227
237
268 274
B-
State Academic Standards D
Charter Schools
Charter Schools Allowed	 Yes
Charter School Law Grade C
Homeschool Regulation Burden	
(A=None, B=Low, C=Moderate, D=High)
A
Private School Choice Programs A
Teacher Quality and Policies:
Overall Grade
B-
Delivering Well Prepared Teachers C
Expanding the Teaching Pool C+
Identifying Effective Teachers C+
Retaining Effective Teachers C+
Exiting Ineffective Teachers A
Digital Learning C+
Graduation Rate
Average
Class Size
Annual Cost Per
Student
78.5% 15.37 $8,863
Supplemental Information
(The following is provided solely for informative reasons. It does not
influence the above grade or ranking.)
16.6%
36.4%
47.0%
Funding Sources
Federal Funds
State Funds
Local Funds
80 Report Card on American Education
2014 STUDENT PERFORMANCE AND STATE EDUCATION POLICY GRADES INDEX
The Beaver State
Oregon
NAEP Scores for Low-Income General Education
Students (2003-2013)
NAEP Low-Income General Education Student
Score Distribution (2013)
362013 NAEP Performance Rank
ALEC Historical Ranking 2009 NAEP: 32nd
| 2011 NAEP: 40th
Measures the overall scores for low-income general education
students (non-ELL and non-IEP) and their gains/losses on the
National Assessment of Educational Progress (NAEP) fourth-
and eighth-grade reading and mathematics exams from 2003
to 2013.
n	States OR
outperformed
Education Policy Grade
ALEC Historical Grading 2011: C | 2012: C | 2013: C-
Grades state-level education policies that provide high-quality
educational options to all students.
0
25
50
75
100
At Proficient
At Advanced
At Basic
Below Basic
4th-Grade
Reading
8th-Grade
Reading
4th-Grade
Math
8th-Grade
Math
3%
24%
39%
26%
52%
21%
31%
49%
16%
22%
48%
28%32%
0%
25%
50%
75%
100%
5% 1% 4% 3%
243
281
323
214
249
282
262
299
333
214
221
214
238
268
BASIC
PROFICIENT
ADVANCED
4th-Grade
Reading
8th-Grade
Reading
4th-Grade
Math
8th-Grade
Math
2003 2013
262 265 234 239
275 279
C-
State Academic Standards C
Charter Schools
Charter Schools Allowed	 Yes
Charter School Law Grade C
Homeschool Regulation Burden	
(A=None, B=Low, C=Moderate, D=High)
C
Private School Choice Programs F
Teacher Quality and Policies:
Overall Grade
D
Delivering Well Prepared Teachers D+
Expanding the Teaching Pool D-
Identifying Effective Teachers D
Retaining Effective Teachers C-
Exiting Ineffective Teachers F
Digital Learning C
Graduation Rate
Average
Class Size
Annual Cost Per
Student
76.3% 20.26 $10,832
Supplemental Information
(The following is provided solely for informative reasons. It does not
influence the above grade or ranking.)
14.0%
39.9%
46.1%
Funding Sources
Federal Funds
State Funds
Local Funds
www.alec.org 81
STATE SNAPSHOTS
The Keystone State
Pennsylvania
NAEP Scores for Low-Income General Education
Students (2003-2013)
NAEP Low-Income General Education Student
Score Distribution (2013)
72013 NAEP Performance Rank
ALEC Historical Ranking 2009 NAEP: 6th
| 2011 NAEP: 5th
Measures the overall scores for low-income general education
students (non-ELL and non-IEP) and their gains/losses on the
National Assessment of Educational Progress (NAEP) fourth-
and eighth-grade reading and mathematics exams from 2003
to 2013.
n	States PA
outperformed
Education Policy Grade
ALEC Historical Grading 	 2011: C+ | 2012: B- | 2013: C-
Grades state-level education policies that provide high-quality
educational options to all students.
0
25
50
75
100
At Proficient
At Advanced
At Basic
Below Basic
4th-Grade
Reading
8th-Grade
Reading
4th-Grade
Math
8th-Grade
Math
3%
23%
41%
29%
48%
20%
28%
51%
18%
25%
44%
27%33%
0%
25%
50%
75%
100%
4% 2% 3% 3%
243
281
323
214
249
282
262
299
333
205
220
214
238
268
BASIC
PROFICIENT
ADVANCED
4th-Grade
Reading
8th-Grade
Reading
4th-Grade
Math
8th-Grade
Math
2003 2013
255
267
224
237
264
280
C-
State Academic Standards A
Charter Schools
Charter Schools Allowed	 Yes
Charter School Law Grade C
Homeschool Regulation Burden	
(A=None, B=Low, C=Moderate, D=High)
D
Private School Choice Programs D
Teacher Quality and Policies:
Overall Grade
C-
Delivering Well Prepared Teachers C
Expanding the Teaching Pool C-
Identifying Effective Teachers C
Retaining Effective Teachers D+
Exiting Ineffective Teachers D-
Digital Learning D
Graduation Rate
Average
Class Size
Annual Cost Per
Student
84.1% 13.64 $16,186
Supplemental Information
(The following is provided solely for informative reasons. It does not
influence the above grade or ranking.)
12.5%
53.3%
34.2%
Funding Sources
Federal Funds
State Funds
Local Funds
82 Report Card on American Education
2014 STUDENT PERFORMANCE AND STATE EDUCATION POLICY GRADES INDEX
The Ocean State
Rhode Island
NAEP Scores for Low-Income General Education
Students (2003-2013)
NAEP Low-Income General Education Student
Score Distribution (2013)
172013 NAEP Performance Rank
ALEC Historical Ranking 2009 NAEP: 25th
| 2011 NAEP: 6th
Measures the overall scores for low-income general education
students (non-ELL and non-IEP) and their gains/losses on the
National Assessment of Educational Progress (NAEP) fourth-
and eighth-grade reading and mathematics exams from 2003
to 2013.
n	States RI
outperformed
Education Policy Grade
ALEC Historical Grading 2011: C | 2012: D+ | 2013: C
Grades state-level education policies that provide high-quality
educational options to all students.
0
25
50
75
100
At Proficient
At Advanced
At Basic
Below Basic
4th-Grade
Reading
8th-Grade
Reading
4th-Grade
Math
8th-Grade
Math
3%
21%
41%
25%
51%
23%
29%
53%
16%
20%
50%
28%34%
0%
25%
50%
75%
100%
4% 1% 2% 2%
243
281
323
214
249
282
262
299
333
211
219
214
238
268
BASIC
PROFICIENT
ADVANCED
4th-Grade
Reading
8th-Grade
Reading
4th-Grade
Math
8th-Grade
Math
2003 2013
254
263 226
237
263
277
C-
State Academic Standards C+
Charter Schools
Charter Schools Allowed	 Yes
Charter School Law Grade D
Homeschool Regulation Burden	
(A=None, B=Low, C=Moderate, D=High)
D
Private School Choice Programs D
Teacher Quality and Policies:
Overall Grade
B
Delivering Well Prepared Teachers B+
Expanding the Teaching Pool B-
Identifying Effective Teachers B+
Retaining Effective Teachers C-
Exiting Ineffective Teachers B
Digital Learning C
Graduation Rate
Average
Class Size
Annual Cost Per
Student
76.4% 12.77 $15,799
Supplemental Information
(The following is provided solely for informative reasons. It does not
influence the above grade or ranking.)
10.6%
54.4% 35.0%
Funding Sources
Federal Funds
State Funds
Local Funds
www.alec.org 83
STATE SNAPSHOTS
The Palmetto State
South Carolina
NAEP Scores for Low-Income General Education
Students (2003-2013)
NAEP Low-Income General Education Student
Score Distribution (2013)
512013 NAEP Performance Rank
ALEC Historical Ranking 2009 NAEP: 51st
| 2011 NAEP: 50th
Measures the overall scores for low-income general education
students (non-ELL and non-IEP) and their gains/losses on the
National Assessment of Educational Progress (NAEP) fourth-
and eighth-grade reading and mathematics exams from 2003
to 2013.
n	States SC
outperformed
Education Policy Grade
ALEC Historical Grading 	 2011: C+ | 2012: C | 2013: C+
Grades state-level education policies that provide high-quality
educational options to all students.
0
25
50
75
100
At Proficient
At Advanced
At Basic
Below Basic
4th-Grade
Reading
8th-Grade
Reading
4th-Grade
Math
8th-Grade
Math
3%
18%
35%
19%
49%
31%
23%
52%
23%
17%
42%
38%44%
0%
25%
50%
75%
100%
2% 1% 2% 3%
243
281
323
214
249
282
262
299
333
206
212214
238
268
BASIC
PROFICIENT
ADVANCED
4th-Grade
Reading
8th-Grade
Reading
4th-Grade
Math
8th-Grade
Math
2003 2013
250
257 228 232
266
272
C
State Academic Standards D+
Charter Schools
Charter Schools Allowed	 Yes
Charter School Law Grade B
Homeschool Regulation Burden	
(A=None, B=Low, C=Moderate, D=High)
C
Private School Choice Programs D
Teacher Quality and Policies:
Overall Grade
C-
Delivering Well Prepared Teachers C+
Expanding the Teaching Pool C
Identifying Effective Teachers D+
Retaining Effective Teachers C+
Exiting Ineffective Teachers D+
Digital Learning B-
Graduation Rate
Average
Class Size
Annual Cost Per
Student
68.2% 15.39 $10,878
Supplemental Information
(The following is provided solely for informative reasons. It does not
influence the above grade or ranking.)
13.4%
43.6%
43.0%
Funding Sources
Federal Funds
State Funds
Local Funds
84 Report Card on American Education
2014 STUDENT PERFORMANCE AND STATE EDUCATION POLICY GRADES INDEX
The Mount Rushmore State
South Dakota
NAEP Scores for Low-Income General Education
Students (2003-2013)
NAEP Low-Income General Education Student
Score Distribution (2013)
492013 NAEP Performance Rank
ALEC Historical Ranking 2009 NAEP: 39th
| 2011 NAEP: 38th
Measures the overall scores for low-income general education
students (non-ELL and non-IEP) and their gains/losses on the
National Assessment of Educational Progress (NAEP) fourth-
and eighth-grade reading and mathematics exams from 2003
to 2013.
n	States SD
outperformed
Education Policy Grade
ALEC Historical Grading 2011: C- | 2012: D+ | 2013: D+
Grades state-level education policies that provide high-quality
educational options to all students.
0
25
50
75
100
At Proficient
At Advanced
At Basic
Below Basic
4th-Grade
Reading
8th-Grade
Reading
4th-Grade
Math
8th-Grade
Math
3%
20%
36%
27%
51%
20%
27%
50%
20%
23%
45%
29%
41%
0%
25%
50%
75%
100%
3% 2% 3% 3%
243
281
323
214
249
282
262
299
333
217 214
214
238
268
BASIC
PROFICIENT
ADVANCED
4th-Grade
Reading
8th-Grade
Reading
4th-Grade
Math
8th-Grade
Math
2003 2013
269 266 233 235 280 279
D
State Academic Standards C
Charter Schools
Charter Schools Allowed	 No
Charter School Law Grade –
Homeschool Regulation Burden	
(A=None, B=Low, C=Moderate, D=High)
C
Private School Choice Programs F
Teacher Quality and Policies:
Overall Grade
D-
Delivering Well Prepared Teachers D
Expanding the Teaching Pool D+
Identifying Effective Teachers F
Retaining Effective Teachers D-
Exiting Ineffective Teachers F
Digital Learning C
Graduation Rate
Average
Class Size
Annual Cost Per
Student
81.8% 13.27 $10,311
Supplemental Information
(The following is provided solely for informative reasons. It does not
influence the above grade or ranking.)
20.3%
50.8%
28.9%
Funding Sources
Federal Funds
State Funds
Local Funds
www.alec.org 85
STATE SNAPSHOTS
The Volunteer State
Tennessee
NAEP Scores for Low-Income General Education
Students (2003-2013)
NAEP Low-Income General Education Student
Score Distribution (2013)
242013 NAEP Performance Rank
ALEC Historical Ranking 2009 NAEP: 36th
| 2011 NAEP: 44th
Measures the overall scores for low-income general education
students (non-ELL and non-IEP) and their gains/losses on the
National Assessment of Educational Progress (NAEP) fourth-
and eighth-grade reading and mathematics exams from 2003
to 2013.
n	States TN
outperformed
Education Policy Grade
ALEC Historical Grading 	 2011: C | 2012: C | 2013: C+
Grades state-level education policies that provide high-quality
educational options to all students.
0
25
50
75
100
At Proficient
At Advanced
At Basic
Below Basic
4th-Grade
Reading
8th-Grade
Reading
4th-Grade
Math
8th-Grade
Math
3%
19%
39%
23%
49%
26%
26%
49%
22%
15%
46%
37%39%
0%
25%
50%
75%
100%
3% 1% 2% 1%
243
281
323
214
249
282
262
299
333
203
215
214
238
268
BASIC
PROFICIENT
ADVANCED
4th-Grade
Reading
8th-Grade
Reading
4th-Grade
Math
8th-Grade
Math
2003 2013
249
261
219
234
256
271
C
State Academic Standards A
Charter Schools
Charter Schools Allowed	 Yes
Charter School Law Grade C
Homeschool Regulation Burden	
(A=None, B=Low, C=Moderate, D=High)
C
Private School Choice Programs C
Teacher Quality and Policies:
Overall Grade
B
Delivering Well Prepared Teachers B-
Expanding the Teaching Pool C+
Identifying Effective Teachers B+
Retaining Effective Teachers C+
Exiting Ineffective Teachers B-
Digital Learning F
Graduation Rate
Average
Class Size
Annual Cost Per
Student
80.4% 14.88 $8,765
Supplemental Information
(The following is provided solely for informative reasons. It does not
influence the above grade or ranking.)
14.7%
39.5%
45.8%
Funding Sources
Federal Funds
State Funds
Local Funds
86 Report Card on American Education
2014 STUDENT PERFORMANCE AND STATE EDUCATION POLICY GRADES INDEX
The Lone Star State
Texas
NAEP Scores for Low-Income General Education
Students (2003-2013)
NAEP Low-Income General Education Student
Score Distribution (2013)
182013 NAEP Performance Rank
ALEC Historical Ranking 2009 NAEP: 8th
| 2011 NAEP: 11th
Measures the overall scores for low-income general education
students (non-ELL and non-IEP) and their gains/losses on the
National Assessment of Educational Progress (NAEP) fourth-
and eighth-grade reading and mathematics exams from 2003
to 2013.
n	States TX
outperformed
Education Policy Grade
ALEC Historical Grading 2011: C+ | 2012: C+ | 2013: C
Grades state-level education policies that provide high-quality
educational options to all students.
0
25
50
75
100
At Proficient
At Advanced
At Basic
Below Basic
4th-Grade
Reading
8th-Grade
Reading
4th-Grade
Math
8th-Grade
Math
3%
20%
41%
21%
54%
24%
32%
51%
14%
27%
49%
19%
36%
0%
25%
50%
75%
100%
3% 1% 3% 4%
243
281
323
214
249
282
262
299
333
211
217
214
238
268
BASIC
PROFICIENT
ADVANCED
4th-Grade
Reading
8th-Grade
Reading
4th-Grade
Math
8th-Grade
Math
2003 2013
252
261
233
239
271
286
C
State Academic Standards C-
Charter Schools
Charter Schools Allowed	 Yes
Charter School Law Grade C
Homeschool Regulation Burden	
(A=None, B=Low, C=Moderate, D=High)
A
Private School Choice Programs F
Teacher Quality and Policies:
Overall Grade
C-
Delivering Well Prepared Teachers B
Expanding the Teaching Pool C+
Identifying Effective Teachers D-
Retaining Effective Teachers D+
Exiting Ineffective Teachers D+
Digital Learning B-
Graduation Rate
Average
Class Size
Annual Cost Per
Student
78.9% 14.56 $10,595
Supplemental Information
(The following is provided solely for informative reasons. It does not
influence the above grade or ranking.)
15.4%
46.0%
38.6%
Funding Sources
Federal Funds
State Funds
Local Funds
www.alec.org 87
STATE SNAPSHOTS
The Beehive State
Utah
NAEP Scores for Low-Income General Education
Students (2003-2013)
NAEP Low-Income General Education Student
Score Distribution (2013)
252013 NAEP Performance Rank
ALEC Historical Ranking 2009 NAEP: 42nd
| 2011 NAEP: 41st
Measures the overall scores for low-income general education
students (non-ELL and non-IEP) and their gains/losses on the
National Assessment of Educational Progress (NAEP) fourth-
and eighth-grade reading and mathematics exams from 2003
to 2013.
n	States UT
outperformed
Education Policy Grade
ALEC Historical Grading 	 2011: B | 2012: B- | 2013: B-
Grades state-level education policies that provide high-quality
educational options to all students.
0
25
50
75
100
At Proficient
At Advanced
At Basic
Below Basic
4th-Grade
Reading
8th-Grade
Reading
4th-Grade
Math
8th-Grade
Math
3%
24%
39%
29%
49%
20%
32%
47%
15%
22%
46%
29%31%
0%
25%
50%
75%
100%
6% 2% 5% 4%
243
281
323
214
249
282
262
299
333
218 222
214
238
268
BASIC
PROFICIENT
ADVANCED
4th-Grade
Reading
8th-Grade
Reading
4th-Grade
Math
8th-Grade
Math
2003 2013
260
267 233
241
275 279
B-
State Academic Standards A
Charter Schools
Charter Schools Allowed	 Yes
Charter School Law Grade B
Homeschool Regulation Burden	
(A=None, B=Low, C=Moderate, D=High)
B
Private School Choice Programs D
Teacher Quality and Policies:
Overall Grade
C
Delivering Well Prepared Teachers C-
Expanding the Teaching Pool D+
Identifying Effective Teachers D+
Retaining Effective Teachers B-
Exiting Ineffective Teachers B-
Digital Learning A-
Graduation Rate
Average
Class Size
Annual Cost Per
Student
78.6% 22.31 $7,584
Supplemental Information
(The following is provided solely for informative reasons. It does not
influence the above grade or ranking.)
12.1%
38.1%
49.8%
Funding Sources
Federal Funds
State Funds
Local Funds
88 Report Card on American Education
2014 STUDENT PERFORMANCE AND STATE EDUCATION POLICY GRADES INDEX
The Green Mountain State
Vermont
NAEP Scores for Low-Income General Education
Students (2003-2013)
NAEP Low-Income General Education Student
Score Distribution (2013)
32013 NAEP Performance Rank
ALEC Historical Ranking 2009 NAEP: 1st
| 2011 NAEP: 2nd
Measures the overall scores for low-income general education
students (non-ELL and non-IEP) and their gains/losses on the
National Assessment of Educational Progress (NAEP) fourth-
and eighth-grade reading and mathematics exams from 2003
to 2013.
n	States VT
outperformed
Education Policy Grade
ALEC Historical Grading 2011: D+ | 2012: D+ | 2013: D+
Grades state-level education policies that provide high-quality
educational options to all students.
0
25
50
75
100
At Proficient
At Advanced
At Basic
Below Basic
4th-Grade
Reading
8th-Grade
Reading
4th-Grade
Math
8th-Grade
Math
3%
28%
41%
33%
49%
15%
37%
45%
12%
29%
50%
15%25%
0%
25%
50%
75%
100%
6% 3% 5% 6%
243
281
323
214
249
282
262
299
333
217
226
214
238
268
BASIC
PROFICIENT
ADVANCED
4th-Grade
Reading
8th-Grade
Reading
4th-Grade
Math
8th-Grade
Math
2003 2013
259
272 233
244
275
290
D+
State Academic Standards B-
Charter Schools
Charter Schools Allowed	 No
Charter School Law Grade –
Homeschool Regulation Burden	
(A=None, B=Low, C=Moderate, D=High)
D
Private School Choice Programs B
Teacher Quality and Policies:
Overall Grade
D-
Delivering Well Prepared Teachers C
Expanding the Teaching Pool F
Identifying Effective Teachers F
Retaining Effective Teachers F
Exiting Ineffective Teachers F
Digital Learning D-
Graduation Rate
Average
Class Size
Annual Cost Per
Student
91.4% 10.47 $17,317
Supplemental Information
(The following is provided solely for informative reasons. It does not
influence the above grade or ranking.)
7.1%
4.7%
88.2%
Funding Sources
Federal Funds
State Funds
Local Funds
www.alec.org 89
STATE SNAPSHOTS
The Old Dominion
Virginia
NAEP Scores for Low-Income General Education
Students (2003-2013)
NAEP Low-Income General Education Student
Score Distribution (2013)
262013 NAEP Performance Rank
ALEC Historical Ranking 2009 NAEP: 12th
| 2011 NAEP: 26th
Measures the overall scores for low-income general education
students (non-ELL and non-IEP) and their gains/losses on the
National Assessment of Educational Progress (NAEP) fourth-
and eighth-grade reading and mathematics exams from 2003
to 2013.
n	States VA
outperformed
Education Policy Grade
ALEC Historical Grading 	 2011: C- | 2012: C- | 2013: C-
Grades state-level education policies that provide high-quality
educational options to all students.
0
25
50
75
100
At Proficient
At Advanced
At Basic
Below Basic
4th-Grade
Reading
8th-Grade
Reading
4th-Grade
Math
8th-Grade
Math
3%
23%
41%
21%
50%
29%
27%
53%
18%
18%
50%
30%31%
0%
25%
50%
75%
100%
4% 1% 2% 2%
243
281
323
214
249
282
262
299
333
207
221
214
238
268
BASIC
PROFICIENT
ADVANCED
4th-Grade
Reading
8th-Grade
Reading
4th-Grade
Math
8th-Grade
Math
2003 2013
255 258 227
235
265
277
C-
State Academic Standards C+
Charter Schools
Charter Schools Allowed	 Yes
Charter School Law Grade F
Homeschool Regulation Burden	
(A=None, B=Low, C=Moderate, D=High)
C
Private School Choice Programs D
Teacher Quality and Policies:
Overall Grade
C+
Delivering Well Prepared Teachers B-
Expanding the Teaching Pool C-
Identifying Effective Teachers C-
Retaining Effective Teachers B
Exiting Ineffective Teachers C
Digital Learning B
Graduation Rate
Average
Class Size
Annual Cost Per
Student
81.2% 17.58 $11,527
Supplemental Information
(The following is provided solely for informative reasons. It does not
influence the above grade or ranking.)
9.9%
53.0%
37.1%
Funding Sources
Federal Funds
State Funds
Local Funds
90 Report Card on American Education
2014 STUDENT PERFORMANCE AND STATE EDUCATION POLICY GRADES INDEX
The Evergreen State
Washington
NAEP Scores for Low-Income General Education
Students (2003-2013)
NAEP Low-Income General Education Student
Score Distribution (2013)
82013 NAEP Performance Rank
ALEC Historical Ranking 2009 NAEP: 16th
| 2011 NAEP: 25th
Measures the overall scores for low-income general education
students (non-ELL and non-IEP) and their gains/losses on the
National Assessment of Educational Progress (NAEP) fourth-
and eighth-grade reading and mathematics exams from 2003
to 2013.
n	States WA
outperformed
Education Policy Grade
ALEC Historical Grading 2011: C | 2012: C- | 2013: C
Grades state-level education policies that provide high-quality
educational options to all students.
0
25
50
75
100
At Proficient
At Advanced
At Basic
Below Basic
4th-Grade
Reading
8th-Grade
Reading
4th-Grade
Math
8th-Grade
Math
3%
27%
42%
30%
49%
19%
36%
48%
12%
27%
45%
22%26%
0%
25%
50%
75%
100%
5% 2% 4% 6%
243
281
323
214
249
282
262
299
333
216
224
214
238
268
BASIC
PROFICIENT
ADVANCED
4th-Grade
Reading
8th-Grade
Reading
4th-Grade
Math
8th-Grade
Math
2003 2013
259 258
232 235
274 277
C
State Academic Standards B
Charter Schools
Charter Schools Allowed	 Yes
Charter School Law Grade C
Homeschool Regulation Burden	
(A=None, B=Low, C=Moderate, D=High)
C
Private School Choice Programs F
Teacher Quality and Policies:
Overall Grade
C-
Delivering Well Prepared Teachers D+
Expanding the Teaching Pool C+
Identifying Effective Teachers C-
Retaining Effective Teachers C-
Exiting Ineffective Teachers C-
Digital Learning B-
Graduation Rate
Average
Class Size
Annual Cost Per
Student
77.2% 19.37 $11,329
Supplemental Information
(The following is provided solely for informative reasons. It does not
influence the above grade or ranking.)
11.6%
31.2%
57.2%
Funding Sources
Federal Funds
State Funds
Local Funds
www.alec.org 91
STATE SNAPSHOTS
The Mountain State
West Virginia
NAEP Scores for Low-Income General Education
Students (2003-2013)
NAEP Low-Income General Education Student
Score Distribution (2013)
502013 NAEP Performance Rank
ALEC Historical Ranking 2009 NAEP: 50th |
2011 NAEP: 51st
Measures the overall scores for low-income general education
students (non-ELL and non-IEP) and their gains/losses on the
National Assessment of Educational Progress (NAEP) fourth-
and eighth-grade reading and mathematics exams from 2003
to 2013.
n	States WV
outperformed
Education Policy Grade
ALEC Historical Grading 	 2011: D+ | 2012: D+ | 2013: C-
Grades state-level education policies that provide high-quality
educational options to all students.
0
25
50
75
100
At Proficient
At Advanced
At Basic
Below Basic
4th-Grade
Reading
8th-Grade
Reading
4th-Grade
Math
8th-Grade
Math
3%
24%
38%
20%
49%
30%
30%
49%
17%
15%
46%
37%34%
0%
25%
50%
75%
100%
4% 1% 3% 2%
243
281
323
214
249
282
262
299
333
215 219
214
238
268
BASIC
PROFICIENT
ADVANCED
4th-Grade
Reading
8th-Grade
Reading
4th-Grade
Math
8th-Grade
Math
2003 2013
257 257 229
238
268 271
C-
State Academic Standards B
Charter Schools
Charter Schools Allowed	 No
Charter School Law Grade –
Homeschool Regulation Burden	
(A=None, B=Low, C=Moderate, D=High)
C
Private School Choice Programs F
Teacher Quality and Policies:
Overall Grade
C-
Delivering Well Prepared Teachers C+
Expanding the Teaching Pool D+
Identifying Effective Teachers D+
Retaining Effective Teachers D+
Exiting Ineffective Teachers C-
Digital Learning B-
Graduation Rate
Average
Class Size
Annual Cost Per
Student
78.3% 13.93 $12,280
Supplemental Information
(The following is provided solely for informative reasons. It does not
influence the above grade or ranking.)
14.7%
29.6%
55.6%
Funding Sources
Federal Funds
State Funds
Local Funds
92 Report Card on American Education
2014 STUDENT PERFORMANCE AND STATE EDUCATION POLICY GRADES INDEX
America’s Dairyland
Wisconsin
NAEP Scores for Low-Income General Education
Students (2003-2013)
NAEP Low-Income General Education Student
Score Distribution (2013)
152013 NAEP Performance Rank
ALEC Historical Ranking 2009 NAEP: 21st
| 2011 NAEP: 19th
Measures the overall scores for low-income general education
students (non-ELL and non-IEP) and their gains/losses on the
National Assessment of Educational Progress (NAEP) fourth-
and eighth-grade reading and mathematics exams from 2003
to 2013.
n	States WI
outperformed
Education Policy Grade
ALEC Historical Grading 2011: B- | 2012: B- | 2013: C
Grades state-level education policies that provide high-quality
educational options to all students.
0
25
50
75
100
At Proficient
At Advanced
At Basic
Below Basic
4th-Grade
Reading
8th-Grade
Reading
4th-Grade
Math
8th-Grade
Math
3%
22%
37%
26%
49%
23%
30%
48%
18%
25%
44%
26%37%
0%
25%
50%
75%
100%
4% 2% 5% 5%
243
281
323
214
249
282
262
299
333
212 217
214
238
268
BASIC
PROFICIENT
ADVANCED
4th-Grade
Reading
8th-Grade
Reading
4th-Grade
Math
8th-Grade
Math
2003 2013
253
264 227
238
266
282
B-
State Academic Standards A
Charter Schools
Charter Schools Allowed	 Yes
Charter School Law Grade C
Homeschool Regulation Burden	
(A=None, B=Low, C=Moderate, D=High)
B
Private School Choice Programs A
Teacher Quality and Policies:
Overall Grade
D+
Delivering Well Prepared Teachers C
Expanding the Teaching Pool D-
Identifying Effective Teachers C-
Retaining Effective Teachers D
Exiting Ineffective Teachers D-
Digital Learning D
Graduation Rate
Average
Class Size
Annual Cost Per
Student
91.1% 14.93 $13,197
Supplemental Information
(The following is provided solely for informative reasons. It does not
influence the above grade or ranking.)
8.8%
45.4%
45.8%
Funding Sources
Federal Funds
State Funds
Local Funds
www.alec.org 93
STATE SNAPSHOTS
The Equality State
Wyoming
NAEP Scores for Low-Income General Education
Students (2003-2013)
NAEP Low-Income General Education Student
Score Distribution (2013)
212013 NAEP Performance Rank
ALEC Historical Ranking 2011 NAEP: 23rd
| 2009 NAEP: 28th
Measures the overall scores for low-income general education
students (non-ELL and non-IEP) and their gains/losses on the
National Assessment of Educational Progress (NAEP) fourth-
and eighth-grade reading and mathematics exams from 2003
to 2013.
n	States WY
outperformed
Education Policy Grade
ALEC Historical Grading 	 2011: C+ | 2012: C | 2013: C-
Grades state-level education policies that provide high-quality
educational options to all students.
0
25
50
75
100
At Proficient
At Advanced
At Basic
Below Basic
4th-Grade
Reading
8th-Grade
Reading
4th-Grade
Math
8th-Grade
Math
3%
25%
44%
30%
54%
15%
37%
49%
10%
27%
50%
19%27%
0%
25%
50%
75%
100%
4% 1% 4% 3%
243
281
323
214
249
282
262
299
333
221 223
214
238
268
BASIC
PROFICIENT
ADVANCED
4th-Grade
Reading
8th-Grade
Reading
4th-Grade
Math
8th-Grade
Math
2003 2013
264 269 238 243
280 285
D+
State Academic Standards C
Charter Schools
Charter Schools Allowed	 Yes
Charter School Law Grade D
Homeschool Regulation Burden	
(A=None, B=Low, C=Moderate, D=High)
B
Private School Choice Programs F
Teacher Quality and Policies:
Overall Grade
D
Delivering Well Prepared Teachers D-
Expanding the Teaching Pool D-
Identifying Effective Teachers D+
Retaining Effective Teachers D
Exiting Ineffective Teachers D+
Digital Learning C-
Graduation Rate
Average
Class Size
Annual Cost Per
Student
80.3% 12.3 $18,679
Supplemental Information
(The following is provided solely for informative reasons. It does not
influence the above grade or ranking.)
9.4%
37.2%
53.4%
Funding Sources
Federal Funds
State Funds
Local Funds
94 Report Card on American Education
4CHAPTER
Cost Versus Outcomes –
The Importance of
Educational Efficiency
96 Report Card on American Education
CHAPTER FOUR
amount of money each year on education. Despite
large variances in spending, it would be stretch
to say even the most frugal education system is
underfunded.
For example, Idaho spends $7,408 per pupil, per
year, while the lavish District of Columbia spends
nearly 400 percent that amount—$29,427.
Overall, there is more consistency in class sizes
across the states, but these still range from the
fewest average students per classroom in Ver-
mont at 10.67 to California, with more than dou-
ble that number of students in each classroom—
just shy of 24.
When average class size and per-pupil spending
is put together, the true disparity of the numbers
hits home. In North Carolina, a state with a fair-
ly average classroom size of slightly more than 15
students, taxpayers invest $133,518 for each class-
room of students. Compare this with the nation’s
capital: Despite relatively small classroom sizes,
the District of Columbia spends $378,137 for each
classroom, each year.
That astronomical expense would be a non-sto-
ry if schools in DC had similarly astronomical stu-
dent outcomes. Unfortunately, the reason Chapter
4 is dedicated to funding is because the opposite
is true. Even though DC taxpayers spend nearly
$30,000 on each student each year, student per-
formance still remains near the bottom compared
to the rest of the country. This is not to say DC stu-
dents are not improving. In fact, DC has consis-
tently been in the “Hall of Fame” for the “Most
Improved” category. However, that distinction
comes from recent years of student-centered
Cost Versus Outcomes –
The Importance of
Educational Efficiency
As discussed in Chapter 1, the United States
spends a great amount on the public ed-
ucation system. Yet for far too many
students, that spending does not translate to
academic proficiency. Significant numbers of stu-
dents perform on par with many countries that
spend a fraction of U.S. investment. Unfortunate-
ly, underperforming students are often concen-
trated in certain ethnicities—mainly black and
Hispanic students.
Sometimes, states set the highest annual per-pu-
pil spending levels in areas with the most disad-
vantaged student populations. For example, con-
sider one of the wealthiest states in the country:
New Jersey. Wide variations in per-pupil funding
depend on geography. The much-beleaguered city
of Newark has per-pupil funding of $24,281.1
This
is in a city with a poverty rate of nearly 30 percent
and a median household income of $33,960.2
De-
spite this sky-high level of spending, fewer than
half of Newark third-grade students are consid-
ered literate.3
In nearby leafy Chatham, N.J., the poverty rate
is well below 5 percent, yet that district spends
$16,037 per-pupil each year—two-thirds of what
Newark spends.4 5
To say Newark’s public schools
are strapped for cash is hardly an honest state-
ment. In fact, this is the same district that recent-
ly received a $100 million donation from Facebook
CEO Mark Zuckerberg. The problem in Newark is
that the huge amount of money produces far too
little.
Chapter 3 outlines a whole host of statistics that
address spending and class size in each state.
Put together, the country spends an enormous
www.alec.org 97
COST VERSUS OUTCOMES – THE IMPORTANCE OF EDUCATIONAL EFFICIENCY
2007.6
It is highly doubtful this massive increase
was implemented in a targeted, strategic fashion.
Instead, Wyoming gained the talking point of say-
ing it increased its per-pupil funding by more than
one-third in a single year.
With the knowledge that implementation takes
time, raising student achievement can take multi-
ple years to accomplish. To account for that, one
can examine student achievement on the fourth-
and eighth-grade reading and mathematics NAEP
in 2005, the year before this spending windfall oc-
curred, and compare that against subsequent re-
sults (2007, 2009, 2011 and 2013). Unsurprisingly,
there are no statistically significant academic gains
in any of the four exams.
Flooding the system with money instead of using
funds strategically to target programs that focus
on student success has created a system that, as
Figure 1 from Andrew Coulson at the Cato Insti-
tute shows, has runaway inflation with stagnant
student test scores.
reforms, not extravagant spending. In fact, DC
charter school students have far fewer resources
devoted to their education but substantially out-
perform DC district students.
THE EXAMPLE OF WYOMING
To answer those who might say, “But DC is an ex-
pensive place to live, with an entirely urban pop-
ulation. Of course spending will be higher,” one
must take a look at a state nearly the opposite of
the nation’s capital: Wyoming.
Wyoming is fortunate in many regards. As a re-
source-rich state, a large portion of educational
funding comes from coal and natural gas revenue,
which has been booming in recent years. However,
past education leaders may have squandered that
revenue. Under the false assumption that provid-
ing more money to an education system would fix
it, Wyoming effectively attempted to buy better
student success without any significant policy re-
forms. Wyoming’s per-pupil funding jumped more
than $4,000 in a single year between 2006 and
FIGURE 1 | INFLATION–ADJUSTED PER PUPIL SPENDING AND ACHIEVEMENT OF 17- YEAR-OLDS,
PERCENTAGE CHANGE SINCE 1970
Cato Institute
Data source (spending):
National Center for
Education Statistics,
Digest of Education
Statistics 2008, Table 181
Data sources (scores):
National Assessment of
Educational Progress,
Long Term Trends reports.
Prepared by:
Andrew J. Coulson.
Missing spending
year spending values
linearly interpolated or
extrapolated
Source: Cato Institute
PrecentChangeSince1970
-­‐10%	
  
10%	
  
30%	
  
50%	
  
70%	
  
90%	
  
110%	
  
130%	
  
150%	
  
1970	
   1974	
   1978	
   1982	
   1986	
   1990	
   1994	
   1998	
   2002	
   2006	
  
	
  Spending	
   	
  	
  Reading	
  Scores	
   	
  Math	
  Scores	
   	
  Science	
  Scores	
  
98 Report Card on American Education
CHAPTER FOUR
FIGURE 2 | INCREASES IN THE PUBLIC SCHOOL STAFF AND STUDENTS IN AMERICA SINCE 1970
Today, Wyoming spends nearly $18,500 for each
student each year. (For a more detailed history
of Wyoming’s spending habits, read the 17th edi-
tion of ALEC’s Report Card on American Educa-
tion.) That might be fine if students were receiving
$18,500 worth of education each year. However,
this does not seem to be the case; the gains of Wy-
oming students on NAEP exams have proved unre-
markable in recent years, despite the very large in-
crease in per-pupil funding.
This is not to pick on Wyoming, but instead to illus-
trate inefficiencies built into a system that has be-
come more responsive to the needs of its employ-
ees than to those who the system was created to
serve: students.
A common argument that goes hand-in-hand with
the need to increase school funding is the desire
to shrink the size of classrooms. Class sizes dic-
tate the size of the teaching force and thus play a
strong role in driving the cost structure of educa-
tion. As Figure 1 shows, the country has drastical-
ly increased per-pupil funding. But as Figure 2 il-
lustrates, that increase in funding has largely not
gone to increase teaching staff in order to support
smaller classes. Instead, non-teaching staff has in-
creased at a rate twice that of teaching staff. This
could perhaps be justified if there were clear ev-
idence of substantially improved learning out-
comes as a result of surrounding students with
more and more adults. Unfortunately that evi-
dence does not exist.
Source: Heritage Foundation
138%	
  
84%	
  
60%	
  
8%	
  
Non-­‐teaching	
  workforce	
  
increase	
  
Total	
  staff	
  increase	
   Teaching	
  staff	
  increase	
   Students	
  
www.alec.org 99
COST VERSUS OUTCOMES – THE IMPORTANCE OF EDUCATIONAL EFFICIENCY
within the school system to prop up an unsustain-
able model and has little to do with better educa-
tion for students.
In a recent survey by the Friedman Foundation
for Educational Choice, fewer than 14 percent of
Americans could estimate within a $4,000-range
the correct per-pupil funding level.9
The majority
of respondents who provided wrong estimates un-
derestimated the amount, often significantly.
Figure 5 brings Figure 4 into perspective by adding
fourth-grade reading proficiency. This chart looks
at the 2011 fourth-grade reading NAEP, which is
graded on a zero to 500-point scale, and divides
that by the total cumulative spending found in Fig-
ure 3. This illustrates an average price per point for
the NAEP exam for each of the 50 states and the
District of Columbia. Consistent with other exami-
nations of NAEP data throughout this Report Card,
in order to increase comparability among states,
this chart looks at low-income students who do
not have an individualized education program and
are not English language speakers.
When comparing Utah with its neighbor Wyoming,
Utah’s public school system appears twice as effi-
cient on a per-reading-point basis in their elemen-
tary schools. When comparing Idaho and Wyo-
ming, Idaho public schools prove radically more
efficient than those in Wyoming when measured
on a per-point basis. These disparities would not
be so large if Wyoming had increased the reading
achievement of students as a result of increased
spending, while neighboring states increased
spending at a more modest pace.
In the Midwest, Indiana proves the most efficient
judged on a per-reading-point basis. The lag in the
availability of financial data compelled the use of
2011 rather than 2013 NAEP data. However, Indi-
ana’s gain on the NAEP fourth-grade reading test
between 2011 and 2013 came in four-times larg-
er than the national average, giving the state a big
leg up in future measures. Indiana spent $171 per
fourth-grade reading point, while Illinois spent
$210 per point. Indiana has been racing ahead of
EDUCATION EFFICIENCY
Childhood literacy is the key to future learning.7
Unless students master the fundamental skills of
reading and comprehension, they will find their
subsequent courses out of reach. This not only
leads to poor student outcomes down the line but
also to various increased costs in other areas, such
as incarceration and health care. For more infor-
mation on the link between educational outcomes
and health care, see the 16th edition of ALEC’s Re-
port Card on American Education.8
For students in a growing number of states, includ-
ing Nevada as discussed in Chapter 1, legislators
are focusing on early-childhood literacy. Because
of the importance of ensuring all students are lit-
erate by fourth-grade, the following section exam-
ines achievement of fourth-graders on the NAEP
reading exam. Combined with the achievement in-
formation is current education spending levels.
Figure 3 shows how much each state spends on
students through the end of fourth-grade. For this
examination, students who were in the fourth-
grade in 2011 were considered. This is the most re-
cent complete set of data available. Then, fourth-
grade spending levels for those students in 2011
were combined with 2010 third-grade spending
levels and so on back to 2007 kindergarten spend-
ing. This provides the cumulative investment spent
to get a student through fourth-grade.
Utah spends the least to get a student through
fourth-grade, with New York at the other end of
the spectrum spending the most, nearly triple the
Utah expenditure. These spending levels alone,
however, give an incomplete picture and must be
combined with actual educational attainment.
The information in Figure 3 that shows the price of
investment in students from kindergarten through
fourth-grade in each state would come as a shock
to most people. With constant calls for more edu-
cation spending, the narrative often heard in the
media is that the education system is vastly un-
derfunded. In reality, this rhetoric is used by those
100 Report Card on American Education
CHAPTER FOUR
FIGURE 3 | CUMULATIVE CURRENT SPENDING PER PUPIL FOR GRADES K, 1, 2, 3 AND 4 BY STATE,
2007-2011
Source: United States Census Bureau
$72,994	
  
$68,144	
  
$65,572	
  
$62,638	
  
$60,729	
  
$59,431	
  
$58,902	
  
$55,104	
  
$54,760	
  
$54,025	
  
$51,008	
  
$49,578	
  
$49,158	
  
$48,764	
  
$47,958	
  
$44,897	
  
$44,549	
  
$43,593	
  
$42,986	
  
$42,634	
  
$42,550	
  
$42,238	
  
$42,019	
  
$41,848	
  
$41,181	
  
$40,862	
  
$38,830	
  
$38,669	
  
$38,544	
  
$38,085	
  
$38,044	
  
$37,789	
  
$37,584	
  
$37,388	
  
$36,961	
  
$36,576	
  
$35,750	
  
$35,698	
  
$35,667	
  
$35,423	
  
$35,374	
  
$34,536	
  
$34,277	
  
$33,717	
  
$33,304	
  
$32,023	
  
$31,789	
  
$31,053	
  
$30,935	
  
$27,952	
  
$24,397	
  
0	
   10000	
   20000	
   30000	
   40000	
   50000	
   60000	
   70000	
   80000	
  
New	
  York	
  
District	
  of	
  Columbia	
  
New	
  Jersey	
  
Alaska	
  
Vermont	
  
Wyoming	
  
ConnecHcut	
  
MassachuseKs	
  
Rhode	
  Island	
  
Maryland	
  
Pennsylvania	
  
Delaware	
  
New	
  Hampshire	
  
Maine	
  
Hawaii	
  
Wisconsin	
  
Illinois	
  
West	
  Virginia	
  
Ohio	
  
Minnesota	
  
Virginia	
  
North	
  Dakota	
  
Michigan	
  
Louisiana	
  
Nebraska	
  
Montana	
  
Kansas	
  
Oregon	
  
Iowa	
  
Georgia	
  	
  
California	
  
Missouri	
  
Washington	
  
Indiana	
  
New	
  Mexico	
  
South	
  Carolina	
  
Arkansas	
  
Kentucky	
  
Alabama	
  
Florida	
  
Colorado	
  
South	
  Dakota	
  
Texas	
  
Nevada	
  
North	
  Carolina	
  
Mississippi	
  
Tennessee	
  
Oklahoma	
  
Arizona	
  
Idaho	
  
Utah	
  
$0 $10,000 $20,000 $30,000 $40,000 $50,000 $60,000 $70,000 $80,000
www.alec.org 101
COST VERSUS OUTCOMES – THE IMPORTANCE OF EDUCATIONAL EFFICIENCY
national average. North Carolina came in second
and Florida came in third in the region.
In the Northeast, New Hampshire is the most ef-
ficient state by our measure while Connecticut is
the least efficient. Utah scores best in efficiency
in the West and tripled the national average gain
in fourth-grade reading between 2011 and 2013.
the national average on NAEP fourth-grade read-
ing scores, while the scores in Illinois have not
budged since 2007.
In the South, Tennessee comes in as the efficien-
cy champion on a per-point basis, and the future
looks bright for improvement. Tennessee’s state-
wide improvement on NAEP fourth-grade read-
ing scores between 2011 and 2013 (after this mea-
surement) stood at five-times greater than the
FIGURE 4 | GENERAL EDUCATION LOW-INCOME STUDENTS SCORING “PROFICIENT” OR BETTER ON THE
TRIAL URBAN DISTRICT ASSESSMENT EIGHTH-GRADE READING, 2013
Source: Freidman Foundation for Educational Choice, 2015 Schooling in America Survey, Q7
How much do you think is spent per year on
each student in our country’s public schools?
Your estimate (to the nearest thousand dollars)
will represent the combined expenditures of
local, state and federal governments.
(Percentage of All Responses, Percentage of
School Parents)
Less Then $4,000
$4,000 – 8,000
$8,001 – 12,000
$12,001 – 16,000
Over $16,000
21% 23% 14% 7% 12%
ALL
RESPONSES
SCHOOL
PARENT
RESPONSES
23% 24% 14% 6% 13%
102 Report Card on American Education
CHAPTER FOUR
FIGURE 5 | CUMULATIVE CURRENT SPENDING 2007-11 (K-4) PER POINT ON THE 2011 NAEP
FOURTH-GRADE READING EXAM FOR GENERAL EDUCATION LOW-INCOME CHILDREN
Source: United States Census Bureau
$342	
  
$328	
  
$298	
  
$294	
  
$273	
  
$272	
  
$267	
  
$250	
  
$249	
  
$244	
  
$232	
  
$227	
  
$226	
  
$222	
  
$219	
  
$210	
  
$208	
  
$205	
  
$199	
  
$199	
  
$199	
  
$197	
  
$196	
  
$192	
  
$188	
  
$186	
  
$179	
  
$179	
  
$177	
  
$177	
  
$177	
  
$176	
  
$175	
  
$174	
  
$173	
  
$171	
  
$167	
  
$166	
  
$164	
  
$160	
  
$160	
  
$159	
  
$159	
  
$158	
  
$156	
  
$153	
  
$152	
  
$145	
  
$143	
  
$127	
  
$112	
  
$0	
   $50	
   $100	
   $150	
   $200	
   $250	
   $300	
   $350	
   $400	
  
District	
  of	
  Columbia	
  
New	
  York	
  
New	
  Jersey	
  
Alaska	
  
ConnecDcut	
  
Vermont	
  
Wyoming	
  
Maryland	
  
Rhode	
  Island	
  
MassachuseMs	
  
Pennsylvania	
  
Hawaii	
  
Delaware	
  
Maine	
  
New	
  Hampshire	
  
Illinois	
  
Wisconsin	
  
West	
  Virginia	
  
Louisiana	
  
Michigan	
  
Ohio	
  
Virginia	
  
Minnesota	
  
North	
  Dakota	
  
Nebraska	
  
Montana	
  
California	
  
Georgia	
  
Iowa	
  
Missouri	
  
Oregon	
  
New	
  Mexico	
  
Kansas	
  
South	
  Carolina	
  
Washington	
  
Indiana	
  
Alabama	
  
Arkansas	
  
Kentucky	
  
Colorado	
  
South	
  Dakota	
  
Florida	
  
Texas	
  
Nevada	
  
Mississippi	
  
North	
  Carolina	
  
Tennessee	
  
Arizona	
  
Oklahoma	
  
Idaho	
  
Utah	
  
www.alec.org 103
COST VERSUS OUTCOMES – THE IMPORTANCE OF EDUCATIONAL EFFICIENCY
Every state has a significant segment of low-in-
come students, and the education system is one of
the greatest tools available to lift up all students to
get out of “low-income” status. However, schools
are failing to help these students.
Washington, DC deserves to be in the “hall of
shame” for sky-high student spending combined
with extremely low proficiency rates. As a whole,
New York spends well above $70,000 to get a
child through fourth grade. But for $15,000 less,
its neighbor Massachusetts, which has a similarly
expensive cost of living, gets better results. State
education policies matter. Since state policies af-
fect student achievement, Report Card on Ameri-
can Education has always focused on the need for
states to craft education policies that put students
at the center of the education system.
MISMANAGED RESOURCES
Philadelphia has a large low-income population,
a low high school graduation rate and a severely
mismanaged budget. Recent articles have lament-
ed the lack of resources available in the district.10
Reports point to the lack of resources available
directly to teachers, such as access to textbooks
within a classroom. This is not to say the resourc-
es do not exist. To put it more bluntly, there is no
reason why a district that spends $20,173 per stu-
dent should not be able to provide the basics to
students.11
In fact, Philadelphia has thousands of unused
books.12
Sitting in the basement of the Philadel-
phia School District’s main office are thousands
of new books that were consolidated when mul-
tiple schools were closed a few years ago. Keeping
these resources out of reach of teachers and stu-
dents in a school district that has nearly 60 percent
of students reading below grade level is a tragedy.
These are not poor school districts. These are
wealthy districts that are poorly managed to
the detriment of students from low-income
households.
PUTTING STUDENTS ABOVE MONEY
Throughout the past several editions of this Re-
port Card on American Education, the focus has
been on low-income students. High-income stu-
dents have distinct advantages, including easier
access to private schools and the ability to “buy” a
better public education by moving to a better dis-
trict, which is typically out of the monetary reach
of those most in need.
Those who are most harmed by inefficiencies are
the low-income students who are depending on
their school to provide them with a high-quality
education. The low-income students in Philadel-
phia and across the country are trapped in poor-
performing schools that are wasting money and
setting students up for failure.
There have been extreme variations in not just
student funding, but in how well that funding is
used for educating students. If states, districts and
schools are able to provide a better education by
better using what is being spent on students now,
they have a responsibility to do so. They owe it to
those who are funding the system with a not-so-
trivial amount of money. But most important, they
owe it to students.
104 Report Card on American Education
CHAPTER FOUR
ENDNOTES
1.	 O’Dea, Colleen, “Interactive Map: Per-Pupil Costs Vary Widely in New Jersey’s Schools.” May 16, 2014 http://www.
njspotlight.com/stories/14/05/15/per-pupil-school-spending/
2.	 United States Census Bureau. State & County QuickFacts. Accessed July 2015. http://quickfacts.census.gov/qfd/
states/34/3451000.html
3.	 City of Newark, NJ’s “Read and Believe” initiative. http://www.ci.newark.nj.us/readbelieve/
4.	 This looks at both Chatham Township and Chatham Burrough, which jointly run the School District of the Chathams.
Sources for poverty are from http://www.census.gov/quickfacts/table/PST045214/3412100,3402712130,00
5.	 Ibid
6.	 Wyoming’s per-pupil revenue for years 2006 – 2007. Total revenue rose from $13,328.93 in 2006 to $17,351.79 in 2007.
http://www.governing.com/gov-data/education-data/state-education-spending-per-pupil-data.html
7.	 “Early Warning! Why Reading by the End of Third Grade Matters” Annie E. Casey Foundation http://www.aecf.org/
resources/early-warning-why-reading-by-the-end-of-third-grade-matters/
8.	 Ladner, Matthew, Andrew LeFevre, and Dan Lips. Report Card on American Education, American Legislative Exchange
Council http://www.alec.org/publications/report-card-on-american-education/
9.	 DiPerna, Paul and Brian Gottlob. The Friedman Foundation for Educational Choice. 2015 Schooling in America Survey
http://www.edchoice.org/research/2015-schooling-in-america-survey/
10.	 Broussard, Meredith. “Why Poor Schools Can’t Win at Standardized Testing” The Atlantic. July 15, 2014 http://www.
theatlantic.com/features/archive/2014/07/why-poor-schools-cant-win-at-standardized-testing/374287/
11.	 openPAgov.org, School Spending http://www.openpagov.org/education_revenue_and_expenses.asp
12.	 Newall, Mike. “In cash-strapped School District, a hidden treasure trove of books.” Philadelphia Inquirer http://articles.
philly.com/2015-03-19/news/60254454_1_science-books-many-city-teachers-philadelphia-school-district
www.alec.org 105
COST VERSUS OUTCOMES – THE IMPORTANCE OF EDUCATIONAL EFFICIENCY
106 Report Card on American Education
APPENDIX A | CHANGE IN NAEP SCORES FOR ALL STUDENTS
CHANGE IN NAEP SCORES FOR ALL STUDENTS FROM 2003 TO 2013
(Non-IEP, Non-ELL) Average scores
Jurisdiction
Change in Fourth-Grade
Reading Scores
Change in Fourth-Grade
Math Scores
Alabama 11 10
Alaska -2 3
Arizona 4 11
Arkansas 5 11
California 7 7
Colorado 3 12
Connecticut 1 2
Delaware 2 7
District of Columbia 17 24
Florida 9 8
Georgia 8 10
Hawaii 7 16
Idaho 1 6
Illinois 2 6
Indiana 5 11
Iowa 1 8
Kansas 3 4
Kentucky 5 12
Louisiana 6 5
Maine 1 8
Maryland 13 12
Massachusetts 5 11
Michigan -1 1
Minnesota 4 11
Mississippi 3 8
Missouri 0 5
Montana 0 8
National Average 4 7
Nebraska 3 7
Nevada 7 8
New Hampshire 4 10
New Jersey 4 8
New Mexico 3 10
New York 2 4
North Carolina 1 3
North Dakota 2 8
Ohio 2 8
Oklahoma 3 10
Oregon 2 4
Pennsylvania 8 8
Rhode Island 6 11
South Carolina -1 1
South Dakota -4 4
Tennessee 8 12
Texas 2 5
Utah 4 8
Vermont 2 6
Virginia 5 7
Washington 4 8
West Virginia -5 6
Wisconsin 0 8
Wyoming 4 6
www.alec.org 107
Jurisdiction
Change in Eighth-Grade
Reading Scores
Change in Eighth-Grade
Math Scores
Alabama 4 7
Alaska 5 3
Arizona 5 9
Arkansas 4 12
California 11 9
Colorado 3 7
Connecticut 7 1
Delaware 1 5
District of Columbia 9 22
Florida 9 10
Georgia 7 9
Hawaii 9 15
Idaho 6 6
Illinois 1 8
Indiana 2 7
Iowa 1 1
Kansas 1 6
Kentucky 4 7
Louisiana 4 7
Maine 1 7
Maryland 12 9
Massachusetts 4 14
Michigan 2 4
Minnesota 3 4
Mississippi -2 10
Missouri 0 4
Montana 2 3
National Average 5 7
Nebraska 3 3
Nevada 10 10
New Hampshire 3 10
New Jersey 8 15
New Mexico 4 10
New York 1 2
North Carolina 3 5
North Dakota -2 4
Ohio 2 8
Oklahoma 0 4
Oregon 4 3
Pennsylvania 8 11
Rhode Island 6 12
South Carolina 3 3
South Dakota -2 2
Tennessee 7 10
Texas 5 11
Utah 6 3
Vermont 3 9
Virginia 0 6
Washington 8 9
West Virginia -3 3
Wisconsin 2 5
Wyoming 4 4
108 Report Card on American Education
APPENDIX B | EDUCATION POLICY GRADE COMPONENTS
Jurisdiction
State Academic
Standards
Charter
School
Law
Charter
School
Grade
Homeschool
Regulation Burden
Private School
Choice Programs
Alabama F N – B C
Alaska D+ Y D A F
Arizona C Y A B A
Arkansas D Y D C B
California C+ Y B B F
Colorado B Y B C F
Connecticut C- Y D A F
Delaware C Y C B F
District of Columbia C Y A C D
Florida B Y B C A
Georgia F Y C B B
Hawaii C Y C C F
Idaho D Y B A F
Illinois B- Y C A C
Indiana C- Y A A A
Iowa C Y D A C
Kansas D+ Y F B D
Kentucky A N – B F
Louisiana D Y C C A
Maine C+ Y C C C
Maryland C Y F C F
Massachusetts A Y C D F
Michigan B Y A A F
Minnesota B- Y A C C
Mississippi C- Y D B B
Missouri A Y B A F
Montana C N – B D
Nebraska C N – B F
Nevada C+ Y C B A
New Hampshire C+ Y D C D
New Jersey B- Y C A F
New Mexico B- Y C B F
New York A Y B D F
North Carolina A Y C C B
North Dakota C N – C F
Ohio C- Y C C A
Oklahoma D Y C A A
Oregon C Y C C F
Pennsylvania A Y C D D
Rhode Island C+ Y D D D
South Carolina D+ Y B C D
South Dakota C N – C F
Tennessee A Y C C C
Texas C- Y C A F
Utah A Y B B D
Vermont B- N – D B
Virginia C+ Y F C D
Washington B Y C C F
West Virginia B N – C F
Wisconsin A Y C B A
Wyoming C Y D B F
EDUCATION POLICY GRADE COMPONENTS
www.alec.org 109
Jurisdiction
Overall Teacher Quality
and Policies Grade
Digital Learning
Grade
Alabama D D-
Alaska D D+
Arizona C- C+
Arkansas B- C
California D+ D-
Colorado C+ D+
Connecticut B- F
Delaware C+ D-
District of Columbia D+ –
Florida B+ A-
Georgia B- B
Hawaii D+ D
Idaho D+ C
Illinois C+ D-
Indiana B- B-
Iowa D D
Kansas D B-
Kentucky C D
Louisiana B B-
Maine C- C
Maryland D+ C
Massachusetts B- D+
Michigan B- C
Minnesota C- B+
Mississippi C D-
Missouri C- D+
Montana F F
Nebraska D- F
Nevada C- B+
New Hampshire D D
New Jersey B- D-
New Mexico D+ C
New York B- D-
North Carolina C C
North Dakota D F
Ohio B- D
Oklahoma B- C+
Oregon D C
Pennsylvania C- D
Rhode Island B C
South Carolina C- B-
South Dakota D- C
Tennessee B F
Texas C- B-
Utah C A-
Vermont D- D-
Virginia C+ B
Washington C- B-
West Virginia C- B-
Wisconsin D+ D
Wyoming D C-
110 Report Card on American Education
APPENDICES
Issue Areas:
CIVIL JUSTICE
•	 Civil Liability Predictability
•	 Fairness in Damages
•	 Discouraging Lawsuit Abuse
COMMERCE, INSURANCE AND
ECONOMIC DEVELOPMENT
•	 Limiting Government Mandates on Business
•	 Transportation and Infrastructure
•	 Employee Rights and Freedoms
COMMUNICATIONS AND TECHNOLOGY
•	 Broadband Deployment
•	 Consumer Privacy
• E-Commerce
EDUCATION AND WORKFORCE
DEVELOPMENT
•	 Education Reform
•	 Parental Choice
•	 Efficiency, Accountability and Transparency
ENERGY, ENVIRONMENT AND AGRICULTURE
•	 Energy Affordability and Reliability
•	 Regulatory Reform
•	 Agriculture and Land Use
HEALTH AND HUMAN SERVICES
•	 Pro-Patient, Free-Market Health Policy
•	 Private and Public Health Insurance
•	 Federal Health Reform
INTERNATIONAL RELATIONS AND
FEDERALISM
•	 International Trade
•	 Intellectual Property Rights Protection
•	 Federalism
JUSTICE PERFORMANCE PROJECT
•	 Recidivism Reduction
•	 Overcriminalization
•	 Data-Driven Criminal Justice Reform
TAX AND FISCAL POLICY
•	 Pro-Growth Tax Reform
•	 Priority-Based Budgeting
•	 Pension Reform
About the American Legislative
Exchange Council
The American Legislative Exchange Council (ALEC)
is America’s largest nonpartisan, voluntary mem-
bership organization of state legislators. ALEC
provides a unique opportunity for state lawmak-
ers, business leaders and citizen organizations
from around the country to share experienc-
es and develop statebased, pro-growth models
based on academic research, existing state pol-
icy and proven business practices. The ultimate
goal of ALEC is to help state lawmakers make gov-
ernment work more efficiently and move gov-
ernment closer to the communities they serve,
thereby creating opportunity for all Americans.
In state legislatures around the country, citizen
groups foster ideas, participate in discussions and
provide their points of view to lawmakers.
This process is an important part of American
democracy.
ALEC and its nine task forces closely imitate the
state legislative process: Resolutions are intro-
duced and assigned to an appropriate task force
based on subject and scope; meetings are con-
ducted where experts present facts and opinion
for discussion, just as they would in committee
hearings; these discussions are followed by a vote.
ALEC task forces serve as testing grounds to judge
whether resolutions can achieve consensus and
enough support to survive the legislative process
in a state capitol. All adopted model policies are
published at www.alec.org to promote increased
education and the open exchange of ideas across
America.
Report Card on American Education 20th Edition

More Related Content

PDF
Report Card on American Education: Ranking State K-12 Performance, Progress, ...
PDF
Report Card on American Education: Ranking State K-12 Performance, Progress, ...
PDF
20110128 10 Questions State Legislators Should Ask About Higher Education
PDF
School Choice and State Constitutions
PDF
Columbia group brochure final
PDF
Senate Dem Ed recs
PDF
Principal news
PPTX
The Future of School Choice in Idaho
Report Card on American Education: Ranking State K-12 Performance, Progress, ...
20110128 10 Questions State Legislators Should Ask About Higher Education
School Choice and State Constitutions
Columbia group brochure final
Senate Dem Ed recs
Principal news
The Future of School Choice in Idaho

What's hot (20)

PPTX
Dropout Powerpoint Presentation
PPTX
Wisconsin Scoreboard: How are we doing
PPT
Power of the ballot
PPTX
EPIDEMIC OF DEVELOPMENTAL DISORDERS IN OUR SCHOOLS AND HOMES
PDF
I'm The Guy You Pay Later- Sheriffs, Chiefs and Prosecutors Urge America to C...
PDF
CHCI White Policy Paper 2012
PDF
Arizona's Economic Imperative: Leading the Nation in Latino Student Success
PPTX
High School Dropouts
PDF
The INS and OUTS of Charter Schools (1)
PDF
IDRA 2017 Annual Report_Keeping the Promise_Profiles in Leadership and Education
PDF
A Right Denied - The Critical Need For Genuine School Reform
PDF
School attendance mcec
DOCX
Vouchers
PDF
GraduationGaps
PDF
Record Breaking Heatwave
PDF
The Return on Investment (ROI) from Adult Education and Training
PPT
Bridging the Achievement Gap - The Need for Change in American Public Education
PDF
AAUP-AFT Local 6075 Newsbriefs elections 2016
PDF
A Decade of Helping Drive Michigan's Rebound
PPTX
Closing the achievement gap
Dropout Powerpoint Presentation
Wisconsin Scoreboard: How are we doing
Power of the ballot
EPIDEMIC OF DEVELOPMENTAL DISORDERS IN OUR SCHOOLS AND HOMES
I'm The Guy You Pay Later- Sheriffs, Chiefs and Prosecutors Urge America to C...
CHCI White Policy Paper 2012
Arizona's Economic Imperative: Leading the Nation in Latino Student Success
High School Dropouts
The INS and OUTS of Charter Schools (1)
IDRA 2017 Annual Report_Keeping the Promise_Profiles in Leadership and Education
A Right Denied - The Critical Need For Genuine School Reform
School attendance mcec
Vouchers
GraduationGaps
Record Breaking Heatwave
The Return on Investment (ROI) from Adult Education and Training
Bridging the Achievement Gap - The Need for Change in American Public Education
AAUP-AFT Local 6075 Newsbriefs elections 2016
A Decade of Helping Drive Michigan's Rebound
Closing the achievement gap
Ad

Similar to Report Card on American Education 20th Edition (20)

PDF
Report Card on American Education 19th Edition
PPT
Federalism and education policy
PDF
20080827 Demography Is Not Destiny Reform Lessons from Florida on Overcoming ...
PDF
The-New-Opportunity-Agenda_AMovementAtRisk_AManifesto
PDF
Education Reform
PDF
The Progression of the Education Sector
DOCX
1 Occupy Higher Education 12 2 33 44 556 67 WHY COLLEGES.docx
PPT
Ohio Assoc IS 5 Drivers of Ind School Demand
PPT
Achievement in america
PDF
China's IT in Education
PDF
We Must Have Even Higher Expectations For Teachers
PDF
Introduction to culture and society USSH
PPTX
A Political Economy Analysis of School Funding Policies
DOC
US Education Reform Essay
PPTX
Effective change in schools oecd pont 2018 mad 6 18
PDF
School Choice Tradeoffs Liberty Equity And Diversity R Kenneth Godwin Frank R...
PPTX
ELC Exxon Mobile Case Competition Winner Emory University
DOCX
That’s not my job! My boss won’t let me. Let me go ask my sup.docx
PDF
Failing Grades The Federal Politics Of Education Standards Kevin R Kosar
Report Card on American Education 19th Edition
Federalism and education policy
20080827 Demography Is Not Destiny Reform Lessons from Florida on Overcoming ...
The-New-Opportunity-Agenda_AMovementAtRisk_AManifesto
Education Reform
The Progression of the Education Sector
1 Occupy Higher Education 12 2 33 44 556 67 WHY COLLEGES.docx
Ohio Assoc IS 5 Drivers of Ind School Demand
Achievement in america
China's IT in Education
We Must Have Even Higher Expectations For Teachers
Introduction to culture and society USSH
A Political Economy Analysis of School Funding Policies
US Education Reform Essay
Effective change in schools oecd pont 2018 mad 6 18
School Choice Tradeoffs Liberty Equity And Diversity R Kenneth Godwin Frank R...
ELC Exxon Mobile Case Competition Winner Emory University
That’s not my job! My boss won’t let me. Let me go ask my sup.docx
Failing Grades The Federal Politics Of Education Standards Kevin R Kosar
Ad

More from ALEC (14)

PDF
Rich States, Poor States Rankings, 9th Edition
PDF
2015 State Factor: Charitable Giving
PDF
Federally Managed Lands in the West: The Economic and Environmental Implicati...
PDF
State of the States: An Analysis of the 2015 Governors’ Addresses
PDF
Rich States, Poor States 2015 Edition
PDF
ALEC Coalition Letter
PDF
Tax cronyism
PDF
Rich States, Poor States 2014 Edition
PDF
Economy Derailed: State-by-State Impacts of the EPA Regulatory Train Wreck
PDF
Jobs, Innovation, and Opportunity in the States
PDF
Tax Myths Debunked
PDF
Rich States, Poor States
PDF
Rich States, Poor States
PDF
Dig It! Rare Earth and Uranium Mining Potential in the States
Rich States, Poor States Rankings, 9th Edition
2015 State Factor: Charitable Giving
Federally Managed Lands in the West: The Economic and Environmental Implicati...
State of the States: An Analysis of the 2015 Governors’ Addresses
Rich States, Poor States 2015 Edition
ALEC Coalition Letter
Tax cronyism
Rich States, Poor States 2014 Edition
Economy Derailed: State-by-State Impacts of the EPA Regulatory Train Wreck
Jobs, Innovation, and Opportunity in the States
Tax Myths Debunked
Rich States, Poor States
Dig It! Rare Earth and Uranium Mining Potential in the States

Recently uploaded (20)

PDF
Business Ethics Teaching Materials for college
PPTX
Renaissance Architecture: A Journey from Faith to Humanism
PDF
grade 11-chemistry_fetena_net_5883.pdf teacher guide for all student
PPTX
COMPUTERS AS DATA ANALYSIS IN PRECLINICAL DEVELOPMENT.pptx
PDF
PSYCHOLOGY IN EDUCATION.pdf ( nice pdf ...)
PPTX
IMMUNITY IMMUNITY refers to protection against infection, and the immune syst...
PPTX
The Healthy Child – Unit II | Child Health Nursing I | B.Sc Nursing 5th Semester
PDF
The Lost Whites of Pakistan by Jahanzaib Mughal.pdf
PPTX
Introduction_to_Human_Anatomy_and_Physiology_for_B.Pharm.pptx
PPTX
Pharma ospi slides which help in ospi learning
PDF
102 student loan defaulters named and shamed – Is someone you know on the list?
PDF
STATICS OF THE RIGID BODIES Hibbelers.pdf
PPTX
Introduction and Scope of Bichemistry.pptx
PDF
From loneliness to social connection charting
PDF
Electrolyte Disturbances and Fluid Management A clinical and physiological ap...
PPTX
Nursing Management of Patients with Disorders of Ear, Nose, and Throat (ENT) ...
DOCX
UPPER GASTRO INTESTINAL DISORDER.docx
PPTX
Open Quiz Monsoon Mind Game Prelims.pptx
PDF
BÀI TẬP BỔ TRỢ 4 KỸ NĂNG TIẾNG ANH 9 GLOBAL SUCCESS - CẢ NĂM - BÁM SÁT FORM Đ...
PDF
Insiders guide to clinical Medicine.pdf
Business Ethics Teaching Materials for college
Renaissance Architecture: A Journey from Faith to Humanism
grade 11-chemistry_fetena_net_5883.pdf teacher guide for all student
COMPUTERS AS DATA ANALYSIS IN PRECLINICAL DEVELOPMENT.pptx
PSYCHOLOGY IN EDUCATION.pdf ( nice pdf ...)
IMMUNITY IMMUNITY refers to protection against infection, and the immune syst...
The Healthy Child – Unit II | Child Health Nursing I | B.Sc Nursing 5th Semester
The Lost Whites of Pakistan by Jahanzaib Mughal.pdf
Introduction_to_Human_Anatomy_and_Physiology_for_B.Pharm.pptx
Pharma ospi slides which help in ospi learning
102 student loan defaulters named and shamed – Is someone you know on the list?
STATICS OF THE RIGID BODIES Hibbelers.pdf
Introduction and Scope of Bichemistry.pptx
From loneliness to social connection charting
Electrolyte Disturbances and Fluid Management A clinical and physiological ap...
Nursing Management of Patients with Disorders of Ear, Nose, and Throat (ENT) ...
UPPER GASTRO INTESTINAL DISORDER.docx
Open Quiz Monsoon Mind Game Prelims.pptx
BÀI TẬP BỔ TRỢ 4 KỸ NĂNG TIẾNG ANH 9 GLOBAL SUCCESS - CẢ NĂM - BÁM SÁT FORM Đ...
Insiders guide to clinical Medicine.pdf

Report Card on American Education 20th Edition

  • 2. Report Card on American Education: Ranking State K-12 Performance, Progress and Reform © 2015 American Legislative Exchange Council All rights reserved. Except as permitted under the United States Copyright Act of 1976, no part of this publication may be reproduced or distributed in any form or by any means or stored in a database or retrieval system without the prior permission of the publisher. Published by: American Legislative Exchange Council 2900 Crystal Drive Suite 600 Arlington, VA 22202 Phone: (202) 725-7764 Fax: (703) 373-0927 www.alec.org For more information, contact the ALEC Public Affairs office. Dr. Matthew Ladner LindsayRussell,director,TaskForceonEducationandWorkforce Development Daniel Turner, legislative analyst, Task Force on Education and Workforce Development Report Card on American Education: K-12 Performance, Progress and Reform is published by the American Legislative Exchange Council (ALEC) as part of its mission to promote limited government, free markets and federalism. ALEC is the nation’s largest nonpartisan, voluntary membership organization of state legislators, industry representatives, research analysts and policy think tanks. ALEC is governed by a board of directors of state lawmakers, which is advised by the Private Enterprise Advisory Council representing business leaders and entrepreneurs. The American Legislative Exchange Council is a 501(c)(3) nonprofit, public policy organization. Contributions are tax deductible.
  • 3. Table of Contents About the Author v Acknowledgements vi Foreword: Scott Walker, Governor of Wisconsin vii CHAPTER 1 : Education Reform: A Year in Review ........................................................................................1 Silver State Lawmakers Strike K-12 Reform Gold 2 Vergara vs. California Decision: Potential Watershed 4 Georgia and Texas Become the 16th and 17th States to Adopt “A” through “F” School Letter Grades 4 Multiple States Introduce Education Savings Account Legislation 5 Nevada, Florida, Mississippi and Tennessee Join Arizona in the ESA Family 7 States and Districts Expand Weighted Student Funding Systems 8 States Continue to Improve Digital Learning Opportunities 9 Lawmakers Introduce Multiple Scholarship Tax Credit Bills 10 School Voucher Programs Continue to Advance 11 After the 2015 Sessions a Majority of States Have a Private Choice Program 13 State Tests Align More Closely to NAEP in 20 States, Lowered in Eight 13 Charter School Parents Win Showdown with New York Mayor Bill de Blasio 14 Charter Schools Continue Nationwide Advance 16 Reform is Rolling But Has Much Farther to Go 19 CHAPTER 2: Appropriately Equipping Our Students Today for a Prosperous Tomorrow...............................21 NAEP Reading Scores as a Predictor of College Success 25 State-Level Pipelines: Linking Eighth- and 12th-Grade NAEP Scores by Cohort 27 Sending Students to College Without Necessary Reading Skills 32 Detailed Data from Arizona: What Happens When Unprepared Students Attend College 34 Conclusion: Light at the End of the Tunnel or Oncoming Train? 35 CHAPTER 3: Student Performance and State Education Policy Grades..........................................................37 Ranking States on the Performance of General Education Low-Income Students 38 Grading Education Policies 39 Overall Education Policy Grade 39 Policy Categories 39 Academic Standards 39 Charter Schools 39 Homeschooling Regulation Burden Level 40 Private School Choice 40 Teacher Quality Policies 40 Digital Learning 40 Policy Grade Methodology 40 Additional Information 40
  • 4. STATE SNAPSHOTS.......................................................................................................................................43 CHAPTER 4: Cost Versus Outcomes – The Importance of Educational Efficiency...........................................95 The Example of Wyoming 97 Educational Efficiency 99 Mismanaged Resources 103 Putting Students Above Money 103 APPENDICES.................................................................................................................................................106 Appendix A: Change in NAEP Scores for All Students 106 Appendix B: Education Policy Grade Components 108 ABOUT THE AMERICAN LEGISLATIVE EXCHANGE COUNCIL......................................................................110
  • 5. www.alec.org v DR. MATTHEW LADNER Dr. Matthew Ladner is the Senior Advisor of Policy and Research for the Foundation for Excellence in Education. He previously served as Vice President of Research at the Goldwater Institute. Prior to joining Goldwater, Ladner was director of state projects at the Alliance for School Choice. Ladner has written numerous studies on school choice, charter schools and special education reform and coauthored Report Card on American Education: Ranking State K-12 Performance, Progress and Reform for the American Legislative Exchange Council. Ladner has testified before Congress, the United States Commission of Civil Rights and numerous state legislative committees. Ladner is a graduate of the University of Texas at Austin and received both a Masters and a Ph.D. in Political Science from the University of Houston. Ladner is a Senior Fellow with the Foundation for Educational Choice and the Goldwater Institute. Dr. Ladner lives in Phoenix, Arizona. About the Author
  • 6. vi Report Card on American Education The author would like to thank the following for making this Report Card on American Education possible: First, the Allegheny Foundation and the Gleason Family Foundation for their generous support for the creation and promotion of this book. The author would like to specifically thank David J. Myslinki at Achieve and Lindsay Russell and Daniel Turner of the ALEC Task Force on Education for their tireless work and guidance in the production of this publication. We also wish to thank Lisa B. Nelson, Bartlett Cleland, Bill Meierling, Molly Drenkard, Christine Phipps, Shana Sally and the professional staff of ALEC for all aspects of this publication. Acknowledgments
  • 7. www.alec.org vii The United States of America is at a crit- ical moment in its history. In the 21st century our nation faces economic, po- litical, and cultural challenges across the globe. To maintain our competitive advantages in inno- vative technology, advanced agriculture, manu- facturing, and scientific research we need every student to have a world class education and leave school ready compete in the global economy. In Wisconsin we have responded to this chal- lenge through a number of education reforms. We made systematic changes to education gov- ernance and finance through Act 10, to free school districts from unfair agreements with unions over benefits and wages. In the process we saved taxpayers millions of dollars. In addition to the financial benefits of Act 10, we also created opportunities for long overdue ed- ucational reforms. School districts can now hire and fire teachers based upon merit, not seniority. Districts have instituted performance based pay programs and experimented with new schedul- ing formats. Our reforms moved education from a bureaucratic, top down approach to a local- ly based system that gives communities control over their schools. This has given school districts the independence to decide how to best organize and manage their schools based on what their students need and what gets results. We have also increased options for students who want to attend schools outside the tradi- tional public school system. Wisconsin was the first state to create a modern school choice pro- gram in Milwaukee in 1989. Since then, Wiscon- sin’s parental choice program has grown signifi- cantly from its beginnings as a limited program in Milwaukee to a statewide program that is grow- ing every year. Today, more than 27,000 students are attending approximately 150 participating schools, exercising choices these parents didn’t have before. With an eye toward providing even more options for parents and students, we have open enroll- ment policies, charter schools, and tax deduc- tions for private school tuition. We are deter- mined to ensure that a child’s education is not limited due to their zip code but to what fits best with that student’s individual educational needs and skills. The University of Wisconsin’s Flexible Options program is our innovative approach to high- er education in the 21st Century. Now students can earn degrees based upon previous work, Foreword by Scott Walker, Governor of Wisconsin
  • 8. viii Report Card on American Education education or life experiences in an individualized, competency based program. This is designed to give students an alternative to the tradition- al classroom model that is difficult and time con- suming for working or non-traditional students. It is vital that we give our citizens the ability to be lifelong learners in the constantly changing na- tional and global economy. The opponents of reform often claim that any changes will lead to dire consequences for schools and student outcomes. In Wisconsin we have shat- tered that myth. Since we implemented our reforms, school dis- tricts have saved millions of taxpayer dollars, used new innovative teaching methods and instituted merit pay to reward successful teachers. Our stu- dents reaped the benefits; high school gradua- tion rates are up, third grade reading scores are up, and our students are ranked 2nd in the nation for ACT scores. The American Legislative Exchange Council’s Re- port Card on American Education is a vital tool that helps states measure their education reform progress and learn from other states’ success- es and failures. Often, education reform efforts are met with vigorous public debate and can face powerful opponents. Too often these opponents are the very groups that benefit from the status quo. We must not be discouraged by these spe- cial interests. Instead, we must continue to de- mand all students have access to a high quality education that prepares them for higher learning, service in the military, and the workforce. In Wis- consin, we have shown that reform is possible. Sincerely, Scott Walker Governor of Wisconsin FOREWORD
  • 10. 2 Report Card on American Education EDUCATION REFORM MAKES SIGNIFICANT ADVANCES IN 2014-15 Since the publication of the 19th edition of the ALEC Report Card on American Education, law- makers have been active around the country in passing K-12 reforms. Laws that give more stu- dents public and private schooling options have advanced, and lawmakers have improved pub- lic school transparency. For instance, the United States Department of Education broke out Amer- ican scores on the Programme for Internation- al Student Assessment (PISA) reading exam by ethnicity. The Department study found levels of reading achievement for American Black and His- panic students similar to countries such as Tur- key, Chile and Mexico.1 These nations spend a fraction of the American spending per pupil and have far greater absolute poverty problems. De- spite continuing policy progress, many American children still significantly underperform in com- parison to their global peers. When addressing reform strategies to meet the individual state needs, policymakers should in- vestigate the following best practices already ex- ecuted in a number of states and also view the ex- tensive information produced by legislators from every state and housed at the American Legisla- tive Exchange Council (ALEC). SILVER STATE LAWMAKERS STRIKE K-12 REFORM GOLD Nevada has more than its share of education chal- lenges. Long among the fastest growing states on a percentage basis, overcrowding remains an en- demic problem in its public schools. A 2014 New York Times piece on Clark County (Las Vegas area) noted that the district had the equivalent of 40 elementary schools of students housed in por- table buildings. “I could build 23 elementary schools today, and they would open up full and overcrowded,” said Clark County Superintendent of Schools Pat Skorkowsky at a neighboring Hen- derson County Chamber of Commerce breakfast, according to the paper.2 Since schools are burst- ing at the seams due to enrollment growth and are failing to reach average levels of academ- ic achievement, Nevada lawmakers face both gi- gantic quantity and substantial quality problems. In 2015, they took dramatic action to address both problems simultaneously when Nevada Governor Brian Sandoval signed multiple K-12 re- form bills into law. Collectively, these new laws constitute a comprehensive approach, including broad parental choice and district reform efforts. Most notably, Nevada created the nation’s stron- gest parental choice program to date in terms of both student eligibility and in the allowed uses of funds. In addition, lawmakers took action to end social promotion and increase charter school offerings. Signed into law June 2, 2015, Senate Bill 302, cre- ated Nevada’s Education Savings Account (ESA) program in which participating parents manage a state-funded account for each student with multiple but restricted uses under a system of state oversight. Sponsored by state Senator Scott Hammond and signed by Sandoval, SB 302 makes all Nevada students with previous public school attendance eligible for an ESA. The Nevada Office of the State Treasurer will ad- minister the program. Students with disabilities and those from families with incomes at or below Education Reform: A Year in Review
  • 11. www.alec.org 3 EDUCATION REFORM: A YEAR IN REVIEW 185 percent of the federal poverty level will re- ceive an amount equal to 100 percent of the statewide average basic support per pupil—cur- rently around $5,700. Other students will receive a level of funding equal to 90 percent of this fig- ure—currently around $5,100. Parents opting into the program can use funds for: • Tuition and fees at an approved private school • Textbooks required for a student at an approved private school • Tutoring or other services provided by a tutor or tutoring facility that is a participating entity • Tuition and fees for a distance-learning program • Fees for any national norm-referenced achievement examination, advanced placement or similar examination, or standardized examination required for admission to college or university • Fees for any special instruction or special services if the child is a pupil with a disability • Fees and tuition for a college or university in Nevada if that student utilizes those expenses for dual credit • Textbooks for a college or university in Nevada, also if that student utilizes those expenses for dual credit • Transportation to school up to $750.00 • Purchases of curriculum or any supplemental materials • Management fees The state treasurer will oversee the program and is able to deduct up to 3 percent from the ap- propriated ESA funds to cover the costs of ad- ministration. The treasurer has the authority to remove either a vendor or a student from the program for failure to comply with the legal re- quirements of the program and refer cases to the state attorney general for criminal prosecution. Participating students must complete a nation- ally norm-referenced test annually in mathemat- ics and English; and report the results to the Ne- vada Department of Education. The department will aggregate the data according to grade level, gender, race and family income level. After three years, it will report ESA student graduation rates.3 Nevada’s program sets unprecedented education policy. No existing private choice program can match the state’s combination of broad student eligibility and multiple educational uses. As with most all-choice programs, the new Nevada ESA program remains a work in progress. Future areas of improvement could be the inclusion of funding weights for children with disabilities and English language learners to mirror the public school for- mula. Currently, the legislation allows the rolling over of unused funds from year to year and the earning of college credit through dual enrollment and advanced placement. The state’s bold new choice law, however, was not the only big advancement, as lawmakers passed other substantial reforms. Nevada’s Sen- ate Bill 391 -Read by Three Act will create pro- grams to aggressively address early childhood il- literacy through early identification and parental notification of reading deficiencies, intensive in- terventions for students and retention at the end of third grade, as a last resort. Nevada’s SB 491 appropriated $10 million for the creation and operation of high-quality char- ter schools to serve students who live in pover- ty. Assembly Bill 448 created an Achievement School District to identify low-performing dis- trict schools and convert them into public char- ter schools. Assembly Bill 483 requires school districts to set aside funding for additional performance pay for highly effective teachers and administrators. The law prioritizes student achievement and is not subject to change through collective bargaining. Senate Bill 92 took the further step of requiring all layoff decisions for teachers and administra- tors be guided by the statewide evaluation sys- tem, ending the pernicious practice of “last in, first out,” whereby teachers get laid off accord- ing to seniority rather effectiveness.4 In addition to these crucial public school reforms, Nevada lawmakers created two private choice programs. Assembly Bill 165 created a corporate
  • 12. 4 Report Card on American Education CHAPTER ONE scholarship tax credit program for students from low and middle-income households. The pro- gram has an initial $5 million cap on credits with a provision to increase the cap annually. The Nevada Constitution guarantees public edu- cation, so it will always be available. Due to the constant pressure of current and projected en- rollment growth, the Nevada public school sys- tem needs all the help it can get. These legislative efforts ensure Nevada schools are moving in the right direction. The consistent experience of pre- vious choice programs demonstrates that, there will not be a mad exodus out of the Nevada pub- lic school system, even with the ESA program’s broad eligibility. Instead, the program will reduce the strain on the public school system due to en- rollment growth and create a crucial exit option that will provide positive motivation for the pub- lic schools to improve. Nevada lawmakers have made history by initiating an audacious experi- ment in liberty that gives parents the ability to customize the education of their children. Big problems require bold leadership. VERGARA VS. CALIFORNIA DECISION: POTENTIAL WATERSHED In 2012, nine California students filed suit against the State of California claiming that state poli- cies—such as granting tenure after 18 months on the job, extremely complex appeals process- es that make it nearly impossible to terminate an ineffective teacher and “last in, first out” —vio- lated their opportunity to obtain a quality educa- tion. On June 11, 2014, the Superior Court of the State of California County of Los Angeles ruled in favor of the students, saying: Plaintiffs claim that the Challenged Statutes result in grossly ineffective teachers obtain- ing and retaining permanent employment, and that these teachers are disproportion- ately situated in schools serving predomi- nantly low-income and minority students. Plaintiffs’ equal protection claims assert that the Challenged Statutes violate their funda- mental rights to equality of education by ad- versely affecting the quality of the education they are afforded by the state. This court is asked to directly assess how the Challenged Statutes affect the educational experience. It must decide whether the Chal- lenged Statutes cause the potential and/or unreasonable exposure of grossly ineffective teachers to all California students in general and to minority and/or low-income students in particular, in violation of the equal protec- tion clause of the California Constitution.5 This Court finds that the Plaintiffs have met their burden of proof on all issues presented. This landmark decision amounted to a political earthquake. Despite having the full resources of the State of California and the California Teach- ers Association (CTA), the defendants proved in- capable of defending the indefensible. The rul- ing notes: “Evidence has been elicited in this trail of the specific effect of the grossly ineffective teachers on students. The evidence is compel- ling. Indeed, it shocks the conscience.” The ruling resulted in an inevitable appeal that will take years to resolve in the California court system. In the meantime, other groups have filed similar lawsuits in other states. The decision re- veals just how deeply discredited practices like unconditional tenure and “last in, first out” have become. Both sides put their best case forward on these issues, and the court used both sides’ testimonies to reach their ruling. GEORGIA AND TEXAS BECOME THE 16TH AND 17TH STATES TO ADOPT “A” THROUGH “F” SCHOOL LETTER GRADES Georgia lawmakers made Georgia the latest state to pass transparent A through F letter grades to describe public school academic performance. The use of letter grades in state accountability systems began in Florida in 1999, followed by Ari- zona, Indiana, Louisiana, New Mexico, Oklahoma, Utah, Alabama, Mississippi, North Carolina, Ohio, South Carolina, Arkansas, Maine, West Virgin- ia—and most recently the Peach State—between 1999 and 2015. The Texas legislature also adopted campus-lev- el A through F school grades in 2015, although it
  • 13. www.alec.org 5 EDUCATION REFORM: A YEAR IN REVIEW uses a formula that includes a number of non-ac- ademic grading factors. It also allows districts to choose some of their own grading criteria. This means that the grading system will not be com- parable across districts. The previous system of campus labels, however, amounted to a “pass/ fail” with 91 percent of schools receiving a “met standard” label in 2013 according to state crite- ria. Simultaneously only 28 percent to 41 percent of Texas students scored “proficient or better” on the 2013 fourth and eighth-grade Nation- al Assessment of Educational Progress (NAEP) math and reading exams. Texas still has room for improvement in the area of test-based school accountability. School grading policies suffered setbacks in plac- es such as New York City, where Mayor Bill de Bla- sio ended the use of letter grades. Lawmakers in Virginia also chose to cancel the adoption of the policy in the face of opposition from Governor Terry McAuliffe. The Virginia law passed in 2013, but state officials never actually implement- ed the law. School grading proponents chose to support the Virginia repeal rather than see the grades enacted without fidelity to the principles of the policy. MULTIPLE STATES INTRODUCE EDUCATION SAVINGS ACCOUNT LEGISLATION Arizona became the first state to pass a new variety of parental choice program in 2011 with the passage of the Empowerment Schol- arship Account Program, which introduced ed- ucation savings accounts. This model has sev- eral advantages over the traditional school voucher mechanism. First, it has proved more robust to court challenge in Arizona than pre- vious voucher programs. It survived legal chal- lenge, whereas two previous voucher programs were ruled unconstitutional under Arizona’s Blaine Amendment. It is possible that a pro- gram following this model might have a similar FIGURE 1 | STATES WITH “A” THROUGHT “F” SCHOOL LETTER GRADE LAWS, 2015 STATES WITH “A” THROUGH “F” SCHOOL LETTER GRADE LAWS STATES WITHOUT “A” THROUGH “F” SCHOOL LETTER GRADE LAWS
  • 14. 6 Report Card on American Education CHAPTER ONE advantage under other state constitutions. The ESA model also provides more flexibili- ty to parents than a voucher does. Parents use vouchers to choose among schools, and vouch- ers broaden their possible choices to include par- ticipating private schools. ESA programs give par- ents choices not just among schools, but also among education methods and programs. Par- ents can choose to enroll students in a school full- time, but they also have other options, including hiring private tutors and therapists, online edu- cation programs and even purchasing individual classes at schools or community colleges. The ESA model also allows parents to save mon- ey for future higher education expenses. This cre- ates an incentive for parents to carefully choose providers not only according to perceived quality but also cost. Providers thereby are motivated to provide high-quality services at affordable pric- es—the exact opposite of the trend seen in the district system in which spending surges and out- comes largely stagnate. Arizona lawmakers originally crafted their schol- arship legislation to serve only students with dis- abilities. Subsequently, however, lawmakers have made additional students eligible—children in public schools in districts with D or F grades, stu- dents who have been through the foster care sys- tem and the dependents or survivors of parents in the military. In 2014, Arizona Governor Jan Brewer signed legislation making the siblings of already eligible students eligible for the Empow- erment Scholarship Accounts. This change made it possible, for instance, for a family with two chil- dren—one of whom was eligible for the program with an Individual Education Plan—to educate both children in the same fashion or send both to the same school. In 2015, Arizona State Senator Carlyle Begay sponsored legislation making children residing FIGURE 2 | STATES INTRODUCING EDUCATION SAVINGS ACCOUNT LEGISLATION IN 2015 STATES THAT INTRODUCED EDUCATION SAVINGS ACCOUNT LEGISLATION STATES THAT DID NOT INTRODUCE EDUCATION SAVINGS ACCOUNT LEGISLATION
  • 15. www.alec.org 7 EDUCATION REFORM: A YEAR IN REVIEW on Arizona American Indian reservations eligible for the Empowerment Scholarship Accounts Pro- gram. Arizona has 55,000 American Indian chil- dren, and NAEP shows that their levels of academ- ic achievement rank consistently below those of their peers in other states and among the lowest for any student subgroup in the nation. Following the adoption of the Arizona program in 2011, ALEC adopted model ESA policy that was lat- er updated to reflect significant changes in 2015. NEVADA, FLORIDA, MISSISSIPPI AND TENNESSEE JOIN ARIZONA IN THE ESA FAMILY Lawmakers in a number of other states began to introduce account-based choice programs in 2012. In 2014, Florida lawmakers succeeded in passing the Personal Learning Savings Accounts (PLSA) program—the second of its kind in the nation. The PLSA program initially focused on children with relatively severe disabilities and was launched in the fall of 2014. The innovative Florida program is administered by nonprofit groups with state oversight. (The Arizona Department of Education and Office of the Treasury administer the original program). Florida lawmakers initially appropriated $18 million in 2014 for the PLSA program but in- creased the appropriation to $53 million in 2015. In Mississippi, the fight for ESAs for special-needs children began in 2014, but problems have exist- ed for decades. Jackson Clarion Ledger noted Feb. 2, 2014 that the graduation rate for special needs students is the worst in the nation. Despite billions in federal funding since the late 1990s, teachers are still ill-trained, and graduation rates for stu- dents with special needs have raised a mere 6 per- cent since then. In 1997, the same paper noted a graduation rate of just 17 percent for special needs students.6 Mississippi lawmakers and parents fought hard FIGURE 3 | STATES WITH EDUCATION SAVINGS ACCOUNTS PROGRAMS, 2015 STATES WITH EDUCATION SAVINGS ACCOUNTS PROGRAMS STATES WITHOUT EDUCATION SAVINGS ACCOUNTS PROGRAMS
  • 16. 8 Report Card on American Education CHAPTER ONE for an account-based choice program, very near- ly passing it in 2014 and finally achieving success the following year. Governor Phil Bryant signed the measure into law in 2015, making Mississippi the third state to enact an account-based choice program. ChoiceadvocatesinTennesseedidnothavetowait long for the fourth program, as lawmakers passed, and Governor William Haslam signed, ESA legisla- tion for students with special needs just weeks af- ter Mississippi. Montana legislators passed an ESA bill as well, but the measure was vetoed by Gover- nor Stephen Bullock. STATES AND DISTRICTS EXPAND WEIGHTED STUDENT FUNDING SYSTEMS School funding methods can give schools a strong incentive to respond positively to competition. In- diana, for example, until recently had a district funding formula that included “ghost students.” Through this method, the state continued to al- locate funds to districts for students the schools were no longer educating.7 Lawmakers wisely re- placed this formula with current-year funding when they introduced school vouchers. Without making this change, the state would have double- funded these students while reducing the incen- tive of districts to respond to competition. Weighted Student Funding (WSF) represents an important, if commonly misunderstood, reform. Most states fund districts according to a formu- la, but the details are important. Many states fund districts rather than schools, and they base it on the previous year’s student count rather than the current count. Arizona has run parallel traditional and WSF sys- tems for decades. For 20 years, Arizona has fund- ed charter schools at the campus level using cur- rent-year counts. All the while, the state has funded its school districts based on the previous year’s count—and has funded districts rather than schools. WSF has not proved a magic bullet to guarantee schoolquality—manyArizonacharterschoolshave closed, and more will likely close at the expiration of their original charter. Comparisons between dis- trict and charter schools have difficulty account- ing for the many possible external causes for ap- parent differences in outcomes. For example, Harvard University scholar Paul Peterson noted that students typically take a temporary academ- ic hit when transferring between schools, and new schools typically have a “shakedown” period dur- ing which they have yet to hit peak performance. Charter sectors with large numbers of new schools full of newly transferred students can negatively bias a snapshot comparison of charter schools. Arizona’s school grading system, however, which equally weighs overall proficiency and academ- ic growth over time, shows a clear advantage for charter schools. In 2013-2014, 40 percent of Arizo- na charter schools earned an A grade compared to only 28 percent of district schools that earned an A. Arizona charters were also relatively underrep- resented at the low end, with 7 percent receiving D grades compared to 9 percent of district schools earning a D. Hawaii implemented WSF during the 2006-2007 school year. Between 2007 and 2013, Hawaii dou- bled or tripled the national average for progress on the four main NAEP examinations (fourth- and eighth-grade reading and mathematics). While no one can prove that WSF was the sole or even pri- mary cause of this high level of improvement, a general trend toward decentralization seems to have served the state well. In an American Institute for Research evalua- tion of Hawaii’s WSF program, a survey of school principals revealed a consensus that WSF had in- creased equity, transparency and campus auton- omy. While many principals expressed the desire for greater resources to be at their disposal, some principals noted that greater control over budgets would prove far more meaningful if they also had control over staffing.8 The move to directly fund schools rather than dis- tricts gives school principals more control over their budgets, better enabling them to compete. Imagine being tasked with running a school with little control over either the budget or staff. If we want to hold school leaders accountable for
  • 17. www.alec.org 9 EDUCATION REFORM: A YEAR IN REVIEW results, it makes sense to give them the authority they need to succeed. STATES CONTINUE TO IMPROVE DIGITAL LEARNING OPPORTUNITIES Digital learning has opened opportunities for stu- dents to take courses that would otherwise be un- available. Online learning has the potential to con- nect more students to high-quality teachers and increase the number of students that highly effec- tive instructors can serve. Students can access ev- erything from technical and career education to advanced science and mathematics instruction to foreign language opportunities through digital learning. Digital Learning Now, an initiative of the Founda- tion for Excellence in Education, produces an an- nual Digital Learning Report Card to measure state laws against the 10 Elements of High-Quality Digital Learning. By 2014, states had implemented and refined the 422 laws touching on digital learn- ing—some far more effectively than others. Over- all, the report card noted progress in 2014, with half of the states improving their grades overall, 14 states moving up one letter grade and nine states earning their way out of the F category since the 2013 report. State policymakers play a critical role in acceler- ating the adoption of new models of learning en- abled by technology. State policy can either re- move barriers to innovative approaches or it can stifle them with restrictions and red tape to pro- tect the status quo. Despite the progress of recent years, only two states—Florida and Utah—earned an A in the 2014 Digital Learning Report Card.9 Lawmakers have made strides, but many miles remain ahead in the journey. FIGURE 4 | DIGITAL LEARNING NOW GRADES BY STATE, 2014 Grading KeyA B C D F
  • 18. 10 Report Card on American Education CHAPTER ONE LAWMAKERS INTRODUCE MULTIPLE SCHOLARSHIP TAX CREDIT BILLS Arizona lawmakers created the first scholarship tax credit program in 1997 when they approved a dollar-for-dollar credit against the state individ- ual income tax for donations to nonprofit groups that provide scholarships for children to attend private schools. Pennsylvania and Florida fol- lowed suit in 2001 with corporate scholarship credits. The 2014 legislative sessions were relatively un- eventful in terms of school choice, although Kan- sas lawmakers created the Tax Credit for Low In- come Students Scholarship Program. The tax credit allows corporations to claim a 70 percent tax credit for contributions to approved nonprof- its that grant private school scholarships. The to- tal amount of tax credits awarded statewide is limited to $10 million. FIGURE 5 | STATES INTRODUCING SCHOLARSHIP TAX CREDIT LEGISLATION, 2015 Lawmakers were anything but inactive in 2015, however, with 23 states introducing scholarship tax credit legislation. In addition to the aforemen- tioned Nevada scholarship tax credit program, Arizona lawmakers included subchapter S corpo- rations in the state’s preexisting corporate schol- arship credit, which expanded the universe of po- tential donors. Montana lawmakers also created a modest scholarship tax credit program in 2015. Although it remains unresolved at the time of this writing, New York Governor Andrew Cuomo took the lead in a bipartisan push for tax cred- its in 2015. Win or lose, history was made with a prominent Democrat governor aggressively ad- vocating for a private choice program. The New York Times reported the following from a public appearance Cuomo made to promote tax credit legislation: STATES THAT INTRODUCED SCHOLARSHIP TAX CREDIT LEGISLATION STATES THAT DID NOT INTRODUCE SCHOLARSHIP TAX CREDIT LEGISLATION
  • 19. www.alec.org 11 EDUCATION REFORM: A YEAR IN REVIEW “There are some areas, frankly, where the public schools are not places where you would want to send your children,” he said at the Shrine Church of St. Jude in Canarsie, Brooklyn. He added that “sending your child to one of these failing public schools is in many ways condemning your child to get a second-class education.”10 “We want you to have the ability to choose where to send your child,” Mr. Cuomo told churchgoers, asking them to contact their legislators. Mr. Cuomo said his father, former Governor Mario M. Cuomo, chose to send him to pa- rochial school, believing that “I needed the nuns to keep me on the straight and narrow.” On the other hand, Mr. Cuomo said he sent his three daughters to public school, citing FIGURE 6 | STATES WITH TAX CREDIT PROGRAMS, 2015 the quality of the public schools in Westches- ter County. (He did not mention that after at- tending public school, two of his daughters went on to graduate from Deerfield Acade- my, a boarding school in Massachusetts.) “There’s no right or wrong,” he said. “But it should be your choice.” SCHOOL VOUCHER PROGRAMS CONTINUE TO ADVANCE Lawmakers continued to debate school voucher legislation in 2015, with Arkansas legislators pass- ing a new school voucher program for children with disabilities. Lawmakers in Wisconsin and Ohio significantly expanded pre-existing voucher programs. Most notably, lawmakers removed the cap from Wisconsin’s statewide voucher program and created a new program for special needs children. STATES WITH TAX CREDIT PROGRAMS STATES WITHOUT TAX CREDIT PROGRAMS
  • 20. 12 Report Card on American Education CHAPTER ONE FIGURE 7 | STATES INTRODUCING SCHOOL VOUCHER LEGISLATION IN 2015 FIGURE 8 | STATES WITH ONE OR MORE SCHOOL VOUCHER PROGRAMS, 2015 STATES THAT INTRODUCED SCHOOL VOUCHER LEGISLATION STATES THAT DID NOT INTRODUCE SCHOOL VOUCHER LEGISLATION STATES WITH ONE OR MORE SCHOOL VOUCHER PROGRAMS STATES WITHOUT SCHOOL VOUCHER PROGRAMS
  • 21. www.alec.org 13 EDUCATION REFORM: A YEAR IN REVIEW With the addition of Arkansas, Figure 8 presents states having one or more school voucher pro- gram. Florida, Louisiana and Ohio have multiple school voucher programs. AFTER THE 2015 SESSIONS A MAJORITY OF STATES HAVE A PRIVATE CHOICE PROGRAM First, the good news: a majority of states (26) have one or more private choice programs. In 2015, a person could drive from Key West, Fla., to the California border near Lake Tahoe and nev- er once enter a state without a private choice program, as displayed in Figure 9. Many of these states contain multiple programs, including Ala- bama, Arizona, Florida, Georgia, Indiana, Iowa, Louisiana, Mississippi, North Carolina, Ohio, Okla- homa, Pennsylvania and Wisconsin. On the other hand, more than 28 percent of American school children live in California, Texas FIGURE 9 | STATES WITH ONE OR MORE PRIVATE CHOICE PROGRAMS 2015 or New York, states in which no children have ac- cess to a private choice program. To put this in perspective, California’s 6.2 million school chil- dren equal the combined student enrollments of the 22 smallest states combined. The more than five million students in Texas equal the combined enrollments of the smallest 20 states. STATE TESTS ALIGN MORE CLOSELY TO NAEP IN 20 STATES, LOWERED IN EIGHT Fifty years have passed since Congress enacted the Elementary and Secondary Education Act in 1965. Congress renamed and revised the statute in 2002, now known as No Child Left Behind (NCLB). As a condition of receiving federal education dollars, NCLB requires states to test students in grades three through eight and again in high school on math and reading achievement. Each state test sets a cut score for what constitutes “proficient” achievement on these math and reading tests. At STATES WITH ONE OR MORE PRIVATE CHOICE PROGRAMS STATES WITHOUT PRIVATE CHOICE PROGRAMS
  • 22. 14 Report Card on American Education CHAPTER ONE the time of this writing, Congress is considering legislation to reauthorize this law, which has stood unchanged since 2002 despite having been sched- uled for renewal in 2007. NCLB requires state participation in fourth-grade and eighth-grade math and reading exams as part of NAEP. NAEP tests have performance level cut scores roughly equivalent to those set by interna- tional organizations that estimate student profi- ciency worldwide.11 In other words, if students are proficient according to NAEP, they likely have a lev- el of content mastery that is globally competitive. Paul Peterson and Matthew Ackerman compared the proficiency standards of state tests to those of NAEP, thus serving as a measure of “truth in adver- tising” for state accountability exams. Their Summer 2015 contained good news overall: In this paper we extend the five prior analy- ses by identifying the changes in state profi- ciency standards between 2011 and 2013, the last year for which the relevant informa- tion is available. We show that many states have raised their proficiency bars since 2011. Indeed, the 2013 data reveal that for the first time, substantially more states have raised their proficiency standards than have let those standards slip to lower levels. Overall, 20 states strengthened their standards, while just 8 loosened them.12 Peterson and Ackerman found that Florida, Idaho, Illinois, Iowa, Kansas, Kentucky, Maryland, Michi- gan, Missouri, New Jersey, New York, North Car- olina, Oregon, Pennsylvania, Utah, South Dakota, Texas, Virginia, Wisconsin and Wyoming improved their alignment with NAEP from 2011 to 2013. Ar- kansas, Louisiana, Minnesota, Mississippi, New Hampshire, New Mexico and Oklahoma lowered the rigor of their state tests. Figure 10 presents state grades by year, with A grades denoting close alignment with NAEP profi- ciency standards, F grades signifying a large gap— much higher student performance on state tests than NAEP. The rigor of state tests fluctuates over time in a dynamic fashion. The Peterson and Ackerman study takes a snapshot of the 2011 to 2013 pe- riod, but things will continue to change state by state each year. In the end, state policymakers (usually a state board of education) will make de- cisions regarding state standards and proficiency cut scores. Policymakers in states with low grades should take action to provide truth in advertising for their students, parents and taxpayers. Many disagreements surround the process of adopting and maintaining state academic stan- dards and tests. No one, however, should support using taxpayer dollars to create what amounts to a state-sponsored system of smoke and mir- rors. The ultimate victims of a state testing sys- tem that labels illiterate and innumerate children “proficient” are the children themselves. CHARTER SCHOOL PARENTS WIN SHOWDOWN WITH NEW YORK MAYOR BILL DE BLASIO Former New York City Mayor Mike Bloomberg sup- ported a policy of co-location for charter schools. Given the considerable expense of Gotham real estate and the availability of empty space in city- owned school buildings, this represented a vital enabling reform in the creation of charter schools. Current New York City Mayor de Blasio, however, made an effort to evict three highly effective char- ter schools from their city-provided facilities, cre- ating a showdown between charter supporters and the new mayor. Governor Cuomo and the New York legislature resolved this dispute in favor of the charter par- ents in a decisive fashion. With the active and vo- cal support of the governor, a bipartisan majori- ty of the New York legislature passed a state law governing co-location policy. Chalkbeat New York, a web site covering New York education, provid- ed the following description of the impact of the legislation: The new law requires the city to provide new charter schools with free space inside the city’s
  • 23. www.alec.org 15 EDUCATION REFORM: A YEAR IN REVIEW Strength of State Proficiency Standards 2013 Overall Averages by Year Change in Difference Between State and NAEP Rank State 4thGrade 8th Grade 2003 2005 2007 2009 2011 2013 2011– 2013** 2005– 2013**Math Reading Math Reading 1 New York A A A A B- C C+ D+ B- A 31.5 35.3 2 Wisconsin A A A A D+ C- C- D+ D+ A 28.8 38.7 3 Utah A A A A D+ D+ C- D+ A 31.6 40.2 4 North Carolina A A A A D- F D C- C- A 40.6 50.2 5 Pennsylvania A A A A C+ C C C C A 9.7 24.6 6 Massachusetts A A A B- A A A A A A 6.9 -9.6 7 Kentucky A A B+ A B B- C C C A 13.7 15.5 8 Missouri B+ A B+ A A A A A B+ A -7.0 -12.9 9 Tennessee A A C+ A F F F F A A 40.9 47.5 10 Florida B- B+ B- B+ B- C+ C+ C C B 17.7 9.1 11 Washington B+ C+ B+ B B- C B- B- B B 11.8 11.2 12 Colorado B- B B+ B- D+ D B- B- B B 30.1 28.0 13 Michigan A C A C+ C C- D D D- B 26.1 18.2 14 Illinois B- B C+ B C+ C D D D B- -4.9 10.5 15 Minnesota B+ C+ B C+ B- B- B B- -34.7 0.9* 16 New Mexico B+ B+ D+ B+ B- B- C+ B B- 2.0 -0.8 17 New Jersey C A B- C C C C C+ C+ B- 20.8 9.5 18 California D+ C A B- A B B+ C+ C+ C+ 3.0 -5.1 19 Maine B C+ C+ C A A B- C+ C+ C+ -5.0 -24.3 20 Virginia C+ B C+ C C- D+ D+ D D C+ 4.1 15.7 21 New Hampshire B C+ C+ C B- B- B C+ -35.6 -4.6* 22 Nevada D+ C- B+ B+ C+ C C C+ C+ -8.2 -0.2 23 Rhode Island B- B- C+ C B+ B B- C+ C+ C+ 11.5 -6.8 24 Oregon C+ C C C+ C C- C- C- C -7.6 -0.7 25 Maryland C C C+ C B C C- C- C- C 14.8 3.5 26 Hawaii B B- D+ C- A A A C+ C C 0.3 -19.6 27 Iowa C C D+ B- D+ C- D+ D+ C 13.9 7.9 28 North Dakota C C+ C C C+ C C C- C C 12.0 1.7 29 Montana B- D+ C+ C- C C+ C C C C 9.4 -6.2 30 District of Columbia C B- D- C C C C C -3.3 -5.9 31 Nebraska C C C C- D- F F C C 23.3 15.0 32 Wyoming C C C C A A C C C- C -11.5 -30.5 33 Delaware C C D+ C C C C- D+ C+ C -11.8 -0.6 34 Arizona C+ D+ C C- B+ D+ C- D+ C C 18.6 6.3 35 South Dakota C C- C- C C D+ D+ C C- C 13.5 5.9 36 Indiana C C- D C C C- C C C- C- 11.2 -1.1 37 Connecticut C- C+ D- C C C C C C- C- 8.9 -3.9 38 Texas C+ C- D+ D- F D+ D- F D- C- 17.4 3.9 39 Ohio C D C- D+ B- C C- C C- C- 6.5 -7.0 40 Mississippi D C F C D D- D- C C C- 18.2 10.2 41 Kansas C D+ C- D C C- C- D D D+ -6.5 -1.7 42 Alaska C- D+ C- D C- D+ D D+ D+ D+ 13.9 0.8 43 South Carolina D D D+ C A A A C- D+ D+ -20.8 -39.8 44 Arkansas D D D+ D+ B B C+ C- D+ D -8.2 -25.4 45 Oklahoma D+ C- D- D- D- D- F C C- D 19.4 3.8 46 Louisiana D D- D D+ C C C- D+ D+ D 5.2 -10.8 47 Idaho D D- D D- C- D D+ D D- D 15.1 -1.3 48 Georgia D F F F D- D- F F F F 15.7 -4.7 49 Alabama F F F F D- D- F F F 13.7 -7.0 Vermont B B B- B- West Virginia F D- C B FIGURE 10 | THE STRENGTH OF STATE PROFICIENCY STANDARDS * 2005 data are missing; change is calculated from 2007 ** A positive number indicates narrowing the difference between the NAEP and state exams NOTE: Grades are blue in states with rising standards Source: Paul Peterson’s and Matthew Ackerman’s calculations base on state tests and NAEP
  • 24. 16 Report Card on American Education CHAPTER ONE own buildings or public funding to cover rent in a private facility. The legislation is a rebuke from state lawmakers of de Blasio’s criticism of charter schools during the mayoral cam- paign and his early months in office. One challenge the law poses for de Blasio is that it makes financial sense to keep charter schools in city buildings. If the city doesn’t pro- vide space, the law provides for charters to re- ceive an extra funding allowance for each stu- dent, which in 2015 would be $2,775, from the city. Thirteen charter schools have already been approved to open that year, serving 2,000 stu- dents at first and 5,800 at full capacity. Private space for those schools would cost as much as $5 million in the 2015-16 school year and $16 million once they are all at capacity, based on enrollment estimates. In addition, the city is planning to spend $5.4 million next year for three displaced Success Academy schools, which will have fewer than 500 students next year, to operate in Catholic school buildings.13 The bipartisan victory of the New York charter school community, with the benefit of hindsight, may be viewed as a watershed moment for the en- tire parental choice movement. New York parents want more choice in education, and state lawmak- ers delivered a decisive victory to them. CHARTER SCHOOLS CONTINUE NATIONWIDE ADVANCE The number of states without a charter school law on the books continues to shrink to a handful of rural states. In 2013, Mississippi passed new char- ter school legislation. In 2015, Alabama Governor Robert Bentley made Alabama the latest state to join the charter school family. FIGURE 11 | STATES WITH A CHARTER SCHOOL LAW, 2015 STATES WITH A CHARTER SCHOOL LAW STATES WITHOUT A CHARTER SCHOOL LAW
  • 25. www.alec.org 17 EDUCATION REFORM: A YEAR IN REVIEW Minnesota lawmakers passed the nation’s first charter school law in 1991, and at the time of this writing, almost three million students attend- ed public charter schools in 42 states around the country. Only a handful of states, however, have FIGURE 12a | ESTIMATED NUMBER OF PUBLIC CHARTER SCHOOLS AND STUDENTS, 2014-15 State New Charters, Fall 2014 Closed Charters, Spring 2014 Net Gain Charters, 2014-15 Total Charter Schools, 2014-15 Charter School Growth Estimated Enrollment, 2014-15 Charter Enrollment Growth AK 0 0 0 27 0% 6,300 2% AR 6 0 6 45 15% 23,100 41% AZ 31 13 18 623 3% 225,000 20% CA 88 36 52 1,184 5% 547,800 7% CO 16 2 14 214 7% 98,000 5% CT 4 0 4 22 22% 8,200 17% DC 5 (+2 campuses) 4 (+2 campuses) 0 61 (on 112 Campuses) 0% 35,300 16% DE 3 0 3 24 14% 12,500 13% FL 56 28 28 653 4% 275,000 20% GA 11 4 7 103 7% 80,600 16% HI 1 0 1 34 3% 10,400 6% IA 0 0 0 3 0% 300 -4% ID 3 2 1 48 2% 19,600 -4% IL 3 (+2 campuses) 2 2 66 (on 148 campuses) 3% 63,000 6% IN 6 2 4 79 5% 44,300 25% KS 0 0 0 11 0% 2,700 6% LA 18 6 12 129 10% 74,000 25% MA 3 6 -3 78 -4% 35,700 3% MD 3 2 1 53v 2% 18,600 5% ME 1 0 1 6 20% 900 135% passed what studies rank as strong charter laws. One sign of weak laws is an inability of charter school operators to satisfy demand for charter school seats. Nationwide, more than a million stu- dents sit on charter school waiting lists.14 The Center for Education Reform annually grades state charter school laws on an A through F scale. In 2015 they gave the charter school laws of four states—Arizona, Indiana, Michigan and Minneso- ta, plus the District of Columbia—an A grade. An additional eight states—California, Colorado, Flor- ida, Idaho, Missouri, Nevada, South Carolina and Utah—received B Grades. TheNationalAllianceforPublicCharterSchoolslist- ed 10 states that enacted legislation to strengthen their authorizing environments in 2014, drawing attention especially to Alaska, New York, South Carolina and Tennessee While a large majority of states now have char- ter school laws, a majority of these laws still con- tain significant weaknesses and departures from best practices—such as caps on the number of schools, single authorizers and district-only autho- rizing. Figure 13 shows that only distinct minori- ties of states have relatively strong charter laws,
  • 26. 18 Report Card on American Education CHAPTER TWO State New Charters, Fall 2014 Closed Charters, Spring 2014 Net Gain Charters, 2014-15 Total Charter Schools, 2014-15 Charter School Growth Estimated Enrollment, 2014-15 Charter Enrollment Growth MI 17 7 10 307 3% 159,000 16% MN 10 1 9 158 6% 47,900 11% MO 2 1 1 51 2% 20,000 8% NC 25 1 24 151 19% 70,800 22% NH 4 0 4 23 21% 3,000 43% NJ 5 5 0 87 0% 41,000 27% NM 4 2 2 97 2% 24,400 14% NV 4 0 4 38 12% 28,200 15% NY 17 2 15 248 6% 106,000 17% OH 11 27 -16 384 -4% 146,000 18% OK 3 1 2 27 8% 18,700 40% OR 2 1 1 125 1% 32,000 12% PA 4 4 0 176 0% 128,000 -1% RI 3 0 3 21 17% 7,100 19% SC 10 3 7 66 12% 27,400 18% TN 14 5 9 80 13% 20,900 72% TX 2 (+53campuses) 7 (+18campuses 35 275 (on 721 campuses) 15% 280,000 18% UT 15 0 15 110 16% 65,400 19% VA 1 0 1 7 17% 46,800 7% WA 1 0 1 1 45 WI 22 22 0 245 0% 46,800 7% WY 0 0 0 4 0% 600 27% Total 491 216 278 6,724 4% 2,890,000 14% FIGURE 12b | ESTIMATED NUMBER OF PUBLIC CHARTER SCHOOLS AND STUDENTS, 2014-15 Public charter school data can be found on the Public Charter School Dashboard: http://dashboard.publiccharters.org/dashboard/home
  • 27. www.alec.org 19 EDUCATION REFORM: A YEAR IN REVIEW FIGURE 13 | STATES WITH A- OR B- GRADED CHARTER SCHOOL LAWS and hundreds of thousands of children sit on the waiting lists of charter schools in the states with “strong” laws. REFORM IS ROLLING BUT HAS MUCH FARTHER TO GO While reform momentum continues, the accom- plishments to date only represent critical steps in a long journey. Average children continue to face waiting lists if they want to attend high-quality charter schools and have limited access to private choice programs. They also attend schools gov- erned by human resource policies of the sort de- cried in the Vergara. STATES WITH A- OR B- GRADED CHARTER SCHOOL LAWS STATES WITHOUT A- OR B- GRADED CHARTER SCHOOL LAWS Nevertheless, decades of K-12 practice have begun a fundamental shift. Lawmakers are now think- ing far more deeply about what it will take to im- prove academic outcomes after decades of re- form strategies that amounted to sending school districts more money and hoping for the best. Pa- rental choice has proved both successful and pop- ular with parents. Lawmakers have begun serious efforts to address injurious human resource issues that threaten students. The political forces invest- ed in maintaining the status quo remain incredibly powerful, but over the past decade it has become increasingly common for dedicated lawmakers to prevail. Reformers are not only seeing more victo- ries, but also increasingly able to obtain strong bi- partisan for their efforts.
  • 28. 20 Report Card on American Education CHAPTER ONE ENDNOTES 1. Fleischman, H.L. et al. 2010. “Highlights From PISA 2009: Performance of U.S. 15-Year-Old Students in Reading, Math- ematics, and Science Literacy in an International Context.” National Center for Education Statistics. Available at http:// nces.ed.gov/pubs2011/2011004.pdf. 2. Nagourney, Adam. 2014. “Las Vegas Schools Groan From Growing Pains.” The New York Times Oct. 6, 2014.” Available at http://www.nytimes.com/2014/10/07/us/las-vegas-schools-groan-from-growing-pains.html. 3. Chartier, Michael. 2015. “Everything You Need to Know About Nevada’s Universal ESA Bill.” Friedman Foundation for Educational Choice. Available at http://www.edchoice.org/Blog/May-2015/Everything-You-Need-to-Know-About- Nevada-s-Univers. 4. Foundation for Excellence in Education. 2015. “Nevada Becomes National Leader in Education Reform.” Available at http://excelined.org/news/nevada-becomes-national-leader-in-education-reform/. 5. Decision available at http://studentsmatter.org/wp-content/uploads/2014/06/Tenative-Decision.pdf. 6. Editorial Board. 2014. “Special Ed Vouchers Would Give Parents Some Choices.” The Clarion-Ledger http://archive. clarionledger.com/article/20140225/OPINION01/302250022. 7. Hayden, Maureen. 2011. “Formula to fund Indiana public schools gets overhauled.” Indiana Economic Digest Apr. 30, 2011. Available at http://www.indianaeconomicdigest.net/main.asp?SectionID=31&subsectionID=135&article ID=59770. 8. Levin, Jesse et al. 2013. “Evaluation of Hawaii’s Weighted Student Funding.” American Institutes for Research, June 2013. Available at https://www.hawaiipublicschools.org/DOE%20Forms/WSF/WeightedStudentFormulaEval061913. pdf. 9. Foundation for Excellence in Education. 2014. “Digital Learning Report Card 2014.” Available at http://excelined. org/2014DLNReportCard/offline/download.pdf. 10. Kaplan, Thomas. 2015. “Cuomo Promotes Tax Credits for Families of Students at Private Schools.” The New York Times, May 17, 2015. Available at http://www.nytimes.com/2015/05/18/nyregion/cuomo-promotes-tax-credits-for-families- of-students-at-private-schools.html?_r=0. 11. Peterson, Paul E. and Matthew Ackerman. 2015. “States Raise Proficiency Standards in Math and Reading.” Education Next Summer 2015, Available at http://educationnext.org/states-raise-proficiency-standards-math-reading/. 12. Ibid. 13. Decker, Geoff. 2014. “As Charter Sector Continues to Swell, a Space Dilemma Grows for De Blasio.” Chalkbeat New York Jun. 6, 2014. Available at http://ny.chalkbeat.org/2014/06/06/as-charter-sector-continues-to-swell-a-space-dilemma- grows-for-de-blasio/#.VYmjV_lVikq. 14. Kern, Nora and Wentana Gebru. 2014. “Waiting Lists to Attend Charter Schools Top 1 Million Names.” National Alliance for Public Charter Schools, May 2014. Available at http://www.publiccharters.org/wp-content/uploads/2014/05/ NAPCS-2014-Wait-List-Report.pdf.
  • 29. 2CHAPTER Appropriately Equipping Our Students Today for a Prosperous Tomorrow
  • 30. 22 Report Card on American Education Appropriately Equipping Our Students Today for a Prosperous Tomorrow Education policy cannot hope to solve the prob- lem alone, but it can contribute. Current age de- mographic projections foretell an impending fu- ture in which the demand for public dollars in the form of health care, public pension outlays and education expenses exceeds the likely sup- ply of public dollars—absent a substantial and sustained period of above-average econom- ic growth. Better-educated students today will translate into growth and innovation tomorrow. Appropriately equipping the America of to- morrow must start today. Academic achieve- ment and attainment both strongly predict fu- ture earnings. Improved mastery of reading and mathematics strongly influences future college and career success for students in both low- and high-income households. For instance, the Na- tional Center for Education Statistics recently completed a tracking study of 2002 high school sophomores and their success in earning bach- elors’ degrees by 2012. Figure 2 shows the dif- ferences in college success among students from low-income families by their mathematics per- formance quartile. Among students from low-income households, those scoring in the highest 25 percent of overall mathematics achievement were more than eight times more likely to have completed a bache- lor’s degree than those who scored in the low- est performing mathematics quartile. Students from low-income families in the lowest quartile of achievement, meanwhile, had only a one-in-20 rate of obtaining a bachelor’s degree. Over the next 15 years public pensions will be strained and tax revenues may shift as many baby boomers move from their prime earning years to fixed incomes. In addition, demands for public health spending, at the state level primarily through the Medicaid program, will rise as the elderly population increases. In 2010, the nation’s largest retirement desti- nation, Florida, had the nation’s largest elderly population as a percentage of its total. However, looking forward in census projections to the year 2030, the vast majority of states will have a larg- er percentage of elderly population than Amer- ica’s prime retirement destination does today. Figure 1 shows the projections by state for pop- ulations of people 65 and older in 2030, along with Florida’s percentage of the same in 2010. Many states face increased spending pressures from both ends of the age spectrum due to the large increase in the retired populations coupled with large projected increases in their youth pop- ulation. The percentage of the population in the prime working years (ages 18 to 64) will shrink in all 50 states as both the elderly and youth pop- ulations increase. The youth of today will face considerable challenges as they become middle- aged taxpayers supporting an increasingly aging populace. Much of the working-age population in 2030 and beyond, those primarily tasked with keeping vital public services viable, sit in K-12 classrooms now. One major responsibility of pol- icymakers today is to ensure the policies enacted now increase return on K-12 investment.
  • 31. www.alec.org 23 APPROPRIATELY EQUIPPING OUR STUDENTS TODAY FOR A PROSPEROUS TOMORROW FIGURE 1 | PROJECTIONS FOR THE PERCENTAGE OF POPULATION AGED 65+ IN 2030 Source: United States Census Bureau 13.2%   14.7%   15.6%   15.9%   16.5%   17.6%   17.8%   17.8%   17.8%   18.0%   18.1%   18.1%   18.2%   18.3%   18.6%   18.8%   18.9%   19.2%   19.4%   19.5%   19.7%   19.7%   19.8%   20.0%   20.1%   20.2%   20.2%   20.3%   20.4%   20.5%   20.6%   20.9%   21.3%   21.3%   21.4%   21.4%   21.5%   22.0%   22.1%   22.3%   22.4%   22.6%   23.1%   23.5%   24.4%   24.8%   25.1%   25.8%   26.4%   26.5%   26.5%   27.1%   0.0%   5.0%   10.0%   15.0%   20.0%   25.0%   30.0%   Utah   Alaska   Texas   Georgia   Colorado   Maryland   California   North  Carolina   2010  Florida  (NaGon's  Highest  in  2010)   Illinois   Washington   Indiana   Oregon   Idaho   Nevada   Virginia   Minnesota   Tennessee   Oklahoma     Michigan     Louisiana   United  States   Kentucky   New  Jersey   New  York   Missouri   Kansas   Arkansas   Ohio   Mississippi   Nebraska   Massachuse[s   Wisconsin   Alabama   New  Hampshire   Rhode  Island   ConnecGcut   South  Carolina     Arizona   Hawaii   Iowa   Pennsylvania   South  Dakota   Delaware   Vermont   West  Virginia   North  Dakota   Montana   New  Mexico   Maine   Wyoming     Florida  
  • 32. 24 Report Card on American Education CHAPTER TWO FIGURE 2 | LOW-INCOME SPRING 2002 SOPHOMORES WHO EARNED A BACHELOR’S DEGREE OR HIGHER BY 2012 FIGURE 3 | HIGH-INCOME SPRING 2002 SOPHOMORES WHO EARNED A BACHELOR’S DEGREE OR HIGHER BY 2012 Source: National Center for Education Statistics Source: National Center for Education Statistics 5%   12%   23%   41%   Lowest  Quar2le   Second  Quar2le   Third  Quar2le   Highest  Quar2le   21%   41%   61%   74%   Lowest  Quar2le   Second  Quar2le   Third  Quar2le   Highest  Quar2le   NAEP Mathematics Quartile NAEP Mathematics Quartile
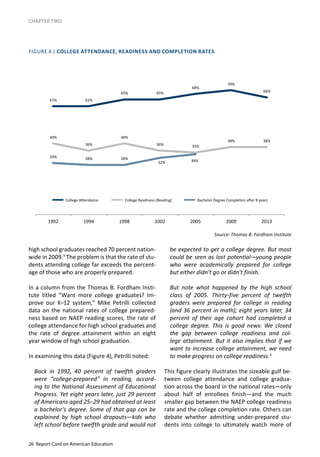
  • 33. www.alec.org 25 APPROPRIATELY EQUIPPING OUR STUDENTS TODAY FOR A PROSPEROUS TOMORROW dropouts, in essence, begin with the problems of the K-12 system. Fixing the leaks in America’s bro- ken human capital pipeline is a matter of utmost urgency for lawmakers. NAEP READING SCORES AS A PREDICTOR OF COLLEGE SUCCESS How well-prepared are students to face the chal- lenges of tomorrow? The National Center for Ed- ucation Statistics recently conducted a study that sheds light on this question. The National Assess- ment Governing Board established a commis- sion to study the use of 12th-grade NAEP read- ing and mathematics exams to estimate college readiness. The commission conducted a series of technical studies and reached the following conclusion: Students who are considered ready for college are generally expected to be academically pre- pared for entry-level college coursework. A combination of factors contributes to students’ readiness for college, including content knowl- edge, cognitive strategies, learning skills, and transitioning skills.4 As a measure of students’ knowledge in core subject areas, the potential use of NAEP results as an indicator of students’ academic preparedness for postsecondary ed- ucation and training is being explored by the Governing Board. A series of studies conducted since 2008 sup- ported inferences about performance on the grade 12 NAEP mathematics and reading as- sessments in relation to academic preparedness for college. The results of the research studies indicate that students scoring at or above 163 on the NAEP mathematics scale, and students scoring at or above 302 on the NAEP reading scale are likely to possess the knowledge, skills, and abilities in those subjects that would make them academically prepared for college. Based upon the 2013 NAEP, the commission found that only 39 percent of the class of 2013 qualified as “college ready” in math and 38 per- cent in reading.2 These results provide an impor- tant clue as to why so many students drop out of college. The rate of college attendance for recent Figure 3 presents similar data for students from middle- and higher-income households. Income plays a large role when it comes to earn- ing degrees. Students in high-income households scoring in the lowest quartile had a 21 percent rate of earning a bachelor’s degree by 2012 com- pared to only 5 percent among similar peers from lower-income families. High-scoring students from middle- and high-income backgrounds ob- tained a degree at a much higher rate than their low-income peers with similar math ability—71 percent to 41 percent. In addition to family income, K-12 academic achievement also played a big role in college suc- cess—with the highest-scoring students from mid- dle- and high-income households earning bache- lors’ degrees at a 74 percent rate. This was more than three-times the rate of their economic peers with bottom quartile mathematics achievement.1 America’s approaching age demographic chal- lenge means the expression “a mind is a terrible thing to waste” will loom ever larger. The coun- try does not have children whose educations it can afford to waste—whether they are from low- , middle- or high-income families. The future of America needs all students sitting in the class- room today to become productive and innova- tive prosperity generators. This, of course, does not mean that every student needs to attend col- lege. In fact, many students who choose to enter the workforce rather than an institution of high- er learning find themselves earning higher wages with less debt than their peers with college de- grees. Many productive and innovative people either did so or (à la Bill Gates, Michael Dell, and others) dropped out of college to pursue their careers. A solid foundation of academic skills and knowl- edge is incredibly useful in whatever walk of life students pursue. All students should have the ac- ademic skills to succeed in college and career. The pages that follow demonstrate that Ameri- can colleges currently accept far more students than the American K-12 system adequately pre- pares for college success. High rates of college
  • 34. 26 Report Card on American Education CHAPTER TWO high school graduates reached 70 percent nation- wide in 2009.3 The problem is that the rate of stu- dents attending college far exceeds the percent- age of those who are properly prepared. In a column from the Thomas B. Fordham Insti- tute titled “Want more college graduates? Im- prove our K–12 system,” Mike Petrilli collected data on the national rates of college prepared- ness based on NAEP reading scores, the rate of college attendance for high school graduates and the rate of degree attainment within an eight year window of high school graduation. In examining this data (Figure 4), Petrilli noted: Back in 1992, 40 percent of twelfth graders were “college-prepared” in reading, accord- ing to the National Assessment of Educational Progress. Yet eight years later, just 29 percent of Americans aged 25–29 had obtained at least a bachelor’s degree. Some of that gap can be explained by high school dropouts—kids who left school before twelfth grade and would not FIGURE 4 | COLLEGE ATTENDANCE, READINESS AND COMPLETION RATES be expected to get a college degree. But most could be seen as lost potential—young people who were academically prepared for college but either didn’t go or didn’t finish. But note what happened by the high school class of 2005. Thirty-five percent of twelfth graders were prepared for college in reading (and 36 percent in math); eight years later, 34 percent of their age cohort had completed a college degree. This is good news: We closed the gap between college readiness and col- lege attainment. But it also implies that if we want to increase college attainment, we need to make progress on college readiness.4 This figure clearly illustrates the sizeable gulf be- tween college attendance and college gradua- tion across the board in the national rates—only about half of enrollees finish—and the much smaller gap between the NAEP college readiness rate and the college completion rate. Others can debate whether admitting under-prepared stu- dents into college to ultimately watch more of Source: Thomas B. Fordham Institute 61%   61%   65%   65%   68%   70%   66%   40%   36%   40%   36%   35%   38%   38%   29%   28%   28%   32%   34%   1992   1994   1998   2002   2005   2009   2013      College  A3endance        College  Readiness  (Reading)      Bachelor  Degree  CompleCon  aDer  8  years  
  • 35. www.alec.org 27 APPROPRIATELY EQUIPPING OUR STUDENTS TODAY FOR A PROSPEROUS TOMORROW them fail to finish represents good policy. How- ever, it’s an unambiguously good thing if more K-12 students obtain the academic skills needed to succeed in college and career. Unfortunately, 12th-grade NAEP reading profi- ciency rates are only available from a handful of states, and the mathematics college readiness rate for any state cannot be accessed. Fortunate- ly, NAEP samples state cohorts of students at dif- ferent times in their K-12 careers.5 This chapter will demonstrate that the eighth-grade proficien- cy rates of a student cohort closely correspond to the proficiency rates for the same cohort of students when they reach 12th-grade. The good news, therefore, is that NAEP eighth-grade pro- ficiency rates reveal something important about the quality of the college readiness pipeline in each state. The bad news is that the information received on college readiness by state varies only in degrees of negativity, as demonstrated below. STATE-LEVEL PIPELINES: LINKING EIGHTH- AND 12TH-GRADE NAEP SCORES BY COHORT The National Center for Education Statistics has established that NAEP 12th-grade reading pro- ficiency predicts success in college. Only a small number of states have reported 12th-grade NAEP reading proficiency rates. A quick examination of those rates demonstrates a strong relationship between 12th-grade rates and the eighth-grade rates for the same cohort of students four years earlier. NAEP provides eighth-grade reading pro- ficiency rates for all 50 states, and these rates provide a sense of the college readiness pipeline in each state. NAEP’s finding of a national 39 percent college readiness rate based on mathematics achieve- ment and 38 percent rate based upon reading has limitations. NAEP tests representative samples of students in order to draw conclusions about larg- er populations. The reading and math samples in any given year represent different samples of stu- dents. Therefore, the percentage of students pre- pared for college in both reading and mathemat- ics cannot be determined through NAEP scores, because of the small percentage of students test- ed in both subjects. Because the percentage of students college- ready in both math and reading at the state lev- el cannot be determined from NAEP data, only reading scores will be considered. It is certain- ly possible for a student to be college-ready in reading, while being prevented from graduating by a lack of math skills. Readers should view the college-readiness reading rates as a ceiling for a state’s total college readiness rate. The total rate only can be lower than the reading rate; it can- not be higher. Reading comprehension, after all, represents a crucial mathematical skill when at- tempting to reason one’s way through a word problem. A lack of math skills among highly liter- ate high school graduates may sink them in col- lege, but an inability to read will almost certainly prove fatal to a college career. Many college ma- jors allow students to skirt high-level mathemat- ics courses, but none allow them to avoid learn- ing from written texts. With this understanding, consider NAEP reading proficiency rates by state. National averages can only inform state-level policy making to a limit- ed degree. Unfortunately, NAEP only provides 12th-grade reading data (and thus college read- iness rates based on reading) for a small number of states. NAEP eighth-grade reading proficiency rates (available in all states) strongly predict subse- quent 12th-grade proficiency rates for the same cohort of students. For example, the reading pro- ficiency rates for the class of 2013 as eighth-grad- ers (in 2009) were similar to that of the reading proficiency rates for the same cohort of stu- dents as high school seniors in 2013. In essence, a state’s eighth-grade reading proficiency is an in- dicator of likely future post-secondary success at the aggregate level. NAEP eighth-grade reading proficiency therefore represents an important indicator of a state’s college readiness pipeline. Federal law creates a powerful financial in- centive for states to participate in fourth- and eighth-grade NAEP testing, but 12th-grade test- ing remains voluntary at the state level. Thirteen
  • 36. 28 Report Card on American Education CHAPTER TWO FIGURE 5 | READING PROFICIENCY RATES FOR THE CLASS OF 2013 AS EIGHTH GRADERS IN 2009 AND 12TH GRADERS IN 2013 Arkansas C onnecticut Idaho Illinois Iow aM assachusetts M ichigan N ew H am pshire N ew JerseySouth D akota TennesseW estVirginia Arkansas C onnecticut Idaho Illinois Iow aM assachusetts M ichigan N ew H am pshire N ew JerseySouth D akota TennesseW estVirginia 2013 12TH GRADE READING PROFICIENCY 2009 8TH GRADE READING PROFICIENCY 2009 12TH GRADE READING PROFICIENCY 2005 8TH GRADE READING PROFICIENCY 29%   43%   32%   39%   40%   39%   46%   44%   39%   40%   29%   26%   34%   25%   32%   31%   34%   44%   38%   38%   37%   22%   Arkansas   Connec7cut   Florida   Idaho   Illinois   Iow a  M assachuseBs  New  Ham pshire   New  Jersey    South  Dakota  W est  Virginia     33%   50%   36%   41%   39%   40%   43%   37%   45%   41%   39%   31%   28%  27%   43%   32%   33%   33%   32%   43%   31%   39%   42%   37%   28%   22%   Arkansas  Connec7cut   Florida   Idaho   Illinois   Iow a   M assachuseBs   M ichigan   New  Ham pshire  New  Jersey    South  Dakota   Tennesse  W est  Virginia     FIGURE 6 | READING PROFICIENCY RATES FOR THE CLASS OF 2009 AS EIGHTH GRADERS IN 2005 AND TWELFTH GRADERS IN 2009 Source: National Center for Education Statistics Source: National Center for Education Statistics
  • 37. www.alec.org 29 APPROPRIATELY EQUIPPING OUR STUDENTS TODAY FOR A PROSPEROUS TOMORROW fit comfortably with the NAEP college readiness rate. The ACT found a college readiness rate of 64 percent for English, 44 percent for reading, 44 per- cent for math and 36 percent for science. Thus, the ACT reading rate was somewhat higher than that provided by NAEP, but the difference between a broad population measure (NAEP) and a self-se- lected group (ACT) easily could explain a gap of 6 percent, even if the standards were identical. The ACT found that only 26 percent of students who took the ACT test in 2013 met the college-readi- ness benchmark in all four subjects (English, read- ing, math and science).6 The difference between the college readiness rate based on the read- ing test alone (44 percent) and the percentage of those college ready in all four subjects (26 percent) should further reinforce that NAEP reading scores serve only as a ceiling for college-readiness. Again, when considering the NAEP data, some stu- dents prepared in reading can be poorly prepared in other subjects. The actual percentage of well- prepared students in reading should be considered higher than the actual percentage of college-ready students in every case. In other words, reading readiness alone overestimates total college read- iness with regards to the NAEP data just as it does in the ACT (where 44 percent scored college ready according to their reading scores but only 26 per- cent qualified as college ready in all subjects). Given this context, NAEP eighth-grade reading proficiency rates serve as a rough upper limit on the college proficiency pipeline for each state’s near future. A student’s lack of preparation in oth- er academic subjects can certainly further impede college success, but a lack of ability to process and fully comprehend text will inhibit post-secondary success. Figure 7 presents eighth-grade reading proficiency rates for the entire student population by state or jurisdiction from the 2013 NAEP. These rates are low for all states. Even the top per- forming state, Massachusetts, has a minority of eighth graders on track for college success based upon their reading ability alone. Also, achievement gaps play a strong role in the list. The top 10 states stand apart from the national average in both states—Arkansas, Connecticut, Florida, Idaho, Illi- nois, Iowa, Massachusetts, Michigan, New Hamp- shire, New Jersey, South Dakota, Tennessee and West Virginia—volunteered to have their 12th graders participate in the 2013 NAEP. A similar pattern emerges when examining the eighth- and 12th-grade reading proficiency rates for the class of 2009, as seen in Figure 6. Data from both the class of 2009 and the class of 2013 demonstrate that eighth- and 12th-grade reading proficiency rates do not change dramat- ically, with a similar tendency for slightly higher rates for the cohort as 12th graders. One should expect the higher rates for 12th graders given stu- dent attrition rates. Individual students, of course, move in and out of states over time, making them eligible for inclusion in the NAEP samples of differ- ent states. The aggregate impact of this should be minimal, however, unless a particular state is sys- tematically losing well-prepared students while gaining poorly performing students from other states. Dropouts, however, represent a more pervasive cause of the change in these numbers, and almost certainly help explain why the 12th-grade num- bers are consistently higher than the eighth- grade numbers. Many academically lower-performing students drop out of school between their eighth- and 12th-grade years, making them unavail- able for NAEP testing as 12th-graders. Therefore, 12th-grade scores (for the students still attend- ing school) would likely look better than eighth- grade scores, all else being equal, even if the co- hort makes an average amount of progress during their high school careers. The numbers presented in this chart comport well with an analysis by the American College Test (ACT), which calculates the percentage of students taking the nationwide ACT college readiness ex- ams. These standards differ from those of NAEP in rigor and they are only for students taking the ACT tests—not for the general population. Thus, the rate of students taking ACT exams can influ- ence the rates of college readiness. Despitetheselimitations,theACTnationalnumbers
  • 38. 30 Report Card on American Education CHAPTER TWO FIGURE 7 | NAEP EIGHTH GRADE READING PROFICIENCY RATES, 2013 17%   20%   22%   24%   25%   25%   28%   28%   29%   29%   29%   30%   30%   31%   31%   32%   33%   33%   33%   33%   33%   34%   35%   35%   36%   36%   36%   36%   36%   36%   36%   37%   37%   37%   38%   38%   38%   38%   39%   39%   40%   40%   41%   42%   42%   42%   44%   45%   45%   46%   48%   0   0.1   0.2   0.3   0.4   0.5   0.6   District  of  Columbia   Mississippi   New  Mexico   Louisiana   Alabama   West  Virginia   Arizona   Hawaii   Oklahoma   California   South  Carolina   Arkansas   Nevada   Texas   Alaska   Georgia     North  Carolina   Michigan   Tennessee   Florida   Delaware   North  Dakota   Indiana   New  York   South  Dakota   Missouri   Kansas   Rhode  Island   Illinois   Virginia   Wisconsin   Nebraska   Iowa   Oregon   Wyoming   Kentucky   Maine   Idaho   Ohio   Utah   Colorado   Montana   Minnesota   Washington   Pennsylvania   Maryland   New  Hampshire   Vermont   ConnecZcut   New  Jersey   Massachuses   0% 5% 10% 15% 20% 25% 30% 35% 40% 45% 50% Source: National Center for Education Statistics
  • 39. www.alec.org 31 APPROPRIATELY EQUIPPING OUR STUDENTS TODAY FOR A PROSPEROUS TOMORROW FIGURE 8 | NAEP EIGHTH GRADE GENERAL-EDUCATION STUDENTS ELIGIBLE FOR A FREE OR REDUCED LUNCH STUDENTS SCORING “PROFICIENT OR BETTER” 13%   15%   15%   19%   19%   20%   21%   21%   21%   22%   22%   22%   22%   23%   23%   23%   24%   24%   25%   25%   25%   26%   26%   26%   26%   26%   26%   27%   27%   27%   27%   27%   28%   28%   28%   28%   28%   29%   29%   29%   31%   31%   31%   31%   31%   32%   32%   32%   34%   36%   37%   0%   5%   10%   15%   20%   25%   30%   35%   40%   District  of  Columbia   Mississippi   Alabama   Arizona   Louisiana   South  Carolina   New  Mexico   West  Virginia   Michigan   Virginia   California   Georgia   Texas   North  Dakota   Delaware   North  Carolina   Arkansas   Illinois   Oklahoma   Tennessee   Alaska   Maryland   Rhode  Island   Hawaii   Nevada   Ohio   Florida   Nebraska   Missouri   Indiana   Kansas   New  York   Iowa   Oregon   Kentucky   Wisconsin   Minnesota   South  Dakota   ConnecWcut   Colorado   Montana   New  Hampshire   Utah   Wyoming   Idaho   Pennsylvania   New  Jersey   Washington   Maine   Vermont   Massachuse[s  
  • 40. 32 Report Card on American Education CHAPTER TWO family income and student ethnicity but still fail to teach a majority of children to read proficiently. Judging the relative effectiveness of state K-12 ef- forts, Figure 8 presents the same eighth-grade reading proficiency data, but the table also con- siders socio-economic status and student special programs like English language learners and spe- cial education. As discussed in previous editions of the Report Card on American Education, some states have much higher average family incomes than others. States also vary in rates of special pro- gram participation. While it is impossible to determine where fami- ly education success ends and school success be- gins, it is worth noting that many defenders of the status quo plead helplessness in the face of stu- dent poverty, while willingly giving the K-12 sys- tem full credit for the academic success of children from high-income families. For instance, research- ers sometimes compare middle- and high-income American students with entire national averages. A sober analysis of the international data would note that American students are often outscored by countries that spend a quarter of what the U.S. spends on public school education—a condition only made possible by the affluence of the Unit- ed States. Instead, status quo defenders implicitly postulate that Americans hold a global monopoly on student poverty.7 In order to minimize the role such factors play in determining academic outcomes and thus get a better understanding of the relative effectiveness of state efforts, Figure 8 provides NAEP eighth- grade reading proficiency rates for students quali- fying for a free or reduced-price lunch under feder- al guidelines and who do not participate in special programs such as English language learners or spe- cial education. Examining the scores of only low- income general-education children does not con- stitute a perfect control for student demographic characteristics; it is simply much better than ex- amining raw performance to determine the rela- tive effectiveness of state efforts. Previous editions of the Report Card have present- ed the case that racial and ethnic differences in academic achievement should be viewed as a cul- tural challenge. The essence of effective school- ing involves adult guidance of student culture to ensure learning occurs. While schools and states can narrow achievement gaps through schools with strong cultures (many examples exist), Figure 8 shows how much room states have to improve on this front. Even after taking economic and spe- cial-program differences into account, the ra- cial and ethnic profile of the top 10 ranking states looks strikingly different from that of the bottom 10 states. The most important point, however, is that all of thesenumbersarefartoolow.Ifthemosteffective public education system in the country (Massachu- setts) can only teach 37 percent of general-educa- tion low-income children to read proficiently, edu- cators and parents need to consider entirely new policies. Looking ahead to America’s approach- ing age demographic crisis, no state can afford to have 63 percent of low-income students off-track for college in eighth-grade. SENDING STUDENTS TO COLLEGE WITHOUT NECESSARY READING SKILLS Figure 9 compares the measured proficiency rates of a cohort of students on the NAEP reading exam in 2005 to the college attendance rate in the fall of 2010. In each state, the rate of college atten- dance greatly exceeds the rate of previously mea- sured reading proficiency. Thus, in California only 21 percent of the class of 2010 read as proficient- ly as eighth graders, but 79 percent of high school graduates attended college in the fall semester af- ter their scheduled spring graduation in May 2010. Again, these numbers should be viewed rough- ly rather than deterministically. This does not ar- gue that only 21 percent of the California class of 2010 ought to have been admitted into college, or that it is known which particular students ought to have been admitted from the California class. It can, however, be predicted that college is likely to go badly for students who were not reading profi- ciently in eighth grade.
  • 41. www.alec.org 33 APPROPRIATELY EQUIPPING OUR STUDENTS TODAY FOR A PROSPEROUS TOMORROW 22%   26%   23%   26%   21%   32%   34%   30%   12%   25%   25%   18%   32%   31%   28%   34%   35%   31%   20%   38%   30%   44%   28%   37%   18%   31%   37%   35%   22%   38%   38%   19%   33%   27%   37%   36%   25%   33%   36%   29%   25%   35%   26%   26%   29%   37%   36%   34%   22%   35%   36%   64%   46%   58%   65%   62%   61%   79%   47%   51%   63%   68%   64%   45%   59%   66%   67%   65%   63%   65%   56%   64%   73%   62%   71%   79%   61%   61%   70%   52%   64%   69%   72%   69%   64%   67%   61%   60%   48%   61%   65%   68%   72%   62%   56%   53%   54%   64%   48%   59%   60%   60%   Alabama   Alaska   Arizona   Arkansas   California   Colorado   Connec>cut   Delaware   District  of  Columbia   Florida   Georgia   Hawaii   Idaho   Illinois   Indiana   Iowa   Kansas   Kentucky   Louisiana   Maine   Maryland   MassachuseMs   Michigan   Minnesota   Mississippi   Missouri   Montana   Nebraska   Nevada   New  Hampshire   New  Jersey   New  Mexico   New  York   North  Carolina   North  Dakota   Ohio   Oklahoma   Oregon   Pennsylvania   Rhode  Island   South  Carolina   South  Dakota   Tennessee   Texas   Utah   Vermont   Virginia   Washington   West  Virginia   Wisconsin   Wyoming   FIGURE 9 | NAEP EIGHTH GRADE PROFICIENCY RATES AND THE FALL 2010 COLLEGE ATTENDANCE RATES FOR THE CLASS OF 2009 Source: National Center for Education Statistics
  • 42. 34 Report Card on American Education CHAPTER TWO DETAILED DATA FROM ARIZONA: WHAT HAPPENS WHEN UNPREPARED STUDENTS ATTEND COLLEGE The Arizona Board of Regents commissioned Ari- zona’s College Completion Report to specifically track the entire public school class of 2006 through the higher education system. The study provides a great deal of insight into the consequences of poor K-12 preparation for higher-education suc- cess.8 The study makes use of the National Clear- inghouse, which tracks student progress in public and private universities across the country. As indicated in Figure 9, the 2005 NAEP recorded that only 22 percent of the Arizona eighth-grade class of 2005 read proficiently, but that 58 per- cent of students were attending college in the fall of 2010. How does this play out as they move on to college? The Arizona Republic summarized the findings: Half of the state’s public high schools saw 5 per- cent or fewer of their graduates from 2006 earn bachelor’s degrees, a new study finds. And 62 percent of the college degrees earned by the high-school Class of 2006 went to students from just 40 of the state’s 460 high schools. The report out today from the Arizona Board of Regents is the first in the state to provide a snap- shot of college-completion rates for individual high schools. For six years, the regents tracked 53,392 Arizona students who graduated from high school in the 2005-06 school year, regard- less of whether they moved or attended college out of state. Using data from colleges nationwide, the report found that 57 percent of the Arizona students who graduated from high school in 2005-06 went on to college, but only 19 percent gradu- ated from a four-year institution within six years. An additional 6 percent graduated from a two- year college or trade school.9 The eighth-grade NAEP reading scores of the ear- ly years of the new millennium would lead one to believe that the upper threshold percentage for college preparedness was in the low 20s. Un- doubtedly some students fail to complete college because of algebra after getting through freshman composition. Life has many other pitfalls to snare college students as well. In Arizona, however, the college completion rate was eerily close to what NAEP eighth-grade reading scores suggested years before: the Class of 2006 had a 23 percent read- ing proficiency rate in 2002 when they were eighth graders, and 18.6 percent had finished a four-year degree six years after graduation from high school. Only one word can describe these results: cata- strophic. But this problem is not isolated to just one state. Arizona’s reading proficiency rates for eighth-grade students have plenty of company in the low 20 percent range. A tracking study similar to the one performed by the Arizona Board of Re- gents in any of these other low-performing states might reveal the same thing. The higher education system certainly bears some responsibility for this low graduation rate. Low en- try standards set the tone for K-12, and in so doing set up many Arizona students to fail. The univer- sities and colleges take money from unprepared kids and then proceed to flunk them out in droves. They might play a more productive role by setting some minimum standards related to college suc- cess and communicate those standards forcefully to the K-12 system. Ultimately, however, responsibility for this prob- lem primarily rests with the K-12 system. Higher education officials can—and often will—frame ad- mission issues as one of “access” and “opportuni- ty.” Access and opportunity are indeed incredibly important, but they are no substitute for proper academic preparation. There are a few bright spots, mostly found among schools of choice in the state (charter and mag- net), but on the whole, the 5 percent (or less) rate of college graduates from half of Arizona’s schools is unacceptable. Defenders of the system will be quick to claim that Arizona’s relatively low spend- ing per pupil is to blame, but this is factually untrue for two reasons. First, Arizona administrators cur- rently spend more than their predecessors from
  • 43. www.alec.org 35 APPROPRIATELY EQUIPPING OUR STUDENTS TODAY FOR A PROSPEROUS TOMORROW previous decades on a per-pupil basis after adjust- ing for inflation. While rankings of state spend- ing per pupil are a useful framing mechanism for those seeking increased funding, spending has in- creased substantially in all states. Multiple rankings over many years allow spending advocates to substitute as many as eight states at any given time as 49th in per-pupil spending. The truth is that all states spend far more than they did in the past. Arizona would not spend its way to high-quality schools, even if this was possible— and it may not be. Much better should be expect- ed from one of the most generously funded K-12 systems in the world. The Arizona Board of Regents’ analysis should be understood as a time capsule from the world of 2006. Many of the state’s high-quality charter school operators had few or no campuses gradu- ating seniors in 2006. The Regents’ report did not include private or home schools. NAEP shows that the aggregate eighth-grade proficiency rate im- proved from 22 percent in 2002 to 28 percent in 2013. It is hard to escape the sinking feeling, however, that this will prove too little, too late for the Grand Canyon State at its current rate of improvement. All states need to address their education policy now if they want to meet the challenges of the future. CONCLUSION: LIGHT AT THE END OF THE TUN- NEL OR ONCOMING TRAIN? Age demographics positioned the 1980s and 1990s for strong economic growth. The large baby boom population reached its prime earning years. High rates of economic growth also produced larg- er state tax revenues. Baby boom had turned to “baby bust,” lowering the percentage of the popu- lation in school and the associated costs. The large size of the baby boom generation relative to the number of retirees and children along with strong economic growth allowed increased spending on both the elderly and children. A similar pattern of baby boom followed by bust, with increased spending on both the young and the elderly, oc- curred not just in the United States, but to varying degrees throughout the developed world in the latter half of the 20th century.10 This process, however, has already reversed. The baby boom generation began qualifying for fed- eral retirement benefits in 2008. The age demo- graphic bounty of the late 20th century will force difficult choices in the coming years. A consider- able burden lies ahead for millennials as they si- multaneously attempt to finance their parents’ elderly entitlements and the education of their own children. More high school and college grad- uates and fewer high school and college dropouts among the youth of today would aid enormously in facing the considerable challenges of tomorrow. The concerns of American policymakers have con- tinued to grow at a much faster pace than schools have improved. Americans have faced even great- er challenges in the past—the twin defeats of glob- al fascism and communism come readily to mind. The primary task facing American policymakers is to secure a considerably higher return on each dol- lar invested in the delivery of vital public services, such as education and health care. Maintaining the status quo is not an option, whether one views it as benign or flawed. Public funding for K-12 education is guaranteed in every state constitution and strongly supported by the public. It is here to stay, but policymakers need to pursue far more robust reforms to get the edu- cation system to work for all students as soon as possible. Based on their reading scores, in 2013, all states had a majority of students off-track to fin- ish college. In 20 states, a quarter or fewer of their students were on-track for college success based on their reading scores alone. States universally have huge percentages of students attending in- stitutions of higher learning without the academic knowledge and skills necessary for success.
  • 44. 36 Report Card on American Education CHAPTER TWO ENDNOTES 1. National Center for Education Statistics. 2015. “Postsecondary Attainment: Differences by Socioeconomic Status.” Publication of the National Center for Education Statistics. May 2015. Available at http://nces.ed.gov/programs/coe/ indicator_tva.asp.National Center for Education Statistics. 2013. 2. “NAEP as an Indicator of Students’ Academic Preparedness for College.” Available at http://www.nationsreportcard. gov/reading_math_g12_2013/#/preparedness. 3. Available at http://www.census.gov/compendia/statab/2012/tables/12s0276.pdf. 4. Petrilli, Mike. 2015. “Want More College Graduates? Improve Our K-12 System.” Thomas B. Fordham Institute. Available at http://edexcellence.net/articles/want-more-college-graduates-improve-our-k%E2%80%9312-system. 5. The NAEP data explorer allows a user to get average scores for a jurisdiction and achievement percentages, but not the percentage above a particular cut score. The reading cut score however corresponds with that of “Proficient or Better.” 6. ACT, Inc. 2013. “The Condition of College & Career Readiness 2013 National.” Publication of the ACT Inc. Available at http://www.act.org/research/policymakers/cccr13/pdf/CCCR13-NationalReadinessRpt.pdf. 7. Ladner, Matthew and Dave Myslinski. 2013. “More Things in Heaven and Earth, Dr. Ravitch, than are Dreamt of in Your Ideology.” Foundation for Excellence in Education. September 2013. Available at http://excelined.org/2013/09/20/ things-heaven-earth-dr-ravitch-dreamt-ideology-ravitch-vs-reality-part-iii/#sthash.EsDquE4A.dpuf. 8. Arizona Board of Regents. 2013. “Arizona College Completion Report.” Arizona Board of Regents, available at https:// azregents.asu.edu/Documents/AZ%20HS%20Class%20of%202005-06%20Postsecondary%20Outcomes%20After%20 Six%20Years%2011-5-13.pdf. 9. Ryman, Ann. 2013. “State’s high schools show huge disparity in college grad rates.”The Arizona Republic. Nov. 13, 2013. Available at http://www.azcentral.com/news/arizona/articles/20131112arizona-high-schools-show-huge-disparity- college-grad-rates.html?nclick_check=1. 10. Isaac, Julia B. 2009. “A Comparative Perspective on Public Spending on Children.” Brookings Institution. November 2009. Available at http://www.brookings.edu/~/media/Research/Files/Reports/2009/11/05%20spending%20chil- dren%20isaacs/2_comparative_perspective_isaacs.PDF, page 15.
  • 45. 3CHAPTER Student Performance and State Education Policy Grades
  • 46. 38 Report Card on American Education Student Performance and State Education Policy Grades Building on the past year’s state educa- tion policy advances highlighted so far in this Report Card, state policies can now be viewed in context alongside each state’s stu- dent performance. The following state profiles underscore state ed- ucation policies with a focus on academic prog- ress. Keeping in mind that no two states started at the same place, the states were evaluated on their education systems based on absolute scores combined with academic growth. This pushes states with above-average education systems not to rest on their laurels, but rather to strive for even better results. At the same time, states that have historically struggled but are mak- ing remarkable gains receive due credit for their progress. Recognizing that this Report Card looks at a snap- shot in time of student performance, the trends seen over the past few years give insight into the direction of each state’s K-12 system and can guide policymakers as they seek to improve stu- dent outcomes in their states. RANKING STATES ON THE PERFORMANCE OF GENERAL EDUCATION LOW-INCOME STUDENTS Numerous studies reveal that children from wealthier families tend to score better in the classroom than those from low-income fami- lies. This occurs for a variety of reasons, including generally greater opportunities to learn more at home. Thus they enter the school system with a distinct advantage over their lower-income peers. Consequently, students from lower-income fam- ilies are more reliant upon the education system for a majority of their education. Like the previous four editions of the ALEC Report Card, this edition focuses the impact of education policy on disadvantaged students. The perfor- mance ranking portion, however, examines how well states are living up to the task of providing a high-quality education for all students. Each state has a unique student population. Wealth and income levels vary wildly by state, as does regional cost of living. States also have dif- fering numbers of students who qualify as English language learners or for an individualized educa- tion program. Therefore, the following rankings and grades are made as much of an “apples-to-ap- ples” comparison as possible by evaluating states based on similar students. In order to maximize comparability, the ranking system judges each state based on the NAEP performance of children eligible for free or reduced-priced lunches under the National School Lunch Program, which deter- mines eligibility by family income. The ranking system only looks at general education students who are not enrolled in either special education or English language learner programs. By tracking the absolute performance and prog- ress (or lack thereof) of general-education pro- gram students from families with low incomes, the vast differences among state K–12 popu- lations in relation to a relatively common met- ric are minimized. Comparing children from low- income households outside special programs across jurisdictions allows one to better assess the relative success and/or failure of particular public policies.
  • 47. www.alec.org 39 STUDENT PERFORMANCE AND STATE EDUCATION POLICY GRADES district schools, public charter schools, private schools, homeschools and digital learning provid- ers. These grades were partially based on mea- sures and grading systems from education or- ganizations and experts who analyzed various aspects of education reform. To develop each state’s overall policy grade, each policy category was first analyzed individually. For example, the Teacher Quality Policies catego- ry has four components that determine its over- all category grade, while Digital Learning has one component. The subcategories were averaged together to form category grades. Each state’s six category grades were then given equal weight and averaged together for the overall state poli- cy grade. POLICY CATEGORIES In this 20th Report Card, state education policy grades are composed of the following categories: Academic Standards, Charter Schools, Home- schooling, Private School Choice, Teacher Quali- ty and Digital Learning. These categories remain constant from the 19th Report Card, although in- dividual components of those categories have been updated as described below. ACADEMIC STANDARDS States’ academic standards lay the foundation for what content knowledge is expected of students as they progress through grade levels. Using data provided by Paul Peterson and Matthew Acker- man at EducationNext, this policy category exam- ines the proficiency bar set by states as they com- pare to those set by NAEP.1 States have generally been subjected to political pressure to set their proficiency bar low, giving the false illusion of ac- ademic proficiency and creating false advertising of their schools’ performances. In this policy cat- egory, Peterson and Kaplan’s examination of each state’s self-reported proficiency rates compared to NAEP proficiency results were instructive. CHARTER SCHOOLS Charter schools are innovative public schools that agree to meet performance standards set These comparisons are imperfect, as no per- fect comparisons exist. However, the compari- sons here are much more equitable than a simple comparison of state scores. To calculate the performance rankings in this Re- port Card, the scores of general-education low- income students on each state’s four main 2003 to 2013 NAEP exams (fourth- and eighth-grade reading and mathematics) were considered. This Report Card examines two components of those four exams: the actual scores on the 2013 NAEP; and the gains (or losses) made between 2003 and 2013. The 2013 scores are given equal weight with the gains made over the past decade. From these numbers, states earn their performance ranking. One caveat regarding NAEP exams: NAEP gives exams to random samples of students with mea- surable ranges of sampling error. Sampling errors are random in nature and thus the errors cancel themselves out. (For example, if a state’s NAEP 4th grade reading test is randomly a bit on the high end, it can be mitigated by another test be- ing on the low end.) Overall, readers should take greater note of whether their state falls on the high, middle or low end of the rankings, rather than fixating on an exact numerical ranking. GRADING EDUCATION POLICIES This Report Card is based on the presupposition that a high-quality education should be available to every child. Accordingly, as states make ad- vances in education policies, the grading meth- odology must take into account these advances. OVERALL EDUCATION POLICY GRADE The goal of these policy grades is to identify the policies that provide all students with education- al opportunities most appropriate for their indi- vidual needs. The education policy grading sys- tem evaluates state policies that place the focus on the needs of individual students. Policy areas include quality testing and accountability mech- anisms; improving teacher quality; and expand- ing parents’ abilities to choose the best learning environment for their children, including public
  • 48. 40 Report Card on American Education CHAPTER THREE by governing authorities but are otherwise free from most regulations governing traditional pub- lic schools. This autonomy allows for new teach- ing methods, special curricula and academic pro- grams, and flexible governance policies, such as holding longer school days. The charter school grades note whether a state has a charter school law and, if so, analyze how strong the law is in supporting the success of charter schools. The Center for Education Reform provides this infor- mation in their annual Charter School Law Rank- ing and Scorecard.2 HOMESCHOOLING REGULATION BURDEN LEVEL Two million students are home schooled each year. With an annual growth rate of approximately 5 percent, this is the fastest growing sector of school options. The homeschooling regulation burden level indicates the regulatory requirements par- ents face when homeschooling their children. The Home School Legal Defense Association rates the states’ homeschooling oversight in four catego- ries: “none,” “low,” “moderate” and “high.”3 PRIVATE SCHOOL CHOICE A growing body of empirical evidence suggests that private school policies that allow families to choose the best school for their children yield pos- itive outcomes, including improved family satisfac- tion, higher academic achievement and improved graduation rates. For these reasons, each state is evaluatedonwhetherithasaprivateschoolchoice program, such as vouchers or scholarships, tuition or scholarship tax credits or education savings ac- counts. Several factors determine grades, includ- ing statewide student eligibility for private school choice programs, the purchasing power these pro- grams provide for families and budget caps, which limit the availability of these programs for families. This analysis is based on a review of state school choice policies and is supported by research from the Friedman Foundation for Educational Choice.4 TEACHER QUALITY POLICIES Academic research shows that the greatest de- termining factor regarding a student’s academic success within a school is teacher effectiveness. Every student deserves the opportunity to learn from a great teacher. This category looks at states’ abilities to provide high-quality teachers in each classroom, ensuring students aren’t subjected to ineffective teachers. The National Council on Teacher Quality’s 2014 State Teacher Policy Year- book provides grades for how well states identi- fy high-quality teachers, retain effective teachers and remove ineffective ones.5 DIGITAL LEARNING A fast-changing state education policy is digital learning. These policy grades are derived from the Foundation for Excellence in Education’s 2014 Digital Learning Now initiative, which produc- es its annual Digital Learning Report Card. States are measured on their progress toward creating a statewide environment that supports high-quality digital learning options for all students.6 POLICY GRADE METHODOLOGY States’ education policy grades were calculated in the following manner. First, all analyses were con- vertedintolettergradeswherepossible.Forexam- ple, homeschooling regulation burden levels were converted as such: none = A, low = B, moderate = C and high = D. Next, all letter grades were convert- ed to a numerical score based on a grade point av- erage scale (A=4, B=3, C=2, D=1, F=0). Those scores were tallied and divided by the number of catego- ries in which a score was present. For some categories, grades were awarded with pluses and minuses, and numerical conver- sions were altered appropriately. A grade of B-, for example, was converted to a numeric score of 2.667, while a C+ was converted to 2.333.) ADDITIONAL INFORMATION In addition to the policy grades and performance rankings, each state profile contains additional in- formation, such as per-pupil spending levels and student populations. This data is purely for infor- mational purposes and is not included in the grad- ing or ranking of the states.7 8 9 10
  • 49. www.alec.org 41 STUDENT PERFORMANCE AND STATE EDUCATION POLICY GRADES Table 1 | LETTER GRADE KEY Grade Low Score High Score A 3.834 4.166 A- 3.5 3.833 B+ 3.167 3.499 B 2.834 3.166 B- 2.5 2.833 C+ 2.167 2.499 C 1.834 2.166 C- 1.5 1.833 D+ 1.167 1.499 D 0.834 1.166 D- 0.5 0.833 F 0.00 0.499 ENDNOTES 1. Peterson, Paul and Matthew Ackerman. “States Raise Proficiency Standards in Math and Reading: Commitments to Common Core may be Driving the Proficiency Bar Upward”. EducationNext. Summer 2015. Available at http://educa- tionnext.org/states-raise-proficiency-standards-math-reading/. 2. Consoletti, Alison Zgainer and Kara Kerwin “Charter School Laws across the States: 2015 Rankings and Scorecard.” Center for Education Reform. Available at https://www.edreform.com/2015/03/charter-school-laws-across-the-states- 2015-rankings-scorecard/. 3. Home School Legal Defense Association. “State Laws.” Available at http://www.hslda.org/laws/default.asp. 4. “School Choice by State.” Friedman Foundation for Educational Choice. Available at http://www.edchoice.org/school- choice/school-choice-in-america/. 5. “State Teacher Policy Yearbook.” National Council on Teacher Quality. Available at http://www.nctq.org/statePoli- cy/2014/statePolicyFindings.do?stateId=1. 6. “2014 Digital Learning Report Card.” Digital Learning Now. Available at http://www.digitallearningnow.com. 7. “Common Core of Data.” National Center for Education Statistics, Institute of Education Sciences. Available at http:// nces.ed.gov/ccd/tables/ACGR_2010-11_to_2012-13.asp. 8. “Public High School 4-year Adjusted Cohort Graduation Rate (ACGR) for the United States, the 50 states and the District of Columbia: School years 2010-11 to 2012-13.” (n.d.). Common Core of Data. National Center for Education Statistics Online. Available at http://nces.ed.gov/ccd/tables/ACGR_2010-11_to_2012-13.asp. 9. “Public Education Finances: 2013.” United States Census Bureau, U.S. Department of Commerce. Available at http:// www2.census.gov/govs/school/13f33pub.pdf. 10. “Elementary/Secondary Information System.” National Center for Education Statistics, Institute of Education Sciences. Available at http://nces.ed.gov/ccd/elsi/tableGenerator.aspx.
  • 50. 42 Report Card on American Education CHAPTER THREE
  • 51. www.alec.org 43 STATE SNAPSHOTS NAEP Scores for Low-Income General Education Students (2003-2013) NAEP Low-Income General Education Student Score Distribution (2013) 442013 NAEP Performance Rank ALEC Historical Ranking 2009 NAEP: 40th | 2011 NAEP: 34th Measures the overall scores for low-income general education students (non-ELL and non-IEP) and their gains/losses on the National Assessment of Educational Progress (NAEP) fourth- and eighth-grade reading and mathematics exams from 2003 to 2013. n States AL outperformed Education Policy Grade ALEC Historical Grading 2011: D+ | 2012: D+ | 2013: D+ Grades state-level education policies that provide high-quality educational options to all students. 0 25 50 75 100 At Proficient At Advanced At Basic Below Basic 4th-Grade Reading 8th-Grade Reading 4th-Grade Math 8th-Grade Math 3% 18% 38% 15% 48% 37% 18% 50% 31% 8% 42% 50%42% 0% 25% 50% 75% 100% 2% 1% 1% 0% 200 213 214 238 268 BASIC PROFICIENT ADVANCED 4th-Grade Reading 8th-Grade Reading 4th-Grade Math 8th-Grade Math 2003 2013 248 252 217 226 254 261 243 281 323 214 249 282 262 299 333 D State Academic Standards F Charter Schools Charter Schools Allowed No Charter School Law Grade — Homeschool Regulation Burden (A=None, B=Low, C=Moderate, D=High) B Private School Choice Programs C Teacher Quality and Policies: Overall Grade D Delivering Well Prepared Teachers B- Expanding the Teaching Pool C Identifying Effective Teachers D Retaining Effective Teachers D- Exiting Ineffective Teachers D Digital Learning D- The Cotton State Alabama Graduation Rate Average Class Size Annual Cost Per Student 71.8% 15.77 $9,874 Supplemental Information (The following is provided solely for informative reasons. It does not influence the above grade or ranking.) 14.6% 31.6% 53.8% Funding Sources Federal Funds State Funds Local Funds
  • 52. 44 Report Card on American Education 2014 STUDENT PERFORMANCE AND STATE EDUCATION POLICY GRADES INDEX The Last Frontier Alaska NAEP Scores for Low-Income General Education Students (2003-2013) NAEP Low-Income General Education Student Score Distribution (2013) 392013 NAEP Performance Rank ALEC Historical Ranking 2009 NAEP: 11th | 2011 NAEP: 32nd Measures the overall scores for low-income general education students (non-ELL and non-IEP) and their gains/losses on the National Assessment of Educational Progress (NAEP) fourth- and eighth-grade reading and mathematics exams from 2003 to 2013. n States AK outperformed Education Policy Grade ALECHistoricalGrading 2011:B-|2012:C-|2013:C- Grades state-level education policies that provide high-quality educational options to all students. 0 25 50 75 100 At Proficient At Advanced At Basic Below Basic 4th-Grade Reading 8th-Grade Reading 4th-Grade Math 8th-Grade Math 3% 19% 37% 24% 51% 24% 28% 50% 19% 24% 47% 25% 41% 0% 25% 50% 75% 100% 3% 1% 3% 3% 243 281 323 214 249 282 262 299 333 207 213214 238 268 BASIC PROFICIENT ADVANCED 4th-Grade Reading 8th-Grade Reading 4th-Grade Math 8th-Grade Math 2003 2013 252 262 229 236 273 282 D+ State Academic Standards D+ Charter Schools Charter Schools Allowed Yes Charter School Law Grade D Home School Regulation Burden (A=None, B=Low, C=Moderate, D=High) A Private School Choice Programs F Teacher Quality and Policies: Overall Grade D Delivering Well Prepared Teachers F Expanding the Teaching Pool D Identifying Effective Teachers D+ Retaining Effective Teachers D Exiting Ineffective Teachers D- Digital Learning D+ Graduation Rate Average Class Size Annual Cost Per Student 75.5% 16.29 $17,902 Supplemental Information (The following is provided solely for informative reasons. It does not influence the above grade or ranking.) 17.8%22.1% 60.1% Funding Sources Federal Funds State Funds Local Funds www.alec.org 44G
  • 53. www.alec.org 45 STATE SNAPSHOTS The Grand Canyon State Arizona NAEP Scores for Low-Income General Education Students (2003-2013) NAEP Low-Income General Education Student Score Distribution (2013) 472013 NAEP Performance Rank ALEC Historical Ranking 2009 NAEP: 45th | 2011 NAEP: 36th Measures the overall scores for low-income general education students (non-ELL and non-IEP) and their gains/losses on the National Assessment of Educational Progress (NAEP) fourth- and eighth-grade reading and mathematics exams from 2003 to 2013. n States AZ outperformed Education Policy Grade ALEC Historical Grading 2011: B | 2012: B+| 2013: B- Grades state-level education policies that provide high-quality educational options to all students. 0 25 50 75 100 At Proficient At Advanced At Basic Below Basic 4th-Grade Reading 8th-Grade Reading 4th-Grade Math 8th-Grade Math 3% 17% 37% 18% 50% 31% 28% 51% 18% 18% 43% 36%44% 0% 25% 50% 75% 100% 1% 1% 3% 2% 243 281 323 214 249 282 262 299 333 204 211214 238 268 BASIC PROFICIENT ADVANCED 4th-Grade Reading 8th-Grade Reading 4th-Grade Math 8th-Grade Math 2003 2013 252 256 225 236 266 273 B- State Academic Standards C Charter Schools Charter Schools Allowed Yes Charter School Law Grade A Homeschool Regulation Burden (A=None, B=Low, C=Moderate, D=High) B Private School Choice Programs A Teacher Quality and Policies: Overall Grade C- Delivering Well Prepared Teachers D Expanding the Teaching Pool C- Identifying Effective Teachers C Retaining Effective Teachers C Exiting Ineffective Teachers D+ Digital Learning C+ Graduation Rate Average Class Size Annual Cost Per Student 74.7% 20.75 $8,806 Supplemental Information (The following is provided solely for informative reasons. It does not influence the above grade or ranking.) 14.9% 48.4% 36.6% Funding Sources Federal Funds State Funds Local Funds
  • 54. 46 Report Card on American Education 2014 STUDENT PERFORMANCE AND STATE EDUCATION POLICY GRADES INDEX The Natural State Arkansas NAEP Scores for Low-Income General Education Students (2003-2013) NAEP Low-Income General Education Student Score Distribution (2013) 452013 NAEP Performance Rank ALEC Historical Ranking 2009 NAEP: 44th | 2011 NAEP: 45th Measures the overall scores for low-income general education students (non-ELL and non-IEP) and their gains/losses on the National Assessment of Educational Progress (NAEP) fourth- and eighth-grade reading and mathematics exams from 2003 to 2013. n States AR outperformed Education Policy Grade ALEC Historical Grading 2011: C | 2012: C | 2013: D+ Grades state-level education policies that provide high-quality educational options to all students. 0 25 50 75 100 At Proficient At Advanced At Basic Below Basic 4th-Grade Reading 8th-Grade Reading 4th-Grade Math 8th-Grade Math 3% 22% 39% 23% 48% 28% 29% 50% 18% 17% 45% 36%35% 0% 25% 50% 75% 100% 4% 1% 2% 2% 243 281 323 214 249 282 262 299 333 210 218 214 238 268 BASIC PROFICIENT ADVANCED 4th-Grade Reading 8th-Grade Reading 4th-Grade Math 8th-Grade Math 2003 2013 256 260 226 236 266 273 C State Academic Standards D Charter Schools Charter Schools Allowed Yes Charter School Law Grade D Homeschool Regulation Burden (A=None, B=Low, C=Moderate, D=High) C Private School Choice Programs B Teacher Quality and Policies: Overall Grade B- Delivering Well Prepared Teachers C+ Expanding the Teaching Pool B Identifying Effective Teachers C- Retaining Effective Teachers B- Exiting Ineffective Teachers C- Digital Learning C Graduation Rate Average Class Size Annual Cost Per Student 75.0% 12.9 $10,844 Supplemental Information (The following is provided solely for informative reasons. It does not influence the above grade or ranking.) 16.0% 12.2% 71.8% Funding Sources Federal Funds State Funds Local Funds
  • 55. www.alec.org 47 STATE SNAPSHOTS The Golden State California NAEP Scores for Low-Income General Education Students (2003-2013) NAEP Low-Income General Education Student Score Distribution (2013) 272013 NAEP Performance Rank ALEC Historical Ranking 2009 NAEP: 30th | 2011 NAEP: 30th Measures the overall scores for low-income general education students (non-ELL and non-IEP) and their gains/losses on the National Assessment of Educational Progress (NAEP) fourth- and eighth-grade reading and mathematics exams from 2003 to 2013. n States CA outperformed Education Policy Grade ALEC Historical Grading 2011: B | 2012: C+| 2013: C Grades state-level education policies that provide high-quality educational options to all students. 0 25 50 75 100 At Proficient At Advanced At Basic Below Basic 4th-Grade Reading 8th-Grade Reading 4th-Grade Math 8th-Grade Math 3% 19% 38% 21% 54% 25% 25% 49% 22% 17% 45% 35%40% 0% 25% 50% 75% 100% 3% 1% 3% 2% 243 281 323 214 249 282 262 299 333 201 215 214 238 268 BASIC PROFICIENT ADVANCED 4th-Grade Reading 8th-Grade Reading 4th-Grade Math 8th-Grade Math 2003 2013 252 261 224 234 262 273 C- State Academic Standards C+ Charter Schools Charter Schools Allowed Yes Charter School Law Grade B Homeschool Regulation Burden (A=None, B=Low, C=Moderate, D=High) B Private School Choice Programs F Teacher Quality and Policies: Overall Grade D+ Delivering Well Prepared Teachers D+ Expanding the Teaching Pool C- Identifying Effective Teachers D- Retaining Effective Teachers C+ Exiting Ineffective Teachers F Digital Learning D- Graduation Rate Average Class Size Annual Cost Per Student 78.2% 19.8 $10,581 Supplemental Information (The following is provided solely for informative reasons. It does not influence the above grade or ranking.) 14.6% 30.4% 55.0% Funding Sources Federal Funds State Funds Local Funds
  • 56. 48 Report Card on American Education 2014 STUDENT PERFORMANCE AND STATE EDUCATION POLICY GRADES INDEX The Centennial State Colorado NAEP Scores for Low-Income General Education Students (2003-2013) NAEP Low-Income General Education Student Score Distribution (2013) 52013 NAEP Performance Rank ALEC Historical Ranking 2009 NAEP: 17th | 2011 NAEP: 4th Measures the overall scores for low-income general education students (non-ELL and non-IEP) and their gains/losses on the National Assessment of Educational Progress (NAEP) fourth- and eighth-grade reading and mathematics exams from 2003 to 2013. n States CO outperformed Education Policy Grade ALEC Historical Grading 2011: B | 2012: C+| 2013: C+ Grades state-level education policies that provide high-quality educational options to all students. 0 25 50 75 100 At Proficient At Advanced At Basic Below Basic 4th-Grade Reading 8th-Grade Reading 4th-Grade Math 8th-Grade Math 3% 25% 43% 27% 51% 20% 35% 47% 12% 25% 43% 27%27% 0% 25% 50% 75% 100% 5% 2% 5% 5% 243 281 323 214 249 282 262 299 333 216 223 214 238 268 BASIC PROFICIENT ADVANCED 4th-Grade Reading 8th-Grade Reading 4th-Grade Math 8th-Grade Math 2003 2013 257 266 227 243 269 282 C State Academic Standards B Charter Schools Charter Schools Allowed Yes Charter School Law Grade B Homeschool Regulation Burden (A=None, B=Low, C=Moderate, D=High) C Private School Choice Programs F Teacher Quality and Policies: Overall Grade C+ Delivering Well Prepared Teachers D- Expanding the Teaching Pool D+ Identifying Effective Teachers B- Retaining Effective Teachers C Exiting Ineffective Teachers A Digital Learning D+ Graduation Rate Average Class Size Annual Cost Per Student 79.8% 16.97 $10,421 Supplemental Information (The following is provided solely for informative reasons. It does not influence the above grade or ranking.) 11.1% 48.7% 40.2% Funding Sources Federal Funds State Funds Local Funds
  • 57. www.alec.org 49 STATE SNAPSHOTS The Constitution State Connecticut NAEP Scores for Low-Income General Education Students (2003-2013) NAEP Low-Income General Education Student Score Distribution (2013) 372013 NAEP Performance Rank ALEC Historical Ranking 2009 NAEP: 29th | 2011 NAEP: 39th Measures the overall scores for low-income general education students (non-ELL and non-IEP) and their gains/losses on the National Assessment of Educational Progress (NAEP) fourth- and eighth-grade reading and mathematics exams from 2003 to 2013. n States CT outperformed Education Policy Grade ALEC Historical Grading 2011: C+ | 2012: C-| 2013: C- Grades state-level education policies that provide high-quality educational options to all students. 0 25 50 75 100 At Proficient At Advanced At Basic Below Basic 4th-Grade Reading 8th-Grade Reading 4th-Grade Math 8th-Grade Math 3% 20% 43% 27% 50% 21% 23% 49% 27% 17% 43% 37%34% 0% 25% 50% 75% 100% 3% 2% 2% 3% 243 281 323 214 249 282 262 299 333 211 218 214 238 268 BASIC PROFICIENT ADVANCED 4th-Grade Reading 8th-Grade Reading 4th-Grade Math 8th-Grade Math 2003 2013 252 265 223 230 267 273 C- State Academic Standards C- Charter Schools Charter Schools Allowed Yes Charter School Law Grade D Homeschool Regulation Burden (A=None, B=Low, C=Moderate, D=High) A Private School Choice Programs F Teacher Quality and Policies: Overall Grade B- Delivering Well Prepared Teachers B- Expanding the Teaching Pool C+ Identifying Effective Teachers B Retaining Effective Teachers C Exiting Ineffective Teachers C- Digital Learning F Graduation Rate Average Class Size Annual Cost Per Student 75.1% 12.94 $18,061 Supplemental Information (The following is provided solely for informative reasons. It does not influence the above grade or ranking.) 8.3% 58.6% 33.1% Funding Sources Federal Funds State Funds Local Funds
  • 58. 50 Report Card on American Education 2014 STUDENT PERFORMANCE AND STATE EDUCATION POLICY GRADES INDEX The First State Delaware NAEP Scores for Low-Income General Education Students (2003-2013) NAEP Low-Income General Education Student Score Distribution (2013) 282013 NAEP Performance Rank ALEC Historical Ranking 2009 NAEP: 19th | 2011 NAEP: 22nd Measures the overall scores for low-income general education students (non-ELL and non-IEP) and their gains/losses on the National Assessment of Educational Progress (NAEP) fourth- and eighth-grade reading and mathematics exams from 2003 to 2013. n States DE outperformed Education Policy Grade ALEC Historical Grading 2011: C+ | 2012: C| 2013: C Grades state-level education policies that provide high-quality educational options to all students. 0 25 50 75 100 At Proficient At Advanced At Basic Below Basic 4th-Grade Reading 8th-Grade Reading 4th-Grade Math 8th-Grade Math 3% 24% 41% 22% 52% 25% 29% 54% 14% 19% 47% 32%30% 0% 25% 50% 75% 100% 5% 1% 3% 2% 243 281 323 214 249 282 262 299 333 214 222 214 238 268 BASIC PROFICIENT ADVANCED 4th-Grade Reading 8th-Grade Reading 4th-Grade Math 8th-Grade Math 2003 2013 256 261 228 238 267 276 C- State Academic Standards C Charter Schools Charter Schools Allowed Yes Charter School Law Grade C Homeschool Regulation Burden (A=None, B=Low, C=Moderate, D=High) B Private School Choice Programs F Teacher Quality and Policies: Overall Grade C+ Delivering Well Prepared Teachers B- Expanding the Teaching Pool C+ Identifying Effective Teachers B Retaining Effective Teachers C Exiting Ineffective Teachers D Digital Learning D- Graduation Rate Average Class Size Annual Cost Per Student 75.5% 14.68 $14,280 Supplemental Information (The following is provided solely for informative reasons. It does not influence the above grade or ranking.) 11.2% 29.8% 59.0% Funding Sources Federal Funds State Funds Local Funds
  • 59. www.alec.org 51 STATE SNAPSHOTS The Federal City District of Columbia NAEP Scores for Low-Income General Education Students (2003-2013) NAEP Low-Income General Education Student Score Distribution (2013) 222013 NAEP Performance Rank ALEC Historical Ranking 2009 NAEP: 26th | 2011 NAEP: 24th Measures the overall scores for low-income general education students (non-ELL and non-IEP) and their gains/losses on the National Assessment of Educational Progress (NAEP) fourth- and eighth-grade reading and mathematics exams from 2003 to 2013. n States D.C. outperformed Education Policy Grade ALEC Historical Grading 2011: B | 2012: B-| 2013: B- Grades state-level education policies that provide high-quality educational options to all students. 0 25 50 75 100 At Proficient At Advanced At Basic Below Basic 4th-Grade Reading 8th-Grade Reading 4th-Grade Math 8th-Grade Math 3% 13% 32% 13% 47% 40% 19% 46% 34% 14% 42% 43%53% 0% 25% 50% 75% 100% 2% 1% 2% 243 281 323 214 249 282 262 299 333 186 204214 238 268 BASIC PROFICIENT ADVANCED 4th-Grade Reading 8th-Grade Reading 4th-Grade Math 8th-Grade Math 2003 2013 236 250 203 225 241 267 C- State Academic Standards C Charter Schools Charter Schools Allowed Yes Charter School Law Grade A Homeschool Regulation Burden (A=None, B=Low, C=Moderate, D=High) C Private School Choice Programs D Teacher Quality and Policies: Overall Grade D+ Delivering Well Prepared Teachers C- Expanding the Teaching Pool C Identifying Effective Teachers D Retaining Effective Teachers F Exiting Ineffective Teachers D Digital Learning – Graduation Rate Average Class Size Annual Cost Per Student 59.9% 11.86 $29,029 Supplemental Information (The following is provided solely for informative reasons. It does not influence the above grade or ranking.) 12.1% 87.9% Funding Sources Federal Funds State Funds (N/A) Local Funds
  • 60. 52 Report Card on American Education 2014 STUDENT PERFORMANCE AND STATE EDUCATION POLICY GRADES INDEX The Sunshine State Florida NAEP Scores for Low-Income General Education Students (2003-2013) NAEP Low-Income General Education Student Score Distribution (2013) 102013 NAEP Performance Rank ALEC Historical Ranking 2009 NAEP: 3rd | 2011 NAEP: 12th Measures the overall scores for low-income general education students (non-ELL and non-IEP) and their gains/losses on the National Assessment of Educational Progress (NAEP) fourth- and eighth-grade reading and mathematics exams from 2003 to 2013. n States FL outperformed Education Policy Grade ALEC Historical Grading 2011: B+ | 2012: B | 2013: B Grades state-level education policies that provide high-quality educational options to all students. 0 25 50 75 100 At Proficient At Advanced At Basic Below Basic 4th-Grade Reading 8th-Grade Reading 4th-Grade Math 8th-Grade Math 3% 27% 43% 25% 51% 23% 30% 52% 15% 20% 44% 32%24% 0% 25% 50% 75% 100% 5% 1% 3% 3% 243 281 323 214 249 282 262 299 333 213 226 214 238 268 BASIC PROFICIENT ADVANCED 4th-Grade Reading 8th-Grade Reading 4th-Grade Math 8th-Grade Math 2003 2013 254 263 228 239 265 277 B State Academic Standards B Charter Schools Charter Schools Allowed Yes Charter School Law Grade B Homeschool Regulation Burden (A=None, B=Low, C=Moderate, D=High) C Private School Choice Programs A Teacher Quality and Policies: Overall Grade B+ Delivering Well Prepared Teachers B+ Expanding the Teaching Pool B Identifying Effective Teachers B+ Retaining Effective Teachers B+ Exiting Ineffective Teachers B- Digital Learning A- Graduation Rate Average Class Size Annual Cost Per Student 70.8% 14.33 $10,031 Supplemental Information (The following is provided solely for informative reasons. It does not influence the above grade or ranking.) 17.8% 47.9% 34.3% Funding Sources Federal Funds State Funds Local Funds
  • 61. www.alec.org 53 STATE SNAPSHOTS The Peach State Georgia NAEP Scores for Low-Income General Education Students (2003-2013) NAEP Low-Income General Education Student Score Distribution (2013) 232013 NAEP Performance Rank ALEC Historical Ranking 2009 NAEP: 27th | 2011 NAEP: 27th Measures the overall scores for low-income general education students (non-ELL and non-IEP) and their gains/losses on the National Assessment of Educational Progress (NAEP) fourth- and eighth-grade reading and mathematics exams from 2003 to 2013. n States GA outperformed Education Policy Grade ALEC Historical Grading 2011: B | 2012: B- | 2013: C+ Grades state-level education policies that provide high-quality educational options to all students. 0 25 50 75 100 At Proficient At Advanced At Basic Below Basic 4th-Grade Reading 8th-Grade Reading 4th-Grade Math 8th-Grade Math 3% 20% 36% 21% 50% 28% 25% 50% 22% 17% 43% 37%40% 0% 25% 50% 75% 100% 4% 1% 3% 2% 243 281 323 214 249 282 262 299 333 204 215 214 238 268 BASIC PROFICIENT ADVANCED 4th-Grade Reading 8th-Grade Reading 4th-Grade Math 8th-Grade Math 2003 2013 249 259 222 234 257 272 C+ State Academic Standards F Charter Schools Charter Schools Allowed Yes Charter School Law Grade C Homeschool Regulation Burden (A=None, B=Low, C=Moderate, D=High) B Private School Choice Programs B Teacher Quality and Policies: Overall Grade B- Delivering Well Prepared Teachers C+ Expanding the Teaching Pool B Identifying Effective Teachers C+ Retaining Effective Teachers C Exiting Ineffective Teachers B+ Digital Learning B Graduation Rate Average Class Size Annual Cost Per Student 69.9% 14.39 $10,821 Supplemental Information (The following is provided solely for informative reasons. It does not influence the above grade or ranking.) 12.6% 45.9% 41.6% Funding Sources Federal Funds State Funds Local Funds
  • 62. 54 Report Card on American Education 2014 STUDENT PERFORMANCE AND STATE EDUCATION POLICY GRADES INDEX The Aloha State Hawaii NAEP Scores for Low-Income General Education Students (2003-2013) NAEP Low-Income General Education Student Score Distribution (2013) 62013 NAEP Performance Rank ALEC Historical Ranking 2009 NAEP: 15th | 2011 NAEP: 13th Measures the overall scores for low-income general education students (non-ELL and non-IEP) and their gains/losses on the National Assessment of Educational Progress (NAEP) fourth- and eighth-grade reading and mathematics exams from 2003 to 2013. n States HI outperformed Education Policy Grade ALEC Historical Grading 2011: C+ | 2012: C-| 2013: C- Grades state-level education policies that provide high-quality educational options to all students. 0 25 50 75 100 At Proficient At Advanced At Basic Below Basic 4th-Grade Reading 8th-Grade Reading 4th-Grade Math 8th-Grade Math 3% 18% 36% 25% 51% 23% 35% 45% 14% 26% 46% 24% 42% 0% 25% 50% 75% 100% 3% 1% 5% 5% 243 281 323 214 249 282 262 299 333 206 213214 238 268 BASIC PROFICIENT ADVANCED 4th-Grade Reading 8th-Grade Reading 4th-Grade Math 8th-Grade Math 2003 2013 251 263 222 242 263 284 D+ State Academic Standards C Charter Schools Charter Schools Allowed Yes Charter School Law Grade C Homeschool Regulation Burden (A=None, B=Low, C=Moderate, D=High) C Private School Choice Programs F Teacher Quality and Policies: Overall Grade D+ Delivering Well Prepared Teachers D- Expanding the Teaching Pool F Identifying Effective Teachers B Retaining Effective Teachers C+ Exiting Ineffective Teachers D Digital Learning D Graduation Rate Average Class Size Annual Cost Per Student 75.4% 15.71 $13,917 Supplemental Information (The following is provided solely for informative reasons. It does not influence the above grade or ranking.) 13.9% 2.5% 83.6% Funding Sources Federal Funds State Funds Local Funds
  • 63. www.alec.org 55 STATE SNAPSHOTS The Gem State Idaho NAEP Scores for Low-Income General Education Students (2003-2013) NAEP Low-Income General Education Student Score Distribution (2013) 332013 NAEP Performance Rank ALEC Historical Ranking 2009 NAEP: 22nd | 2011 NAEP: 29th Measures the overall scores for low-income general education students (non-ELL and non-IEP) and their gains/losses on the National Assessment of Educational Progress (NAEP) fourth- and eighth-grade reading and mathematics exams from 2003 to 2013. n States ID outperformed Education Policy Grade ALEC Historical Grading 2011: B- | 2012: B-| 2013: C Grades state-level education policies that provide high-quality educational options to all students. 0 25 50 75 100 At Proficient At Advanced At Basic Below Basic 4th-Grade Reading 8th-Grade Reading 4th-Grade Math 8th-Grade Math 3% 22% 39% 29% 52% 17% 30% 51% 16% 24% 48% 23%35% 0% 25% 50% 75% 100% 4% 2% 4% 4% 243 281 323 214 249 282 262 299 333 217 219 214 238 268 BASIC PROFICIENT ADVANCED 4th-Grade Reading 8th-Grade Reading 4th-Grade Math 8th-Grade Math 2003 2013 263 268 233 238 277 283 C State Academic Standards D Charter Schools Charter Schools Allowed Yes Charter School Law Grade B Homeschool Regulation Burden (A=None, B=Low, C=Moderate, D=High) A Private School Choice Programs F Teacher Quality and Policies: Overall Grade D+ Delivering Well Prepared Teachers D+ Expanding the Teaching Pool D Identifying Effective Teachers C- Retaining Effective Teachers D- Exiting Ineffective Teachers D Digital Learning C Graduation Rate Average Class Size Annual Cost Per Student 84.0% 18.18 $7,863 Supplemental Information (The following is provided solely for informative reasons. It does not influence the above grade or ranking.) 14.0% 22.8% 63.2% Funding Sources Federal Funds State Funds Local Funds
  • 64. 56 Report Card on American Education 2014 STUDENT PERFORMANCE AND STATE EDUCATION POLICY GRADES INDEX The Prairie State Illinois NAEP Scores for Low-Income General Education Students (2003-2013) NAEP Low-Income General Education Student Score Distribution (2013) 302013 NAEP Performance Rank ALEC Historical Ranking 2009 NAEP: 38th | 2011 NAEP: 28th Measures the overall scores for low-income general education students (non-ELL and non-IEP) and their gains/losses on the National Assessment of Educational Progress (NAEP) fourth- and eighth-grade reading and mathematics exams from 2003 to 2013. n States IL outperformed Education Policy Grade ALEC Historical Grading 2011: C+ | 2012: C | 2013: C Grades state-level education policies that provide high-quality educational options to all students. 0 25 50 75 100 At Proficient At Advanced At Basic Below Basic 4th-Grade Reading 8th-Grade Reading 4th-Grade Math 8th-Grade Math 3% 18% 38% 23% 51% 25% 24% 50% 23% 20% 45% 32%42% 0% 25% 50% 75% 100% 2% 1% 3% 3% 243 281 323 214 249 282 262 299 333 206 213 214 238 268 BASIC PROFICIENT ADVANCED 4th-Grade Reading 8th-Grade Reading 4th-Grade Math 8th-Grade Math 2003 2013 254 261 221 233 264 276 C+ State Academic Standards B- Charter Schools Charter Schools Allowed Yes Charter School Law Grade C Homeschool Regulation Burden (A=None, B=Low, C=Moderate, D=High) A Private School Choice Programs C Teacher Quality and Policies: Overall Grade C+ Delivering Well Prepared Teachers D+ Expanding the Teaching Pool C- Identifying Effective Teachers C+ Retaining Effective Teachers C- Exiting Ineffective Teachers A Digital Learning D- Graduation Rate Average Class Size Annual Cost Per Student 81.9% 15.19 $13,848 Supplemental Information (The following is provided solely for informative reasons. It does not influence the above grade or ranking.) 10.1% 55.0% 35.0% Funding Sources Federal Funds State Funds Local Funds
  • 65. www.alec.org 57 STATE SNAPSHOTS The Hoosier State Indiana NAEP Scores for Low-Income General Education Students (2003-2013) NAEP Low-Income General Education Student Score Distribution (2013) 42013 NAEP Performance Rank ALEC Historical Ranking 2009 NAEP: 13th | 2011 NAEP: 17th Measures the overall scores for low-income general education students (non-ELL and non-IEP) and their gains/losses on the National Assessment of Educational Progress (NAEP) fourth- and eighth-grade reading and mathematics exams from 2003 to 2013. n States IN outperformed Education Policy Grade ALEC Historical Grading 2011: B | 2012: B+| 2013: B+ Grades state-level education policies that provide high-quality educational options to all students. 0 25 50 75 100 At Proficient At Advanced At Basic Below Basic 4th-Grade Reading 8th-Grade Reading 4th-Grade Math 8th-Grade Math 3% 27% 43% 26% 51% 22% 39% 47% 9% 23% 47% 25%26% 0% 25% 50% 75% 100% 5% 1% 5% 4% 243 281 323 214 249 282 262 299 333 210 225 214 238 268 BASIC PROFICIENT ADVANCED 4th-Grade Reading 8th-Grade Reading 4th-Grade Math 8th-Grade Math 2003 2013 256 264 228 245 273 282 B+ State Academic Standards C- Charter Schools Charter Schools Allowed Yes Charter School Law Grade A Homeschool Regulation Burden (A=None, B=Low, C=Moderate, D=High) A Private School Choice Programs A Teacher Quality and Policies: Overall Grade B- Delivering Well Prepared Teachers B+ Expanding the Teaching Pool C- Identifying Effective Teachers C Retaining Effective Teachers C- Exiting Ineffective Teachers B Digital Learning B- Graduation Rate Average Class Size Annual Cost Per Student 77.2% 16.81 $11,583 Supplemental Information (The following is provided solely for informative reasons. It does not influence the above grade or ranking.) 8.6% 29.4% 61.9% Funding Sources Federal Funds State Funds Local Funds
  • 66. 58 Report Card on American Education 2014 STUDENT PERFORMANCE AND STATE EDUCATION POLICY GRADES INDEX The Hawkeye State Iowa NAEP Scores for Low-Income General Education Students (2003-2013) NAEP Low-Income General Education Student Score Distribution (2013) 312013 NAEP Performance Rank ALEC Historical Ranking 2009 NAEP: 31st | 2011 NAEP: 31st Measures the overall scores for low-income general education students (non-ELL and non-IEP) and their gains/losses on the National Assessment of Educational Progress (NAEP) fourth- and eighth-grade reading and mathematics exams from 2003 to 2013. n States IA outperformed Education Policy Grade ALEC Historical Grading 2011: C- | 2012: C| 2013: C- Grades state-level education policies that provide high-quality educational options to all students. 0 25 50 75 100 At Proficient At Advanced At Basic Below Basic 4th-Grade Reading 8th-Grade Reading 4th-Grade Math 8th-Grade Math 3% 26% 38% 27% 56% 17% 33% 49% 16% 21% 49% 27%31% 0% 25% 50% 75% 100% 5% 1% 3% 3% 243 281 323 214 249 282 262 299 333 215 222 214 238 268 BASIC PROFICIENT ADVANCED 4th-Grade Reading 8th-Grade Reading 4th-Grade Math 8th-Grade Math 2003 2013 261 266 234 239 276 279 C- State Academic Standards C Charter Schools Charter Schools Allowed Yes Charter School Law Grade D Homeschool Regulation Burden (A=None, B=Low, C=Moderate, D=High) A Private School Choice Programs C Teacher Quality and Policies: Overall Grade D Delivering Well Prepared Teachers D+ Expanding the Teaching Pool D+ Identifying Effective Teachers D- Retaining Effective Teachers D Exiting Ineffective Teachers D Digital Learning D Graduation Rate Average Class Size Annual Cost Per Student 87.9% 13.72 $11,909 Supplemental Information (The following is provided solely for informative reasons. It does not influence the above grade or ranking.) 10.2% 46.7% 43.2% Funding Sources Federal Funds State Funds Local Funds
  • 67. www.alec.org 59 STATE SNAPSHOTS The Sunflower State Kansas NAEP Scores for Low-Income General Education Students (2003-2013) NAEP Low-Income General Education Student Score Distribution (2013) 202013 NAEP Performance Rank ALEC Historical Ranking 2009 NAEP: 7th | 2011 NAEP: 8th Measures the overall scores for low-income general education students (non-ELL and non-IEP) and their gains/losses on the National Assessment of Educational Progress (NAEP) fourth- and eighth-grade reading and mathematics exams from 2003 to 2013. n States KS outperformed Education Policy Grade ALEC Historical Grading 2011: C- | 2012: C-| 2013: D+ Grades state-level education policies that provide high-quality educational options to all students. 0 25 50 75 100 At Proficient At Advanced At Basic Below Basic 4th-Grade Reading 8th-Grade Reading 4th-Grade Math 8th-Grade Math 3% 25% 41% 26% 50% 23% 36% 50% 10% 26% 47% 22%30% 0% 25% 50% 75% 100% 4% 1% 3% 5% 243 281 323 214 249 282 262 299 333 212 221 214 238 268 BASIC PROFICIENT ADVANCED 4th-Grade Reading 8th-Grade Reading 4th-Grade Math 8th-Grade Math 2003 2013 260 263 234 243 277 285 C- State Academic Standards D+ Charter Schools Charter Schools Allowed Yes Charter School Law Grade F Homeschool Regulation Burden (A=None, B=Low, C=Moderate, D=High) B Private School Choice Programs D Teacher Quality and Policies: Overall Grade D Delivering Well Prepared Teachers D+ Expanding the Teaching Pool D- Identifying Effective Teachers D+ Retaining Effective Teachers D Exiting Ineffective Teachers F Digital Learning B- Graduation Rate Average Class Size Annual Cost Per Student 84.5% 13.67 $11,472 Supplemental Information (The following is provided solely for informative reasons. It does not influence the above grade or ranking.) 11.1% 35.8% 53.2% Funding Sources Federal Funds State Funds Local Funds
  • 68. 60 Report Card on American Education 2014 STUDENT PERFORMANCE AND STATE EDUCATION POLICY GRADES INDEX The Bluegrass State Kentucky NAEP Scores for Low-Income General Education Students (2003-2013) NAEP Low-Income General Education Student Score Distribution (2013) 422013 NAEP Performance Rank ALEC Historical Ranking 2009 NAEP: 37th | 2011 NAEP: 37th Measures the overall scores for low-income general education students (non-ELL and non-IEP) and their gains/losses on the National Assessment of Educational Progress (NAEP) fourth- and eighth-grade reading and mathematics exams from 2003 to 2013. n States KY outperformed Education Policy Grade ALEC Historical Grading 2011: C | 2012: D+| 2013: C- Grades state-level education policies that provide high-quality educational options to all students. 0 25 50 75 100 At Proficient At Advanced At Basic Below Basic 4th-Grade Reading 8th-Grade Reading 4th-Grade Math 8th-Grade Math 3% 23% 39% 26% 48% 25% 29% 51% 18% 16% 46% 35%34% 0% 25% 50% 75% 100% 4% 2% 3% 2% 243 281 323 214 249 282 262 299 333 212 219 214 238 268 BASIC PROFICIENT ADVANCED 4th-Grade Reading 8th-Grade Reading 4th-Grade Math 8th-Grade Math 2003 2013 260 263 224 236 267 273 C- State Academic Standards A Charter Schools Charter Schools Allowed No Charter School Law Grade – Homeschool Regulation Burden (A=None, B=Low, C=Moderate, D=High) B Private School Choice Programs F Teacher Quality and Policies: Overall Grade C Delivering Well Prepared Teachers B- Expanding the Teaching Pool C Identifying Effective Teachers C- Retaining Effective Teachers C Exiting Ineffective Teachers D Digital Learning D- Graduation Rate Average Class Size Annual Cost Per Student 79.9% 16.2 $10,555 Supplemental Information (The following is provided solely for informative reasons. It does not influence the above grade or ranking.) 16.4%31.5% 52.1% Funding Sources Federal Funds State Funds Local Funds
  • 69. www.alec.org 61 STATE SNAPSHOTS The Pelican State Louisiana NAEP Scores for Low-Income General Education Students (2003-2013) NAEP Low-Income General Education Student Score Distribution (2013) 482013 NAEP Performance Rank ALEC Historical Ranking 2009 NAEP: 47th | 2011 NAEP: 49th Measures the overall scores for low-income general education students (non-ELL and non-IEP) and their gains/losses on the National Assessment of Educational Progress (NAEP) fourth- and eighth-grade reading and mathematics exams from 2003 to 2013. n States LA outperformed Education Policy Grade ALEC Historical Grading 2011: B- | 2012: B| 2013: B- Grades state-level education policies that provide high-quality educational options to all students. 0 25 50 75 100 At Proficient At Advanced At Basic Below Basic 4th-Grade Reading 8th-Grade Reading 4th-Grade Math 8th-Grade Math 3% 17% 37% 18% 49% 32% 21% 53% 25% 14% 45% 39%44% 0% 25% 50% 75% 100% 2% 1% 1% 2% 243 281 323 214 249 282 262 299 333 202 212214 238 268 BASIC PROFICIENT ADVANCED 4th-Grade Reading 8th-Grade Reading 4th-Grade Math 8th-Grade Math 2003 2013 249 256 224 231 261 271 C+ State Academic Standards D Charter Schools Charter Schools Allowed Yes Charter School Law Grade C Homeschool Regulation Burden (A=None, B=Low, C=Moderate, D=High) C Private School Choice Programs A Teacher Quality and Policies: Overall Grade B Delivering Well Prepared Teachers C Expanding the Teaching Pool C+ Identifying Effective Teachers A- Retaining Effective Teachers B+ Exiting Ineffective Teachers C Digital Learning B- Graduation Rate Average Class Size Annual Cost Per Student 68.8% 13.92 $12,054 Supplemental Information (The following is provided solely for informative reasons. It does not influence the above grade or ranking.) 18.7% 40.5% 40.8% Funding Sources Federal Funds State Funds Local Funds
  • 70. 62 Report Card on American Education 2014 STUDENT PERFORMANCE AND STATE EDUCATION POLICY GRADES INDEX The Pine Tree State Maine NAEP Scores for Low-Income General Education Students (2003-2013) NAEP Low-Income General Education Student Score Distribution (2013) 142013 NAEP Performance Rank ALEC Historical Ranking 2009 NAEP: 14th | 2011 NAEP: 14th Measures the overall scores for low-income general education students (non-ELL and non-IEP) and their gains/losses on the National Assessment of Educational Progress (NAEP) fourth- and eighth-grade reading and mathematics exams from 2003 to 2013. n States ME outperformed Education Policy Grade ALEC Historical Grading 2011: C- | 2012: C-| 2013: C Grades state-level education policies that provide high-quality educational options to all students. 0 25 50 75 100 At Proficient At Advanced At Basic Below Basic 4th-Grade Reading 8th-Grade Reading 4th-Grade Math 8th-Grade Math 3% 26% 42% 31% 47% 19% 36% 51% 9% 26% 48% 21%27% 0% 25% 50% 75% 100% 5% 2% 4% 5% 243 281 323 214 249 282 262 299 333 219 225 214 238 268 BASIC PROFICIENT ADVANCED 4th-Grade Reading 8th-Grade Reading 4th-Grade Math 8th-Grade Math 2003 2013 264 268 233 243 274 284 C State Academic Standards C+ Charter Schools Charter Schools Allowed Yes Charter School Law Grade C Homeschool Regulation Burden (A=None, B=Low, C=Moderate, D=High) C Private School Choice Programs C Teacher Quality and Policies: Overall Grade C- Delivering Well Prepared Teachers D+ Expanding the Teaching Pool C- Identifying Effective Teachers D- Retaining Effective Teachers C+ Exiting Ineffective Teachers C Digital Learning C Graduation Rate Average Class Size Annual Cost Per Student 82.8% 11.59 $12,704 Supplemental Information (The following is provided solely for informative reasons. It does not influence the above grade or ranking.) 12.2% 53.3% 34.6% Funding Sources Federal Funds State Funds Local Funds
  • 71. www.alec.org 63 STATE SNAPSHOTS The Old Line State Maryland NAEP Scores for Low-Income General Education Students (2003-2013) NAEP Low-Income General Education Student Score Distribution (2013) 112013 NAEP Performance Rank ALEC Historical Ranking 2009 NAEP: 20th | 2011 NAEP: 20th Measures the overall scores for low-income general education students (non-ELL and non-IEP) and their gains/losses on the National Assessment of Educational Progress (NAEP) fourth- and eighth-grade reading and mathematics exams from 2003 to 2013. n States MD outperformed Education Policy Grade ALEC Historical Grading 2011: C- | 2012: D+| 2013: D+ Grades state-level education policies that provide high-quality educational options to all students. 0 25 50 75 100 At Proficient At Advanced At Basic Below Basic 4th-Grade Reading 8th-Grade Reading 4th-Grade Math 8th-Grade Math 3% 21% 38% 23% 49% 26% 26% 49% 22% 19% 45% 32%36% 0% 25% 50% 75% 100% 5% 2% 4% 4% 243 281 323 214 249 282 262 299 333 202 218 214 238 268 BASIC PROFICIENT ADVANCED 4th-Grade Reading 8th-Grade Reading 4th-Grade Math 8th-Grade Math 2003 2013 249 262 218 235 261 277 D+ State Academic Standards C Charter Schools Charter Schools Allowed Yes Charter School Law Grade F Homeschool Regulation Burden (A=None, B=Low, C=Moderate, D=High) C Private School Choice Programs F Teacher Quality and Policies: Overall Grade D+ Delivering Well Prepared Teachers D+ Expanding the Teaching Pool C- Identifying Effective Teachers C- Retaining Effective Teachers C- Exiting Ineffective Teachers F Digital Learning C Graduation Rate Average Class Size Annual Cost Per Student 82.2% 14.51 $15,774 Supplemental Information (The following is provided solely for informative reasons. It does not influence the above grade or ranking.) 9.3% 49.7% 41.0% Funding Sources Federal Funds State Funds Local Funds
  • 72. 64 Report Card on American Education 2014 STUDENT PERFORMANCE AND STATE EDUCATION POLICY GRADES INDEX The Bay State Massachusetts NAEP Scores for Low-Income General Education Students (2003-2013) NAEP Low-Income General Education Student Score Distribution (2013) 12013 NAEP Performance Rank ALEC Historical Ranking 2009 NAEP: 2nd | 2011 NAEP: 1st Measures the overall scores for low-income general education students (non-ELL and non-IEP) and their gains/losses on the National Assessment of Educational Progress (NAEP) fourth- and eighth-grade reading and mathematics exams from 2003 to 2013. n States MA outperformed Education Policy Grade ALEC Historical Grading 2011: B- | 2012: C| 2013: C Grades state-level education policies that provide high-quality educational options to all students. 0 25 50 75 100 At Proficient At Advanced At Basic Below Basic 4th-Grade Reading 8th-Grade Reading 4th-Grade Math 8th-Grade Math 3% 31% 42% 34% 48% 15% 40% 45% 8% 33% 45% 14%22% 0% 25% 50% 75% 100% 5% 3% 7% 7% 243 281 323 214 249 282 262 299 333 217 227 214 238 268 BASIC PROFICIENT ADVANCED 4th-Grade Reading 8th-Grade Reading 4th-Grade Math 8th-Grade Math 2003 2013 260 272 231 247 270 292 C- State Academic Standards A Charter Schools Charter Schools Allowed Yes Charter School Law Grade C Homeschool Regulation Burden (A=None, B=Low, C=Moderate, D=High) D Private School Choice Programs F Teacher Quality and Policies: Overall Grade B- Delivering Well Prepared Teachers B- Expanding the Teaching Pool C+ Identifying Effective Teachers C- Retaining Effective Teachers C+ Exiting Ineffective Teachers B Digital Learning D+ Graduation Rate Average Class Size Annual Cost Per Student 82.6% 13.69 $16,495 Supplemental Information (The following is provided solely for informative reasons. It does not influence the above grade or ranking.) 7.8% 54.2% 37.9% Funding Sources Federal Funds State Funds Local Funds
  • 73. www.alec.org 65 STATE SNAPSHOTS The Great Lakes State Michigan NAEP Scores for Low-Income General Education Students (2003-2013) NAEP Low-Income General Education Student Score Distribution (2013) 402013 NAEP Performance Rank ALEC Historical Ranking 2009 NAEP: 49th | 2011 NAEP: 46th Measures the overall scores for low-income general education students (non-ELL and non-IEP) and their gains/losses on the National Assessment of Educational Progress (NAEP) fourth- and eighth-grade reading and mathematics exams from 2003 to 2013. n States MI outperformed Education Policy Grade ALEC Historical Grading 2011: B- | 2012: B-| 2013: C+ Grades state-level education policies that provide high-quality educational options to all students. 0 25 50 75 100 At Proficient At Advanced At Basic Below Basic 4th-Grade Reading 8th-Grade Reading 4th-Grade Math 8th-Grade Math 3% 19% 36% 21% 51% 28% 22% 47% 29% 17% 42% 38%41% 0% 25% 50% 75% 100% 4% 1% 3% 3% 243 281 323 214 249 282 262 299 333 204 214 214 238 268 BASIC PROFICIENT ADVANCED 4th-Grade Reading 8th-Grade Reading 4th-Grade Math 8th-Grade Math 2003 2013 251 259 221 229 263 272 B- State Academic Standards B Charter Schools Charter Schools Allowed Yes Charter School Law Grade A Homeschool Regulation Burden (A=None, B=Low, C=Moderate, D=High) A Private School Choice Programs F Teacher Quality and Policies: Overall Grade B- Delivering Well Prepared Teachers D+ Expanding the Teaching Pool B- Identifying Effective Teachers B Retaining Effective Teachers B- Exiting Ineffective Teachers C+ Digital Learning C Graduation Rate Average Class Size Annual Cost Per Student 75.9% 17.79 $12,644 Supplemental Information (The following is provided solely for informative reasons. It does not influence the above grade or ranking.) 13.7% 32.8% 53.5% Funding Sources Federal Funds State Funds Local Funds
  • 74. 66 Report Card on American Education 2014 STUDENT PERFORMANCE AND STATE EDUCATION POLICY GRADES INDEX The North Star State Minnesota NAEP Scores for Low-Income General Education Students (2003-2013) NAEP Low-Income General Education Student Score Distribution (2013) 132013 NAEP Performance Rank ALEC Historical Ranking 2009 NAEP: 23rd | 2011 NAEP: 18th Measures the overall scores for low-income general education students (non-ELL and non-IEP) and their gains/losses on the National Assessment of Educational Progress (NAEP) fourth- and eighth-grade reading and mathematics exams from 2003 to 2013. n States MN outperformed Education Policy Grade ALEC Historical Grading 2011: B+ | 2012: C+| 2013: C+ Grades state-level education policies that provide high-quality educational options to all students. 0 25 50 75 100 At Proficient At Advanced At Basic Below Basic 4th-Grade Reading 8th-Grade Reading 4th-Grade Math 8th-Grade Math 3% 26% 39% 26% 51% 20% 43% 42% 10% 26% 45% 21% 31% 0% 25% 50% 75% 100% 5% 2% 5% 7% 243 281 323 214 249 282 262 299 333 217 222 214 238 268 BASIC PROFICIENT ADVANCED 4th-Grade Reading 8th-Grade Reading 4th-Grade Math 8th-Grade Math 2003 2013 257 266 232 246 281 287 B- State Academic Standards B- Charter Schools Charter Schools Allowed Yes Charter School Law Grade A Homeschool Regulation Burden (A=None, B=Low, C=Moderate, D=High) C Private School Choice Programs C Teacher Quality and Policies: Overall Grade C- Delivering Well Prepared Teachers C+ Expanding the Teaching Pool C Identifying Effective Teachers C- Retaining Effective Teachers D+ Exiting Ineffective Teachers F Digital Learning B+ Graduation Rate Average Class Size Annual Cost Per Student 88.8% 15.84 $13,464 Supplemental Information (The following is provided solely for informative reasons. It does not influence the above grade or ranking.) 7.8% 33.7% 58.5% Funding Sources Federal Funds State Funds Local Funds
  • 75. www.alec.org 67 STATE SNAPSHOTS The Magnolia State Mississippi NAEP Scores for Low-Income General Education Students (2003-2013) NAEP Low-Income General Education Student Score Distribution (2013) 432013 NAEP Performance Rank ALEC Historical Ranking 2009 NAEP: 46th | 2011 NAEP: 48th Measures the overall scores for low-income general education students (non-ELL and non-IEP) and their gains/losses on the National Assessment of Educational Progress (NAEP) fourth- and eighth-grade reading and mathematics exams from 2003 to 2013. n States MS outperformed Education Policy Grade ALEC Historical Grading 2011: C | 2012: C-| 2013: C- Grades state-level education policies that provide high-quality educational options to all students. 0 25 50 75 100 At Proficient At Advanced At Basic Below Basic 4th-Grade Reading 8th-Grade Reading 4th-Grade Math 8th-Grade Math 3% 14% 33% 14% 45% 41% 18% 52% 29% 14% 40% 44%51% 0% 25% 50% 75% 100% 2% 0% 1% 2% 243 281 323 214 249 282 262 299 333 197 206214 238 268 BASIC PROFICIENT ADVANCED 4th-Grade Reading 8th-Grade Reading 4th-Grade Math 8th-Grade Math 2003 2013 248 250 217 228 252 267 C State Academic Standards C- Charter Schools Charter Schools Allowed Yes Charter School Law Grade D Homeschool Regulation Burden (A=None, B=Low, C=Moderate, D=High) B Private School Choice Programs B Teacher Quality and Policies: Overall Grade C Delivering Well Prepared Teachers C Expanding the Teaching Pool C+ Identifying Effective Teachers C- Retaining Effective Teachers C Exiting Ineffective Teachers D+ Digital Learning D- Graduation Rate Average Class Size Annual Cost Per Student 63.8% 14.88 $9,190 Supplemental Information (The following is provided solely for informative reasons. It does not influence the above grade or ranking.) 22.3% 31.7% 46.0% Funding Sources Federal Funds State Funds Local Funds
  • 76. 68 Report Card on American Education 2014 STUDENT PERFORMANCE AND STATE EDUCATION POLICY GRADES INDEX The Show-Me State Missouri NAEP Scores for Low-Income General Education Students (2003-2013) NAEP Low-Income General Education Student Score Distribution (2013) 462013 NAEP Performance Rank ALEC Historical Ranking 2009 NAEP: 34th | 2011 NAEP: 47th Measures the overall scores for low-income general education students (non-ELL and non-IEP) and their gains/losses on the National Assessment of Educational Progress (NAEP) fourth- and eighth-grade reading and mathematics exams from 2003 to 2013. n States MO outperformed Education Policy Grade ALEC Historical Grading 2011: A- | 2012: C | 2013: B- Grades state-level education policies that provide high-quality educational options to all students. 0 25 50 75 100 At Proficient At Advanced At Basic Below Basic 4th-Grade Reading 8th-Grade Reading 4th-Grade Math 8th-Grade Math 3% 22% 37% 25% 50% 24% 26% 51% 21% 18% 48% 31%36% 0% 25% 50% 75% 100% 4% 1% 2% 3% 243 281 323 214 249 282 262 299 333 211 218 214 238 268 BASIC PROFICIENT ADVANCED 4th-Grade Reading 8th-Grade Reading 4th-Grade Math 8th-Grade Math 2003 2013 258 263 227 234 269 275 C+ State Academic Standards A Charter Schools Charter Schools Allowed Yes Charter School Law Grade B Homeschool Regulation Burden (A=None, B=Low, C=Moderate, D=High) A Private School Choice Programs F Teacher Quality and Policies: Overall Grade C- Delivering Well Prepared Teachers B- Expanding the Teaching Pool D+ Identifying Effective Teachers D+ Retaining Effective Teachers C Exiting Ineffective Teachers D+ Digital Learning D+ Graduation Rate Average Class Size Annual Cost Per Student 83.7% 13.54 $10,977 Supplemental Information (The following is provided solely for informative reasons. It does not influence the above grade or ranking.) 13.7% 47.4% 38.9% Funding Sources Federal Funds State Funds Local Funds
  • 77. www.alec.org 69 STATE SNAPSHOTS The Treasure State Montana NAEP Scores for Low-Income General Education Students (2003-2013) NAEP Low-Income General Education Student Score Distribution (2013) 342013 NAEP Performance Rank ALEC Historical Ranking 2009 NAEP: 9th | 2011 NAEP: 16th Measures the overall scores for low-income general education students (non-ELL and non-IEP) and their gains/losses on the National Assessment of Educational Progress (NAEP) fourth- and eighth-grade reading and mathematics exams from 2003 to 2013. n States MT outperformed Education Policy Grade ALEC Historical Grading 2011: C | 2012: D | 2013: D+ Grades state-level education policies that provide high-quality educational options to all students. 0 25 50 75 100 At Proficient At Advanced At Basic Below Basic 4th-Grade Reading 8th-Grade Reading 4th-Grade Math 8th-Grade Math 3% 22% 39% 30% 51% 18% 33% 50% 14% 26% 45% 25% 35% 0% 25% 50% 75% 100% 4% 1% 3% 4% 243 281 323 214 249 282 262 299 333 215 219 214 238 268 BASIC PROFICIENT ADVANCED 4th-Grade Reading 8th-Grade Reading 4th-Grade Math 8th-Grade Math 2003 2013 265 267 233 240 281 283 D State Academic Standards C Charter Schools Charter Schools Allowed No Charter School Law Grade – Homeschool Regulation Burden (A=None, B=Low, C=Moderate, D=High) B Private School Choice Programs D Teacher Quality and Policies: Overall Grade F Delivering Well Prepared Teachers F Expanding the Teaching Pool F Identifying Effective Teachers F Retaining Effective Teachers D- Exiting Ineffective Teachers F Digital Learning F Graduation Rate Average Class Size Annual Cost Per Student 81.9% 13.48 $11,434 Supplemental Information (The following is provided solely for informative reasons. It does not influence the above grade or ranking.) 16.3% 39.6% 44.1% Funding Sources Federal Funds State Funds Local Funds
  • 78. 70 Report Card on American Education 2014 STUDENT PERFORMANCE AND STATE EDUCATION POLICY GRADES INDEX The Cornhusker State Nebraska NAEP Scores for Low-Income General Education Students (2003-2013) NAEP Low-Income General Education Student Score Distribution (2013) 352013 NAEP Performance Rank ALEC Historical Ranking 2009 NAEP: 33rd | 2011 NAEP: 42nd Measures the overall scores for low-income general education students (non-ELL and non-IEP) and their gains/losses on the National Assessment of Educational Progress (NAEP) fourth- and eighth-grade reading and mathematics exams from 2003 to 2013. n States NE outperformed Education Policy Grade ALEC Historical Grading 2011: D+ | 2012: D | 2013: D+ Grades state-level education policies that provide high-quality educational options to all students. 0 25 50 75 100 At Proficient At Advanced At Basic Below Basic 4th-Grade Reading 8th-Grade Reading 4th-Grade Math 8th-Grade Math 3% 25% 39% 25% 52% 21% 30% 49% 18% 21% 46% 30%31% 0% 25% 50% 75% 100% 4% 1% 3% 3% 243 281 323 214 249 282 262 299 333 215 221 214 238 268 BASIC PROFICIENT ADVANCED 4th-Grade Reading 8th-Grade Reading 4th-Grade Math 8th-Grade Math 2003 2013 260 264 228 237 271 278 D State Academic Standards C Charter Schools Charter Schools Allowed No Charter School Law Grade – Homeschool Regulation Burden (A=None, B=Low, C=Moderate, D=High) B Private School Choice Programs F Teacher Quality and Policies: Overall Grade D- Delivering Well Prepared Teachers D- Expanding the Teaching Pool D- Identifying Effective Teachers D Retaining Effective Teachers D+ Exiting Ineffective Teachers F Digital Learning F Graduation Rate Average Class Size Annual Cost Per Student 83.8% 13.27 $12,773 Supplemental Information (The following is provided solely for informative reasons. It does not influence the above grade or ranking.) 15.0% 54.6% 30.3% Funding Sources Federal Funds State Funds Local Funds
  • 79. www.alec.org 71 STATE SNAPSHOTS The Silver State Nevada NAEP Scores for Low-Income General Education Students (2003-2013) NAEP Low-Income General Education Student Score Distribution (2013) 122013 NAEP Performance Rank ALEC Historical Ranking 2009 NAEP: 18th | 2011 NAEP: 15th Measures the overall scores for low-income general education students (non-ELL and non-IEP) and their gains/losses on the National Assessment of Educational Progress (NAEP) fourth- and eighth-grade reading and mathematics exams from 2003 to 2013. n States NV outperformed Education Policy Grade ALEC Historical Grading 2011: C+ | 2012: C+| 2013: C Grades state-level education policies that provide high-quality educational options to all students. 0 25 50 75 100 At Proficient At Advanced At Basic Below Basic 4th-Grade Reading 8th-Grade Reading 4th-Grade Math 8th-Grade Math 3% 21% 42% 24% 49% 24% 30% 50% 17% 19% 47% 31%34% 0% 25% 50% 75% 100% 4% 2% 3% 2% 243 281 323 214 249 282 262 299 333 201 219 214 238 268 BASIC PROFICIENT ADVANCED 4th-Grade Reading 8th-Grade Reading 4th-Grade Math 8th-Grade Math 2003 2013 249 262 223 237 262 277 B- State Academic Standards C+ Charter Schools Charter Schools Allowed Yes Charter School Law Grade C Homeschool Regulation Burden (A=None, B=Low, C=Moderate, D=High) B Private School Choice Programs A Teacher Quality and Policies: Overall Grade C- Delivering Well Prepared Teachers D- Expanding the Teaching Pool D Identifying Effective Teachers B- Retaining Effective Teachers D+ Exiting Ineffective Teachers B Digital Learning B+ Graduation Rate Average Class Size Annual Cost Per Student 57.8% 19.41 $9,649 Supplemental Information (The following is provided solely for informative reasons. It does not influence the above grade or ranking.) 10.8% 32.3% 56.9% Funding Sources Federal Funds State Funds Local Funds
  • 80. 72 Report Card on American Education 2014 STUDENT PERFORMANCE AND STATE EDUCATION POLICY GRADES INDEX The Granite State New Hampshire NAEP Scores for Low-Income General Education Students (2003-2013) NAEP Low-Income General Education Student Score Distribution (2013) 92013 NAEP Performance Rank ALEC Historical Ranking 2009 NAEP: 4th | 2011 NAEP: 9th Measures the overall scores for low-income general education students (non-ELL and non-IEP) and their gains/losses on the National Assessment of Educational Progress (NAEP) fourth- and eighth-grade reading and mathematics exams from 2003 to 2013. n States NH outperformed Education Policy Grade ALEC Historical Grading 2011: C+ | 2012: C | 2013: C Grades state-level education policies that provide high-quality educational options to all students. 0 25 50 75 100 At Proficient At Advanced At Basic Below Basic 4th-Grade Reading 8th-Grade Reading 4th-Grade Math 8th-Grade Math 3% 26% 45% 29% 52% 17% 41% 47% 7% 29% 48% 17%25% 0% 25% 50% 75% 100% 4% 2% 5% 6% 243 281 323 214 249 282 262 299 333 218 225 214 238 268 BASIC PROFICIENT ADVANCED 4th-Grade Reading 8th-Grade Reading 4th-Grade Math 8th-Grade Math 2003 2013 264 268 236 247 278 289 D+ State Academic Standards C+ Charter Schools Charter Schools Allowed Yes Charter School Law Grade D Homeschool Regulation Burden (A=None, B=Low, C=Moderate, D=High) C Private School Choice Programs D Teacher Quality and Policies: Overall Grade D Delivering Well Prepared Teachers C- Expanding the Teaching Pool D Identifying Effective Teachers D- Retaining Effective Teachers F Exiting Ineffective Teachers D Digital Learning D Graduation Rate Average Class Size Annual Cost Per Student 86.3% 12.73 $15,032 Supplemental Information (The following is provided solely for informative reasons. It does not influence the above grade or ranking.) 6.5% 56.2% 37.3% Funding Sources Federal Funds State Funds Local Funds
  • 81. www.alec.org 73 STATE SNAPSHOTS The Garden State New Jersey NAEP Scores for Low-Income General Education Students (2003-2013) NAEP Low-Income General Education Student Score Distribution (2013) 22013 NAEP Performance Rank ALEC Historical Ranking 2009 NAEP: 10th | 2011 NAEP: 3rd Measures the overall scores for low-income general education students (non-ELL and non-IEP) and their gains/losses on the National Assessment of Educational Progress (NAEP) fourth- and eighth-grade reading and mathematics exams from 2003 to 2013. n States NJ outperformed Education Policy Grade ALEC Historical Grading 2011: B- | 2012: C | 2013: C+ Grades state-level education policies that provide high-quality educational options to all students. 0 25 50 75 100 At Proficient At Advanced At Basic Below Basic 4th-Grade Reading 8th-Grade Reading 4th-Grade Math 8th-Grade Math 3% 23% 41% 30% 50% 18% 30% 52% 15% 29% 45% 20%32% 0% 25% 50% 75% 100% 4% 2% 3% 6% 243 281 323 214 249 282 262 299 333 207 220 214 238 268 BASIC PROFICIENT ADVANCED 4th-Grade Reading 8th-Grade Reading 4th-Grade Math 8th-Grade Math 2003 2013 256 268 226 238 265 288 C State Academic Standards B- Charter Schools Charter Schools Allowed Yes Charter School Law Grade C Homeschool Regulation Burden (A=None, B=Low, C=Moderate, D=High) A Private School Choice Programs F Teacher Quality and Policies: Overall Grade B- Delivering Well Prepared Teachers B- Expanding the Teaching Pool B- Identifying Effective Teachers B- Retaining Effective Teachers C Exiting Ineffective Teachers C Digital Learning D- Graduation Rate Average Class Size Annual Cost Per Student 87.2% 12.11 $18,083 Supplemental Information (The following is provided solely for informative reasons. It does not influence the above grade or ranking.) 5.1% 58.1% 36.9% Funding Sources Federal Funds State Funds Local Funds
  • 82. 74 Report Card on American Education 2014 STUDENT PERFORMANCE AND STATE EDUCATION POLICY GRADES INDEX The Land of Enchantment New Mexico NAEP Scores for Low-Income General Education Students (2003-2013) NAEP Low-Income General Education Student Score Distribution (2013) 322013 NAEP Performance Rank ALEC Historical Ranking 2009 NAEP: 48th | 2011 NAEP: 35th Measures the overall scores for low-income general education students (non-ELL and non-IEP) and their gains/losses on the National Assessment of Educational Progress (NAEP) fourth- and eighth-grade reading and mathematics exams from 2003 to 2013. n States NM outperformed Education Policy Grade ALEC Historical Grading 2011: B | 2012: C | 2013: C Grades state-level education policies that provide high-quality educational options to all students. 0 25 50 75 100 At Proficient At Advanced At Basic Below Basic 4th-Grade Reading 8th-Grade Reading 4th-Grade Math 8th-Grade Math 3% 18% 38% 20% 53% 27% 28% 50% 19% 19% 47% 32%41% 0% 25% 50% 75% 100% 3% 1% 2% 2% 243 281 323 214 249 282 262 299 333 207 214 214 238 268 BASIC PROFICIENT ADVANCED 4th-Grade Reading 8th-Grade Reading 4th-Grade Math 8th-Grade Math 2003 2013 251 259 225 236 263 275 C- State Academic Standards B- Charter Schools Charter Schools Allowed Yes Charter School Law Grade C Homeschool Regulation Burden (A=None, B=Low, C=Moderate, D=High) B Private School Choice Programs F Teacher Quality and Policies: Overall Grade D+ Delivering Well Prepared Teachers D+ Expanding the Teaching Pool D- Identifying Effective Teachers C- Retaining Effective Teachers C- Exiting Ineffective Teachers C Digital Learning C Graduation Rate Average Class Size Annual Cost Per Student 67.3% 14.72 $10,838 Supplemental Information (The following is provided solely for informative reasons. It does not influence the above grade or ranking.) 17.7%16.7% 65.6% Funding Sources Federal Funds State Funds Local Funds
  • 83. www.alec.org 75 STATE SNAPSHOTS The Empire State New York NAEP Scores for Low-Income General Education Students (2003-2013) NAEP Low-Income General Education Student Score Distribution (2013) 192013 NAEP Performance Rank ALEC Historical Ranking 2009 NAEP: 5th | 2011 NAEP: 10th Measures the overall scores for low-income general education students (non-ELL and non-IEP) and their gains/losses on the National Assessment of Educational Progress (NAEP) fourth- and eighth-grade reading and mathematics exams from 2003 to 2013. n States NY outperformed Education Policy Grade ALEC Historical Grading 2011: C- | 2012: C- | 2013: C Grades state-level education policies that provide high-quality educational options to all students. 0 25 50 75 100 At Proficient At Advanced At Basic Below Basic 4th-Grade Reading 8th-Grade Reading 4th-Grade Math 8th-Grade Math 3% 25% 40% 26% 51% 21% 29% 51% 17% 19% 46% 29%30% 0% 25% 50% 75% 100% 5% 2% 4% 6% 243 281 323 214 249 282 262 299 333 212 222 214 238 268 BASIC PROFICIENT ADVANCED 4th-Grade Reading 8th-Grade Reading 4th-Grade Math 8th-Grade Math 2003 2013 258 264 229 238 271 279 C State Academic Standards A Charter Schools Charter Schools Allowed Yes Charter School Law Grade B Homeschool Regulation Burden (A=None, B=Low, C=Moderate, D=High) D Private School Choice Programs F Teacher Quality and Policies: Overall Grade B- Delivering Well Prepared Teachers B Expanding the Teaching Pool C+ Identifying Effective Teachers B- Retaining Effective Teachers C+ Exiting Ineffective Teachers C- Digital Learning D- Graduation Rate Average Class Size Annual Cost Per Student 76.0% 12.88 $21,489 Supplemental Information (The following is provided solely for informative reasons. It does not influence the above grade or ranking.) 8.9% 50.8% 40.3% Funding Sources Federal Funds State Funds Local Funds
  • 84. 76 Report Card on American Education 2014 STUDENT PERFORMANCE AND STATE EDUCATION POLICY GRADES INDEX The Old North State North Carolina NAEP Scores for Low-Income General Education Students (2003-2013) NAEP Low-Income General Education Student Score Distribution (2013) 162013 NAEP Performance Rank ALEC Historical Ranking 2009 NAEP: 41st | 2011 NAEP: 7th Measures the overall scores for low-income general education students (non-ELL and non-IEP) and their gains/losses on the National Assessment of Educational Progress (NAEP) fourth- and eighth-grade reading and mathematics exams from 2003 to 2013. n States NC outperformed Education Policy Grade ALEC Historical Grading 2011: C | 2012: C | 2013: C+ Grades state-level education policies that provide high-quality educational options to all students. 0 25 50 75 100 At Proficient At Advanced At Basic Below Basic 4th-Grade Reading 8th-Grade Reading 4th-Grade Math 8th-Grade Math 3% 24% 42% 22% 51% 25% 32% 52% 13% 24% 46% 26%31% 0% 25% 50% 75% 100% 3% 1% 2% 5% 243 281 323 214 249 282 262 299 333 210 221 214 238 268 BASIC PROFICIENT ADVANCED 4th-Grade Reading 8th-Grade Reading 4th-Grade Math 8th-Grade Math 2003 2013 251 261 231 240 269 282 B- State Academic Standards A Charter Schools Charter Schools Allowed Yes Charter School Law Grade C Homeschool Regulation Burden (A=None, B=Low, C=Moderate, D=High) C Private School Choice Programs B Teacher Quality and Policies: Overall Grade C Delivering Well Prepared Teachers C+ Expanding the Teaching Pool D+ Identifying Effective Teachers B- Retaining Effective Teachers B- Exiting Ineffective Teachers F Digital Learning C Graduation Rate Average Class Size Annual Cost Per Student 76.9% 14.12 $9,951 Supplemental Information (The following is provided solely for informative reasons. It does not influence the above grade or ranking.) 14.2% 33.8% 52.0% Funding Sources Federal Funds State Funds Local Funds
  • 85. www.alec.org 77 STATE SNAPSHOTS The Peace Garden State North Dakota NAEP Scores for Low-Income General Education Students (2003-2013) NAEP Low-Income General Education Student Score Distribution (2013) 382013 NAEP Performance Rank ALEC Historical Ranking 2009 NAEP: 24th | 2011 NAEP: 33rd Measures the overall scores for low-income general education students (non-ELL and non-IEP) and their gains/losses on the National Assessment of Educational Progress (NAEP) fourth- and eighth-grade reading and mathematics exams from 2003 to 2013. n States ND outperformed Education Policy Grade ALEC Historical Grading 2011: D+ | 2012: D | 2013: D Grades state-level education policies that provide high-quality educational options to all students. 0 25 50 75 100 At Proficient At Advanced At Basic Below Basic 4th-Grade Reading 8th-Grade Reading 4th-Grade Math 8th-Grade Math 3% 23% 41% 22% 55% 22% 33% 48% 15% 24% 50% 22%33% 0% 25% 50% 75% 100% 3% 1% 4% 4% 243 281 323 214 249 282 262 299 333 217 219 214 238 268 BASIC PROFICIENT ADVANCED 4th-Grade Reading 8th-Grade Reading 4th-Grade Math 8th-Grade Math 2003 2013 266 262 235 240 284 283 D- State Academic Standards C Charter Schools Charter Schools Allowed No Charter School Law Grade – Homeschool Regulation Burden (A=None, B=Low, C=Moderate, D=High) C Private School Choice Programs F Teacher Quality and Policies: Overall Grade D Delivering Well Prepared Teachers D Expanding the Teaching Pool F Identifying Effective Teachers D Retaining Effective Teachers D Exiting Ineffective Teachers D Digital Learning F Graduation Rate Average Class Size Annual Cost Per Student 88.4% 11.36 $13,118 Supplemental Information (The following is provided solely for informative reasons. It does not influence the above grade or ranking.) 14.8% 35.3% 49.9% Funding Sources Federal Funds State Funds Local Funds
  • 86. 78 Report Card on American Education 2014 STUDENT PERFORMANCE AND STATE EDUCATION POLICY GRADES INDEX The Buckeye State Ohio NAEP Scores for Low-Income General Education Students (2003-2013) NAEP Low-Income General Education Student Score Distribution (2013) 292013 NAEP Performance Rank ALEC Historical Ranking 2009 NAEP: 35th | 2011 NAEP: 21st Measures the overall scores for low-income general education students (non-ELL and non-IEP) and their gains/losses on the National Assessment of Educational Progress (NAEP) fourth- and eighth-grade reading and mathematics exams from 2003 to 2013. n States OH outperformed Education Policy Grade ALEC Historical Grading 2011: B | 2012: B | 2013: C Grades state-level education policies that provide high-quality educational options to all students. 0 25 50 75 100 At Proficient At Advanced At Basic Below Basic 4th-Grade Reading 8th-Grade Reading 4th-Grade Math 8th-Grade Math 3% 20% 39% 25% 49% 25% 29% 49% 19% 21% 49% 25% 38% 0% 25% 50% 75% 100% 3% 1% 3% 4% 243 281 323 214 249 282 262 299 333 211 215 214 238 268 BASIC PROFICIENT ADVANCED 4th-Grade Reading 8th-Grade Reading 4th-Grade Math 8th-Grade Math 2003 2013 255 262 226 236 269 281 C+ State Academic Standards C- Charter Schools Charter Schools Allowed Yes Charter School Law Grade C Homeschool Regulation Burden (A=None, B=Low, C=Moderate, D=High) C Private School Choice Programs A Teacher Quality and Policies: Overall Grade B- Delivering Well Prepared Teachers C Expanding the Teaching Pool B Identifying Effective Teachers C Retaining Effective Teachers C+ Exiting Ineffective Teachers B- Digital Learning D Graduation Rate Average Class Size Annual Cost Per Student 81.4% 15.84 $13,764 Supplemental Information (The following is provided solely for informative reasons. It does not influence the above grade or ranking.) 11.1% 45.7% 43.2% Funding Sources Federal Funds State Funds Local Funds
  • 87. www.alec.org 79 STATE SNAPSHOTS The Sooner State Oklahoma NAEP Scores for Low-Income General Education Students (2003-2013) NAEP Low-Income General Education Student Score Distribution (2013) 412013 NAEP Performance Rank ALEC Historical Ranking 2009 NAEP: 43rd | 2011 NAEP: 43rd Measures the overall scores for low-income general education students (non-ELL and non-IEP) and their gains/losses on the National Assessment of Educational Progress (NAEP) fourth- and eighth-grade reading and mathematics exams from 2003 to 2013. n States OK outperformed Education Policy Grade ALEC Historical Grading 2011: B | 2012: B+ | 2013: B- Grades state-level education policies that provide high-quality educational options to all students. 0 25 50 75 100 At Proficient At Advanced At Basic Below Basic 4th-Grade Reading 8th-Grade Reading 4th-Grade Math 8th-Grade Math 3% 22% 41% 23% 53% 22% 29% 52% 16% 16% 49% 32%34% 0% 25% 50% 75% 100% 3% 1% 3% 2% 243 281 323 214 249 282 262 299 333 212 219 214 238 268 BASIC PROFICIENT ADVANCED 4th-Grade Reading 8th-Grade Reading 4th-Grade Math 8th-Grade Math 2003 2013 259 263 227 237 268 274 B- State Academic Standards D Charter Schools Charter Schools Allowed Yes Charter School Law Grade C Homeschool Regulation Burden (A=None, B=Low, C=Moderate, D=High) A Private School Choice Programs A Teacher Quality and Policies: Overall Grade B- Delivering Well Prepared Teachers C Expanding the Teaching Pool C+ Identifying Effective Teachers C+ Retaining Effective Teachers C+ Exiting Ineffective Teachers A Digital Learning C+ Graduation Rate Average Class Size Annual Cost Per Student 78.5% 15.37 $8,863 Supplemental Information (The following is provided solely for informative reasons. It does not influence the above grade or ranking.) 16.6% 36.4% 47.0% Funding Sources Federal Funds State Funds Local Funds
  • 88. 80 Report Card on American Education 2014 STUDENT PERFORMANCE AND STATE EDUCATION POLICY GRADES INDEX The Beaver State Oregon NAEP Scores for Low-Income General Education Students (2003-2013) NAEP Low-Income General Education Student Score Distribution (2013) 362013 NAEP Performance Rank ALEC Historical Ranking 2009 NAEP: 32nd | 2011 NAEP: 40th Measures the overall scores for low-income general education students (non-ELL and non-IEP) and their gains/losses on the National Assessment of Educational Progress (NAEP) fourth- and eighth-grade reading and mathematics exams from 2003 to 2013. n States OR outperformed Education Policy Grade ALEC Historical Grading 2011: C | 2012: C | 2013: C- Grades state-level education policies that provide high-quality educational options to all students. 0 25 50 75 100 At Proficient At Advanced At Basic Below Basic 4th-Grade Reading 8th-Grade Reading 4th-Grade Math 8th-Grade Math 3% 24% 39% 26% 52% 21% 31% 49% 16% 22% 48% 28%32% 0% 25% 50% 75% 100% 5% 1% 4% 3% 243 281 323 214 249 282 262 299 333 214 221 214 238 268 BASIC PROFICIENT ADVANCED 4th-Grade Reading 8th-Grade Reading 4th-Grade Math 8th-Grade Math 2003 2013 262 265 234 239 275 279 C- State Academic Standards C Charter Schools Charter Schools Allowed Yes Charter School Law Grade C Homeschool Regulation Burden (A=None, B=Low, C=Moderate, D=High) C Private School Choice Programs F Teacher Quality and Policies: Overall Grade D Delivering Well Prepared Teachers D+ Expanding the Teaching Pool D- Identifying Effective Teachers D Retaining Effective Teachers C- Exiting Ineffective Teachers F Digital Learning C Graduation Rate Average Class Size Annual Cost Per Student 76.3% 20.26 $10,832 Supplemental Information (The following is provided solely for informative reasons. It does not influence the above grade or ranking.) 14.0% 39.9% 46.1% Funding Sources Federal Funds State Funds Local Funds
  • 89. www.alec.org 81 STATE SNAPSHOTS The Keystone State Pennsylvania NAEP Scores for Low-Income General Education Students (2003-2013) NAEP Low-Income General Education Student Score Distribution (2013) 72013 NAEP Performance Rank ALEC Historical Ranking 2009 NAEP: 6th | 2011 NAEP: 5th Measures the overall scores for low-income general education students (non-ELL and non-IEP) and their gains/losses on the National Assessment of Educational Progress (NAEP) fourth- and eighth-grade reading and mathematics exams from 2003 to 2013. n States PA outperformed Education Policy Grade ALEC Historical Grading 2011: C+ | 2012: B- | 2013: C- Grades state-level education policies that provide high-quality educational options to all students. 0 25 50 75 100 At Proficient At Advanced At Basic Below Basic 4th-Grade Reading 8th-Grade Reading 4th-Grade Math 8th-Grade Math 3% 23% 41% 29% 48% 20% 28% 51% 18% 25% 44% 27%33% 0% 25% 50% 75% 100% 4% 2% 3% 3% 243 281 323 214 249 282 262 299 333 205 220 214 238 268 BASIC PROFICIENT ADVANCED 4th-Grade Reading 8th-Grade Reading 4th-Grade Math 8th-Grade Math 2003 2013 255 267 224 237 264 280 C- State Academic Standards A Charter Schools Charter Schools Allowed Yes Charter School Law Grade C Homeschool Regulation Burden (A=None, B=Low, C=Moderate, D=High) D Private School Choice Programs D Teacher Quality and Policies: Overall Grade C- Delivering Well Prepared Teachers C Expanding the Teaching Pool C- Identifying Effective Teachers C Retaining Effective Teachers D+ Exiting Ineffective Teachers D- Digital Learning D Graduation Rate Average Class Size Annual Cost Per Student 84.1% 13.64 $16,186 Supplemental Information (The following is provided solely for informative reasons. It does not influence the above grade or ranking.) 12.5% 53.3% 34.2% Funding Sources Federal Funds State Funds Local Funds
  • 90. 82 Report Card on American Education 2014 STUDENT PERFORMANCE AND STATE EDUCATION POLICY GRADES INDEX The Ocean State Rhode Island NAEP Scores for Low-Income General Education Students (2003-2013) NAEP Low-Income General Education Student Score Distribution (2013) 172013 NAEP Performance Rank ALEC Historical Ranking 2009 NAEP: 25th | 2011 NAEP: 6th Measures the overall scores for low-income general education students (non-ELL and non-IEP) and their gains/losses on the National Assessment of Educational Progress (NAEP) fourth- and eighth-grade reading and mathematics exams from 2003 to 2013. n States RI outperformed Education Policy Grade ALEC Historical Grading 2011: C | 2012: D+ | 2013: C Grades state-level education policies that provide high-quality educational options to all students. 0 25 50 75 100 At Proficient At Advanced At Basic Below Basic 4th-Grade Reading 8th-Grade Reading 4th-Grade Math 8th-Grade Math 3% 21% 41% 25% 51% 23% 29% 53% 16% 20% 50% 28%34% 0% 25% 50% 75% 100% 4% 1% 2% 2% 243 281 323 214 249 282 262 299 333 211 219 214 238 268 BASIC PROFICIENT ADVANCED 4th-Grade Reading 8th-Grade Reading 4th-Grade Math 8th-Grade Math 2003 2013 254 263 226 237 263 277 C- State Academic Standards C+ Charter Schools Charter Schools Allowed Yes Charter School Law Grade D Homeschool Regulation Burden (A=None, B=Low, C=Moderate, D=High) D Private School Choice Programs D Teacher Quality and Policies: Overall Grade B Delivering Well Prepared Teachers B+ Expanding the Teaching Pool B- Identifying Effective Teachers B+ Retaining Effective Teachers C- Exiting Ineffective Teachers B Digital Learning C Graduation Rate Average Class Size Annual Cost Per Student 76.4% 12.77 $15,799 Supplemental Information (The following is provided solely for informative reasons. It does not influence the above grade or ranking.) 10.6% 54.4% 35.0% Funding Sources Federal Funds State Funds Local Funds
  • 91. www.alec.org 83 STATE SNAPSHOTS The Palmetto State South Carolina NAEP Scores for Low-Income General Education Students (2003-2013) NAEP Low-Income General Education Student Score Distribution (2013) 512013 NAEP Performance Rank ALEC Historical Ranking 2009 NAEP: 51st | 2011 NAEP: 50th Measures the overall scores for low-income general education students (non-ELL and non-IEP) and their gains/losses on the National Assessment of Educational Progress (NAEP) fourth- and eighth-grade reading and mathematics exams from 2003 to 2013. n States SC outperformed Education Policy Grade ALEC Historical Grading 2011: C+ | 2012: C | 2013: C+ Grades state-level education policies that provide high-quality educational options to all students. 0 25 50 75 100 At Proficient At Advanced At Basic Below Basic 4th-Grade Reading 8th-Grade Reading 4th-Grade Math 8th-Grade Math 3% 18% 35% 19% 49% 31% 23% 52% 23% 17% 42% 38%44% 0% 25% 50% 75% 100% 2% 1% 2% 3% 243 281 323 214 249 282 262 299 333 206 212214 238 268 BASIC PROFICIENT ADVANCED 4th-Grade Reading 8th-Grade Reading 4th-Grade Math 8th-Grade Math 2003 2013 250 257 228 232 266 272 C State Academic Standards D+ Charter Schools Charter Schools Allowed Yes Charter School Law Grade B Homeschool Regulation Burden (A=None, B=Low, C=Moderate, D=High) C Private School Choice Programs D Teacher Quality and Policies: Overall Grade C- Delivering Well Prepared Teachers C+ Expanding the Teaching Pool C Identifying Effective Teachers D+ Retaining Effective Teachers C+ Exiting Ineffective Teachers D+ Digital Learning B- Graduation Rate Average Class Size Annual Cost Per Student 68.2% 15.39 $10,878 Supplemental Information (The following is provided solely for informative reasons. It does not influence the above grade or ranking.) 13.4% 43.6% 43.0% Funding Sources Federal Funds State Funds Local Funds
  • 92. 84 Report Card on American Education 2014 STUDENT PERFORMANCE AND STATE EDUCATION POLICY GRADES INDEX The Mount Rushmore State South Dakota NAEP Scores for Low-Income General Education Students (2003-2013) NAEP Low-Income General Education Student Score Distribution (2013) 492013 NAEP Performance Rank ALEC Historical Ranking 2009 NAEP: 39th | 2011 NAEP: 38th Measures the overall scores for low-income general education students (non-ELL and non-IEP) and their gains/losses on the National Assessment of Educational Progress (NAEP) fourth- and eighth-grade reading and mathematics exams from 2003 to 2013. n States SD outperformed Education Policy Grade ALEC Historical Grading 2011: C- | 2012: D+ | 2013: D+ Grades state-level education policies that provide high-quality educational options to all students. 0 25 50 75 100 At Proficient At Advanced At Basic Below Basic 4th-Grade Reading 8th-Grade Reading 4th-Grade Math 8th-Grade Math 3% 20% 36% 27% 51% 20% 27% 50% 20% 23% 45% 29% 41% 0% 25% 50% 75% 100% 3% 2% 3% 3% 243 281 323 214 249 282 262 299 333 217 214 214 238 268 BASIC PROFICIENT ADVANCED 4th-Grade Reading 8th-Grade Reading 4th-Grade Math 8th-Grade Math 2003 2013 269 266 233 235 280 279 D State Academic Standards C Charter Schools Charter Schools Allowed No Charter School Law Grade – Homeschool Regulation Burden (A=None, B=Low, C=Moderate, D=High) C Private School Choice Programs F Teacher Quality and Policies: Overall Grade D- Delivering Well Prepared Teachers D Expanding the Teaching Pool D+ Identifying Effective Teachers F Retaining Effective Teachers D- Exiting Ineffective Teachers F Digital Learning C Graduation Rate Average Class Size Annual Cost Per Student 81.8% 13.27 $10,311 Supplemental Information (The following is provided solely for informative reasons. It does not influence the above grade or ranking.) 20.3% 50.8% 28.9% Funding Sources Federal Funds State Funds Local Funds
  • 93. www.alec.org 85 STATE SNAPSHOTS The Volunteer State Tennessee NAEP Scores for Low-Income General Education Students (2003-2013) NAEP Low-Income General Education Student Score Distribution (2013) 242013 NAEP Performance Rank ALEC Historical Ranking 2009 NAEP: 36th | 2011 NAEP: 44th Measures the overall scores for low-income general education students (non-ELL and non-IEP) and their gains/losses on the National Assessment of Educational Progress (NAEP) fourth- and eighth-grade reading and mathematics exams from 2003 to 2013. n States TN outperformed Education Policy Grade ALEC Historical Grading 2011: C | 2012: C | 2013: C+ Grades state-level education policies that provide high-quality educational options to all students. 0 25 50 75 100 At Proficient At Advanced At Basic Below Basic 4th-Grade Reading 8th-Grade Reading 4th-Grade Math 8th-Grade Math 3% 19% 39% 23% 49% 26% 26% 49% 22% 15% 46% 37%39% 0% 25% 50% 75% 100% 3% 1% 2% 1% 243 281 323 214 249 282 262 299 333 203 215 214 238 268 BASIC PROFICIENT ADVANCED 4th-Grade Reading 8th-Grade Reading 4th-Grade Math 8th-Grade Math 2003 2013 249 261 219 234 256 271 C State Academic Standards A Charter Schools Charter Schools Allowed Yes Charter School Law Grade C Homeschool Regulation Burden (A=None, B=Low, C=Moderate, D=High) C Private School Choice Programs C Teacher Quality and Policies: Overall Grade B Delivering Well Prepared Teachers B- Expanding the Teaching Pool C+ Identifying Effective Teachers B+ Retaining Effective Teachers C+ Exiting Ineffective Teachers B- Digital Learning F Graduation Rate Average Class Size Annual Cost Per Student 80.4% 14.88 $8,765 Supplemental Information (The following is provided solely for informative reasons. It does not influence the above grade or ranking.) 14.7% 39.5% 45.8% Funding Sources Federal Funds State Funds Local Funds
  • 94. 86 Report Card on American Education 2014 STUDENT PERFORMANCE AND STATE EDUCATION POLICY GRADES INDEX The Lone Star State Texas NAEP Scores for Low-Income General Education Students (2003-2013) NAEP Low-Income General Education Student Score Distribution (2013) 182013 NAEP Performance Rank ALEC Historical Ranking 2009 NAEP: 8th | 2011 NAEP: 11th Measures the overall scores for low-income general education students (non-ELL and non-IEP) and their gains/losses on the National Assessment of Educational Progress (NAEP) fourth- and eighth-grade reading and mathematics exams from 2003 to 2013. n States TX outperformed Education Policy Grade ALEC Historical Grading 2011: C+ | 2012: C+ | 2013: C Grades state-level education policies that provide high-quality educational options to all students. 0 25 50 75 100 At Proficient At Advanced At Basic Below Basic 4th-Grade Reading 8th-Grade Reading 4th-Grade Math 8th-Grade Math 3% 20% 41% 21% 54% 24% 32% 51% 14% 27% 49% 19% 36% 0% 25% 50% 75% 100% 3% 1% 3% 4% 243 281 323 214 249 282 262 299 333 211 217 214 238 268 BASIC PROFICIENT ADVANCED 4th-Grade Reading 8th-Grade Reading 4th-Grade Math 8th-Grade Math 2003 2013 252 261 233 239 271 286 C State Academic Standards C- Charter Schools Charter Schools Allowed Yes Charter School Law Grade C Homeschool Regulation Burden (A=None, B=Low, C=Moderate, D=High) A Private School Choice Programs F Teacher Quality and Policies: Overall Grade C- Delivering Well Prepared Teachers B Expanding the Teaching Pool C+ Identifying Effective Teachers D- Retaining Effective Teachers D+ Exiting Ineffective Teachers D+ Digital Learning B- Graduation Rate Average Class Size Annual Cost Per Student 78.9% 14.56 $10,595 Supplemental Information (The following is provided solely for informative reasons. It does not influence the above grade or ranking.) 15.4% 46.0% 38.6% Funding Sources Federal Funds State Funds Local Funds
  • 95. www.alec.org 87 STATE SNAPSHOTS The Beehive State Utah NAEP Scores for Low-Income General Education Students (2003-2013) NAEP Low-Income General Education Student Score Distribution (2013) 252013 NAEP Performance Rank ALEC Historical Ranking 2009 NAEP: 42nd | 2011 NAEP: 41st Measures the overall scores for low-income general education students (non-ELL and non-IEP) and their gains/losses on the National Assessment of Educational Progress (NAEP) fourth- and eighth-grade reading and mathematics exams from 2003 to 2013. n States UT outperformed Education Policy Grade ALEC Historical Grading 2011: B | 2012: B- | 2013: B- Grades state-level education policies that provide high-quality educational options to all students. 0 25 50 75 100 At Proficient At Advanced At Basic Below Basic 4th-Grade Reading 8th-Grade Reading 4th-Grade Math 8th-Grade Math 3% 24% 39% 29% 49% 20% 32% 47% 15% 22% 46% 29%31% 0% 25% 50% 75% 100% 6% 2% 5% 4% 243 281 323 214 249 282 262 299 333 218 222 214 238 268 BASIC PROFICIENT ADVANCED 4th-Grade Reading 8th-Grade Reading 4th-Grade Math 8th-Grade Math 2003 2013 260 267 233 241 275 279 B- State Academic Standards A Charter Schools Charter Schools Allowed Yes Charter School Law Grade B Homeschool Regulation Burden (A=None, B=Low, C=Moderate, D=High) B Private School Choice Programs D Teacher Quality and Policies: Overall Grade C Delivering Well Prepared Teachers C- Expanding the Teaching Pool D+ Identifying Effective Teachers D+ Retaining Effective Teachers B- Exiting Ineffective Teachers B- Digital Learning A- Graduation Rate Average Class Size Annual Cost Per Student 78.6% 22.31 $7,584 Supplemental Information (The following is provided solely for informative reasons. It does not influence the above grade or ranking.) 12.1% 38.1% 49.8% Funding Sources Federal Funds State Funds Local Funds
  • 96. 88 Report Card on American Education 2014 STUDENT PERFORMANCE AND STATE EDUCATION POLICY GRADES INDEX The Green Mountain State Vermont NAEP Scores for Low-Income General Education Students (2003-2013) NAEP Low-Income General Education Student Score Distribution (2013) 32013 NAEP Performance Rank ALEC Historical Ranking 2009 NAEP: 1st | 2011 NAEP: 2nd Measures the overall scores for low-income general education students (non-ELL and non-IEP) and their gains/losses on the National Assessment of Educational Progress (NAEP) fourth- and eighth-grade reading and mathematics exams from 2003 to 2013. n States VT outperformed Education Policy Grade ALEC Historical Grading 2011: D+ | 2012: D+ | 2013: D+ Grades state-level education policies that provide high-quality educational options to all students. 0 25 50 75 100 At Proficient At Advanced At Basic Below Basic 4th-Grade Reading 8th-Grade Reading 4th-Grade Math 8th-Grade Math 3% 28% 41% 33% 49% 15% 37% 45% 12% 29% 50% 15%25% 0% 25% 50% 75% 100% 6% 3% 5% 6% 243 281 323 214 249 282 262 299 333 217 226 214 238 268 BASIC PROFICIENT ADVANCED 4th-Grade Reading 8th-Grade Reading 4th-Grade Math 8th-Grade Math 2003 2013 259 272 233 244 275 290 D+ State Academic Standards B- Charter Schools Charter Schools Allowed No Charter School Law Grade – Homeschool Regulation Burden (A=None, B=Low, C=Moderate, D=High) D Private School Choice Programs B Teacher Quality and Policies: Overall Grade D- Delivering Well Prepared Teachers C Expanding the Teaching Pool F Identifying Effective Teachers F Retaining Effective Teachers F Exiting Ineffective Teachers F Digital Learning D- Graduation Rate Average Class Size Annual Cost Per Student 91.4% 10.47 $17,317 Supplemental Information (The following is provided solely for informative reasons. It does not influence the above grade or ranking.) 7.1% 4.7% 88.2% Funding Sources Federal Funds State Funds Local Funds
  • 97. www.alec.org 89 STATE SNAPSHOTS The Old Dominion Virginia NAEP Scores for Low-Income General Education Students (2003-2013) NAEP Low-Income General Education Student Score Distribution (2013) 262013 NAEP Performance Rank ALEC Historical Ranking 2009 NAEP: 12th | 2011 NAEP: 26th Measures the overall scores for low-income general education students (non-ELL and non-IEP) and their gains/losses on the National Assessment of Educational Progress (NAEP) fourth- and eighth-grade reading and mathematics exams from 2003 to 2013. n States VA outperformed Education Policy Grade ALEC Historical Grading 2011: C- | 2012: C- | 2013: C- Grades state-level education policies that provide high-quality educational options to all students. 0 25 50 75 100 At Proficient At Advanced At Basic Below Basic 4th-Grade Reading 8th-Grade Reading 4th-Grade Math 8th-Grade Math 3% 23% 41% 21% 50% 29% 27% 53% 18% 18% 50% 30%31% 0% 25% 50% 75% 100% 4% 1% 2% 2% 243 281 323 214 249 282 262 299 333 207 221 214 238 268 BASIC PROFICIENT ADVANCED 4th-Grade Reading 8th-Grade Reading 4th-Grade Math 8th-Grade Math 2003 2013 255 258 227 235 265 277 C- State Academic Standards C+ Charter Schools Charter Schools Allowed Yes Charter School Law Grade F Homeschool Regulation Burden (A=None, B=Low, C=Moderate, D=High) C Private School Choice Programs D Teacher Quality and Policies: Overall Grade C+ Delivering Well Prepared Teachers B- Expanding the Teaching Pool C- Identifying Effective Teachers C- Retaining Effective Teachers B Exiting Ineffective Teachers C Digital Learning B Graduation Rate Average Class Size Annual Cost Per Student 81.2% 17.58 $11,527 Supplemental Information (The following is provided solely for informative reasons. It does not influence the above grade or ranking.) 9.9% 53.0% 37.1% Funding Sources Federal Funds State Funds Local Funds
  • 98. 90 Report Card on American Education 2014 STUDENT PERFORMANCE AND STATE EDUCATION POLICY GRADES INDEX The Evergreen State Washington NAEP Scores for Low-Income General Education Students (2003-2013) NAEP Low-Income General Education Student Score Distribution (2013) 82013 NAEP Performance Rank ALEC Historical Ranking 2009 NAEP: 16th | 2011 NAEP: 25th Measures the overall scores for low-income general education students (non-ELL and non-IEP) and their gains/losses on the National Assessment of Educational Progress (NAEP) fourth- and eighth-grade reading and mathematics exams from 2003 to 2013. n States WA outperformed Education Policy Grade ALEC Historical Grading 2011: C | 2012: C- | 2013: C Grades state-level education policies that provide high-quality educational options to all students. 0 25 50 75 100 At Proficient At Advanced At Basic Below Basic 4th-Grade Reading 8th-Grade Reading 4th-Grade Math 8th-Grade Math 3% 27% 42% 30% 49% 19% 36% 48% 12% 27% 45% 22%26% 0% 25% 50% 75% 100% 5% 2% 4% 6% 243 281 323 214 249 282 262 299 333 216 224 214 238 268 BASIC PROFICIENT ADVANCED 4th-Grade Reading 8th-Grade Reading 4th-Grade Math 8th-Grade Math 2003 2013 259 258 232 235 274 277 C State Academic Standards B Charter Schools Charter Schools Allowed Yes Charter School Law Grade C Homeschool Regulation Burden (A=None, B=Low, C=Moderate, D=High) C Private School Choice Programs F Teacher Quality and Policies: Overall Grade C- Delivering Well Prepared Teachers D+ Expanding the Teaching Pool C+ Identifying Effective Teachers C- Retaining Effective Teachers C- Exiting Ineffective Teachers C- Digital Learning B- Graduation Rate Average Class Size Annual Cost Per Student 77.2% 19.37 $11,329 Supplemental Information (The following is provided solely for informative reasons. It does not influence the above grade or ranking.) 11.6% 31.2% 57.2% Funding Sources Federal Funds State Funds Local Funds
  • 99. www.alec.org 91 STATE SNAPSHOTS The Mountain State West Virginia NAEP Scores for Low-Income General Education Students (2003-2013) NAEP Low-Income General Education Student Score Distribution (2013) 502013 NAEP Performance Rank ALEC Historical Ranking 2009 NAEP: 50th | 2011 NAEP: 51st Measures the overall scores for low-income general education students (non-ELL and non-IEP) and their gains/losses on the National Assessment of Educational Progress (NAEP) fourth- and eighth-grade reading and mathematics exams from 2003 to 2013. n States WV outperformed Education Policy Grade ALEC Historical Grading 2011: D+ | 2012: D+ | 2013: C- Grades state-level education policies that provide high-quality educational options to all students. 0 25 50 75 100 At Proficient At Advanced At Basic Below Basic 4th-Grade Reading 8th-Grade Reading 4th-Grade Math 8th-Grade Math 3% 24% 38% 20% 49% 30% 30% 49% 17% 15% 46% 37%34% 0% 25% 50% 75% 100% 4% 1% 3% 2% 243 281 323 214 249 282 262 299 333 215 219 214 238 268 BASIC PROFICIENT ADVANCED 4th-Grade Reading 8th-Grade Reading 4th-Grade Math 8th-Grade Math 2003 2013 257 257 229 238 268 271 C- State Academic Standards B Charter Schools Charter Schools Allowed No Charter School Law Grade – Homeschool Regulation Burden (A=None, B=Low, C=Moderate, D=High) C Private School Choice Programs F Teacher Quality and Policies: Overall Grade C- Delivering Well Prepared Teachers C+ Expanding the Teaching Pool D+ Identifying Effective Teachers D+ Retaining Effective Teachers D+ Exiting Ineffective Teachers C- Digital Learning B- Graduation Rate Average Class Size Annual Cost Per Student 78.3% 13.93 $12,280 Supplemental Information (The following is provided solely for informative reasons. It does not influence the above grade or ranking.) 14.7% 29.6% 55.6% Funding Sources Federal Funds State Funds Local Funds
  • 100. 92 Report Card on American Education 2014 STUDENT PERFORMANCE AND STATE EDUCATION POLICY GRADES INDEX America’s Dairyland Wisconsin NAEP Scores for Low-Income General Education Students (2003-2013) NAEP Low-Income General Education Student Score Distribution (2013) 152013 NAEP Performance Rank ALEC Historical Ranking 2009 NAEP: 21st | 2011 NAEP: 19th Measures the overall scores for low-income general education students (non-ELL and non-IEP) and their gains/losses on the National Assessment of Educational Progress (NAEP) fourth- and eighth-grade reading and mathematics exams from 2003 to 2013. n States WI outperformed Education Policy Grade ALEC Historical Grading 2011: B- | 2012: B- | 2013: C Grades state-level education policies that provide high-quality educational options to all students. 0 25 50 75 100 At Proficient At Advanced At Basic Below Basic 4th-Grade Reading 8th-Grade Reading 4th-Grade Math 8th-Grade Math 3% 22% 37% 26% 49% 23% 30% 48% 18% 25% 44% 26%37% 0% 25% 50% 75% 100% 4% 2% 5% 5% 243 281 323 214 249 282 262 299 333 212 217 214 238 268 BASIC PROFICIENT ADVANCED 4th-Grade Reading 8th-Grade Reading 4th-Grade Math 8th-Grade Math 2003 2013 253 264 227 238 266 282 B- State Academic Standards A Charter Schools Charter Schools Allowed Yes Charter School Law Grade C Homeschool Regulation Burden (A=None, B=Low, C=Moderate, D=High) B Private School Choice Programs A Teacher Quality and Policies: Overall Grade D+ Delivering Well Prepared Teachers C Expanding the Teaching Pool D- Identifying Effective Teachers C- Retaining Effective Teachers D Exiting Ineffective Teachers D- Digital Learning D Graduation Rate Average Class Size Annual Cost Per Student 91.1% 14.93 $13,197 Supplemental Information (The following is provided solely for informative reasons. It does not influence the above grade or ranking.) 8.8% 45.4% 45.8% Funding Sources Federal Funds State Funds Local Funds
  • 101. www.alec.org 93 STATE SNAPSHOTS The Equality State Wyoming NAEP Scores for Low-Income General Education Students (2003-2013) NAEP Low-Income General Education Student Score Distribution (2013) 212013 NAEP Performance Rank ALEC Historical Ranking 2011 NAEP: 23rd | 2009 NAEP: 28th Measures the overall scores for low-income general education students (non-ELL and non-IEP) and their gains/losses on the National Assessment of Educational Progress (NAEP) fourth- and eighth-grade reading and mathematics exams from 2003 to 2013. n States WY outperformed Education Policy Grade ALEC Historical Grading 2011: C+ | 2012: C | 2013: C- Grades state-level education policies that provide high-quality educational options to all students. 0 25 50 75 100 At Proficient At Advanced At Basic Below Basic 4th-Grade Reading 8th-Grade Reading 4th-Grade Math 8th-Grade Math 3% 25% 44% 30% 54% 15% 37% 49% 10% 27% 50% 19%27% 0% 25% 50% 75% 100% 4% 1% 4% 3% 243 281 323 214 249 282 262 299 333 221 223 214 238 268 BASIC PROFICIENT ADVANCED 4th-Grade Reading 8th-Grade Reading 4th-Grade Math 8th-Grade Math 2003 2013 264 269 238 243 280 285 D+ State Academic Standards C Charter Schools Charter Schools Allowed Yes Charter School Law Grade D Homeschool Regulation Burden (A=None, B=Low, C=Moderate, D=High) B Private School Choice Programs F Teacher Quality and Policies: Overall Grade D Delivering Well Prepared Teachers D- Expanding the Teaching Pool D- Identifying Effective Teachers D+ Retaining Effective Teachers D Exiting Ineffective Teachers D+ Digital Learning C- Graduation Rate Average Class Size Annual Cost Per Student 80.3% 12.3 $18,679 Supplemental Information (The following is provided solely for informative reasons. It does not influence the above grade or ranking.) 9.4% 37.2% 53.4% Funding Sources Federal Funds State Funds Local Funds
  • 102. 94 Report Card on American Education
  • 103. 4CHAPTER Cost Versus Outcomes – The Importance of Educational Efficiency
  • 104. 96 Report Card on American Education CHAPTER FOUR amount of money each year on education. Despite large variances in spending, it would be stretch to say even the most frugal education system is underfunded. For example, Idaho spends $7,408 per pupil, per year, while the lavish District of Columbia spends nearly 400 percent that amount—$29,427. Overall, there is more consistency in class sizes across the states, but these still range from the fewest average students per classroom in Ver- mont at 10.67 to California, with more than dou- ble that number of students in each classroom— just shy of 24. When average class size and per-pupil spending is put together, the true disparity of the numbers hits home. In North Carolina, a state with a fair- ly average classroom size of slightly more than 15 students, taxpayers invest $133,518 for each class- room of students. Compare this with the nation’s capital: Despite relatively small classroom sizes, the District of Columbia spends $378,137 for each classroom, each year. That astronomical expense would be a non-sto- ry if schools in DC had similarly astronomical stu- dent outcomes. Unfortunately, the reason Chapter 4 is dedicated to funding is because the opposite is true. Even though DC taxpayers spend nearly $30,000 on each student each year, student per- formance still remains near the bottom compared to the rest of the country. This is not to say DC stu- dents are not improving. In fact, DC has consis- tently been in the “Hall of Fame” for the “Most Improved” category. However, that distinction comes from recent years of student-centered Cost Versus Outcomes – The Importance of Educational Efficiency As discussed in Chapter 1, the United States spends a great amount on the public ed- ucation system. Yet for far too many students, that spending does not translate to academic proficiency. Significant numbers of stu- dents perform on par with many countries that spend a fraction of U.S. investment. Unfortunate- ly, underperforming students are often concen- trated in certain ethnicities—mainly black and Hispanic students. Sometimes, states set the highest annual per-pu- pil spending levels in areas with the most disad- vantaged student populations. For example, con- sider one of the wealthiest states in the country: New Jersey. Wide variations in per-pupil funding depend on geography. The much-beleaguered city of Newark has per-pupil funding of $24,281.1 This is in a city with a poverty rate of nearly 30 percent and a median household income of $33,960.2 De- spite this sky-high level of spending, fewer than half of Newark third-grade students are consid- ered literate.3 In nearby leafy Chatham, N.J., the poverty rate is well below 5 percent, yet that district spends $16,037 per-pupil each year—two-thirds of what Newark spends.4 5 To say Newark’s public schools are strapped for cash is hardly an honest state- ment. In fact, this is the same district that recent- ly received a $100 million donation from Facebook CEO Mark Zuckerberg. The problem in Newark is that the huge amount of money produces far too little. Chapter 3 outlines a whole host of statistics that address spending and class size in each state. Put together, the country spends an enormous
  • 105. www.alec.org 97 COST VERSUS OUTCOMES – THE IMPORTANCE OF EDUCATIONAL EFFICIENCY 2007.6 It is highly doubtful this massive increase was implemented in a targeted, strategic fashion. Instead, Wyoming gained the talking point of say- ing it increased its per-pupil funding by more than one-third in a single year. With the knowledge that implementation takes time, raising student achievement can take multi- ple years to accomplish. To account for that, one can examine student achievement on the fourth- and eighth-grade reading and mathematics NAEP in 2005, the year before this spending windfall oc- curred, and compare that against subsequent re- sults (2007, 2009, 2011 and 2013). Unsurprisingly, there are no statistically significant academic gains in any of the four exams. Flooding the system with money instead of using funds strategically to target programs that focus on student success has created a system that, as Figure 1 from Andrew Coulson at the Cato Insti- tute shows, has runaway inflation with stagnant student test scores. reforms, not extravagant spending. In fact, DC charter school students have far fewer resources devoted to their education but substantially out- perform DC district students. THE EXAMPLE OF WYOMING To answer those who might say, “But DC is an ex- pensive place to live, with an entirely urban pop- ulation. Of course spending will be higher,” one must take a look at a state nearly the opposite of the nation’s capital: Wyoming. Wyoming is fortunate in many regards. As a re- source-rich state, a large portion of educational funding comes from coal and natural gas revenue, which has been booming in recent years. However, past education leaders may have squandered that revenue. Under the false assumption that provid- ing more money to an education system would fix it, Wyoming effectively attempted to buy better student success without any significant policy re- forms. Wyoming’s per-pupil funding jumped more than $4,000 in a single year between 2006 and FIGURE 1 | INFLATION–ADJUSTED PER PUPIL SPENDING AND ACHIEVEMENT OF 17- YEAR-OLDS, PERCENTAGE CHANGE SINCE 1970 Cato Institute Data source (spending): National Center for Education Statistics, Digest of Education Statistics 2008, Table 181 Data sources (scores): National Assessment of Educational Progress, Long Term Trends reports. Prepared by: Andrew J. Coulson. Missing spending year spending values linearly interpolated or extrapolated Source: Cato Institute PrecentChangeSince1970 -­‐10%   10%   30%   50%   70%   90%   110%   130%   150%   1970   1974   1978   1982   1986   1990   1994   1998   2002   2006    Spending      Reading  Scores    Math  Scores    Science  Scores  
  • 106. 98 Report Card on American Education CHAPTER FOUR FIGURE 2 | INCREASES IN THE PUBLIC SCHOOL STAFF AND STUDENTS IN AMERICA SINCE 1970 Today, Wyoming spends nearly $18,500 for each student each year. (For a more detailed history of Wyoming’s spending habits, read the 17th edi- tion of ALEC’s Report Card on American Educa- tion.) That might be fine if students were receiving $18,500 worth of education each year. However, this does not seem to be the case; the gains of Wy- oming students on NAEP exams have proved unre- markable in recent years, despite the very large in- crease in per-pupil funding. This is not to pick on Wyoming, but instead to illus- trate inefficiencies built into a system that has be- come more responsive to the needs of its employ- ees than to those who the system was created to serve: students. A common argument that goes hand-in-hand with the need to increase school funding is the desire to shrink the size of classrooms. Class sizes dic- tate the size of the teaching force and thus play a strong role in driving the cost structure of educa- tion. As Figure 1 shows, the country has drastical- ly increased per-pupil funding. But as Figure 2 il- lustrates, that increase in funding has largely not gone to increase teaching staff in order to support smaller classes. Instead, non-teaching staff has in- creased at a rate twice that of teaching staff. This could perhaps be justified if there were clear ev- idence of substantially improved learning out- comes as a result of surrounding students with more and more adults. Unfortunately that evi- dence does not exist. Source: Heritage Foundation 138%   84%   60%   8%   Non-­‐teaching  workforce   increase   Total  staff  increase   Teaching  staff  increase   Students  
  • 107. www.alec.org 99 COST VERSUS OUTCOMES – THE IMPORTANCE OF EDUCATIONAL EFFICIENCY within the school system to prop up an unsustain- able model and has little to do with better educa- tion for students. In a recent survey by the Friedman Foundation for Educational Choice, fewer than 14 percent of Americans could estimate within a $4,000-range the correct per-pupil funding level.9 The majority of respondents who provided wrong estimates un- derestimated the amount, often significantly. Figure 5 brings Figure 4 into perspective by adding fourth-grade reading proficiency. This chart looks at the 2011 fourth-grade reading NAEP, which is graded on a zero to 500-point scale, and divides that by the total cumulative spending found in Fig- ure 3. This illustrates an average price per point for the NAEP exam for each of the 50 states and the District of Columbia. Consistent with other exami- nations of NAEP data throughout this Report Card, in order to increase comparability among states, this chart looks at low-income students who do not have an individualized education program and are not English language speakers. When comparing Utah with its neighbor Wyoming, Utah’s public school system appears twice as effi- cient on a per-reading-point basis in their elemen- tary schools. When comparing Idaho and Wyo- ming, Idaho public schools prove radically more efficient than those in Wyoming when measured on a per-point basis. These disparities would not be so large if Wyoming had increased the reading achievement of students as a result of increased spending, while neighboring states increased spending at a more modest pace. In the Midwest, Indiana proves the most efficient judged on a per-reading-point basis. The lag in the availability of financial data compelled the use of 2011 rather than 2013 NAEP data. However, Indi- ana’s gain on the NAEP fourth-grade reading test between 2011 and 2013 came in four-times larg- er than the national average, giving the state a big leg up in future measures. Indiana spent $171 per fourth-grade reading point, while Illinois spent $210 per point. Indiana has been racing ahead of EDUCATION EFFICIENCY Childhood literacy is the key to future learning.7 Unless students master the fundamental skills of reading and comprehension, they will find their subsequent courses out of reach. This not only leads to poor student outcomes down the line but also to various increased costs in other areas, such as incarceration and health care. For more infor- mation on the link between educational outcomes and health care, see the 16th edition of ALEC’s Re- port Card on American Education.8 For students in a growing number of states, includ- ing Nevada as discussed in Chapter 1, legislators are focusing on early-childhood literacy. Because of the importance of ensuring all students are lit- erate by fourth-grade, the following section exam- ines achievement of fourth-graders on the NAEP reading exam. Combined with the achievement in- formation is current education spending levels. Figure 3 shows how much each state spends on students through the end of fourth-grade. For this examination, students who were in the fourth- grade in 2011 were considered. This is the most re- cent complete set of data available. Then, fourth- grade spending levels for those students in 2011 were combined with 2010 third-grade spending levels and so on back to 2007 kindergarten spend- ing. This provides the cumulative investment spent to get a student through fourth-grade. Utah spends the least to get a student through fourth-grade, with New York at the other end of the spectrum spending the most, nearly triple the Utah expenditure. These spending levels alone, however, give an incomplete picture and must be combined with actual educational attainment. The information in Figure 3 that shows the price of investment in students from kindergarten through fourth-grade in each state would come as a shock to most people. With constant calls for more edu- cation spending, the narrative often heard in the media is that the education system is vastly un- derfunded. In reality, this rhetoric is used by those
  • 108. 100 Report Card on American Education CHAPTER FOUR FIGURE 3 | CUMULATIVE CURRENT SPENDING PER PUPIL FOR GRADES K, 1, 2, 3 AND 4 BY STATE, 2007-2011 Source: United States Census Bureau $72,994   $68,144   $65,572   $62,638   $60,729   $59,431   $58,902   $55,104   $54,760   $54,025   $51,008   $49,578   $49,158   $48,764   $47,958   $44,897   $44,549   $43,593   $42,986   $42,634   $42,550   $42,238   $42,019   $41,848   $41,181   $40,862   $38,830   $38,669   $38,544   $38,085   $38,044   $37,789   $37,584   $37,388   $36,961   $36,576   $35,750   $35,698   $35,667   $35,423   $35,374   $34,536   $34,277   $33,717   $33,304   $32,023   $31,789   $31,053   $30,935   $27,952   $24,397   0   10000   20000   30000   40000   50000   60000   70000   80000   New  York   District  of  Columbia   New  Jersey   Alaska   Vermont   Wyoming   ConnecHcut   MassachuseKs   Rhode  Island   Maryland   Pennsylvania   Delaware   New  Hampshire   Maine   Hawaii   Wisconsin   Illinois   West  Virginia   Ohio   Minnesota   Virginia   North  Dakota   Michigan   Louisiana   Nebraska   Montana   Kansas   Oregon   Iowa   Georgia     California   Missouri   Washington   Indiana   New  Mexico   South  Carolina   Arkansas   Kentucky   Alabama   Florida   Colorado   South  Dakota   Texas   Nevada   North  Carolina   Mississippi   Tennessee   Oklahoma   Arizona   Idaho   Utah   $0 $10,000 $20,000 $30,000 $40,000 $50,000 $60,000 $70,000 $80,000
  • 109. www.alec.org 101 COST VERSUS OUTCOMES – THE IMPORTANCE OF EDUCATIONAL EFFICIENCY national average. North Carolina came in second and Florida came in third in the region. In the Northeast, New Hampshire is the most ef- ficient state by our measure while Connecticut is the least efficient. Utah scores best in efficiency in the West and tripled the national average gain in fourth-grade reading between 2011 and 2013. the national average on NAEP fourth-grade read- ing scores, while the scores in Illinois have not budged since 2007. In the South, Tennessee comes in as the efficien- cy champion on a per-point basis, and the future looks bright for improvement. Tennessee’s state- wide improvement on NAEP fourth-grade read- ing scores between 2011 and 2013 (after this mea- surement) stood at five-times greater than the FIGURE 4 | GENERAL EDUCATION LOW-INCOME STUDENTS SCORING “PROFICIENT” OR BETTER ON THE TRIAL URBAN DISTRICT ASSESSMENT EIGHTH-GRADE READING, 2013 Source: Freidman Foundation for Educational Choice, 2015 Schooling in America Survey, Q7 How much do you think is spent per year on each student in our country’s public schools? Your estimate (to the nearest thousand dollars) will represent the combined expenditures of local, state and federal governments. (Percentage of All Responses, Percentage of School Parents) Less Then $4,000 $4,000 – 8,000 $8,001 – 12,000 $12,001 – 16,000 Over $16,000 21% 23% 14% 7% 12% ALL RESPONSES SCHOOL PARENT RESPONSES 23% 24% 14% 6% 13%
  • 110. 102 Report Card on American Education CHAPTER FOUR FIGURE 5 | CUMULATIVE CURRENT SPENDING 2007-11 (K-4) PER POINT ON THE 2011 NAEP FOURTH-GRADE READING EXAM FOR GENERAL EDUCATION LOW-INCOME CHILDREN Source: United States Census Bureau $342   $328   $298   $294   $273   $272   $267   $250   $249   $244   $232   $227   $226   $222   $219   $210   $208   $205   $199   $199   $199   $197   $196   $192   $188   $186   $179   $179   $177   $177   $177   $176   $175   $174   $173   $171   $167   $166   $164   $160   $160   $159   $159   $158   $156   $153   $152   $145   $143   $127   $112   $0   $50   $100   $150   $200   $250   $300   $350   $400   District  of  Columbia   New  York   New  Jersey   Alaska   ConnecDcut   Vermont   Wyoming   Maryland   Rhode  Island   MassachuseMs   Pennsylvania   Hawaii   Delaware   Maine   New  Hampshire   Illinois   Wisconsin   West  Virginia   Louisiana   Michigan   Ohio   Virginia   Minnesota   North  Dakota   Nebraska   Montana   California   Georgia   Iowa   Missouri   Oregon   New  Mexico   Kansas   South  Carolina   Washington   Indiana   Alabama   Arkansas   Kentucky   Colorado   South  Dakota   Florida   Texas   Nevada   Mississippi   North  Carolina   Tennessee   Arizona   Oklahoma   Idaho   Utah  
  • 111. www.alec.org 103 COST VERSUS OUTCOMES – THE IMPORTANCE OF EDUCATIONAL EFFICIENCY Every state has a significant segment of low-in- come students, and the education system is one of the greatest tools available to lift up all students to get out of “low-income” status. However, schools are failing to help these students. Washington, DC deserves to be in the “hall of shame” for sky-high student spending combined with extremely low proficiency rates. As a whole, New York spends well above $70,000 to get a child through fourth grade. But for $15,000 less, its neighbor Massachusetts, which has a similarly expensive cost of living, gets better results. State education policies matter. Since state policies af- fect student achievement, Report Card on Ameri- can Education has always focused on the need for states to craft education policies that put students at the center of the education system. MISMANAGED RESOURCES Philadelphia has a large low-income population, a low high school graduation rate and a severely mismanaged budget. Recent articles have lament- ed the lack of resources available in the district.10 Reports point to the lack of resources available directly to teachers, such as access to textbooks within a classroom. This is not to say the resourc- es do not exist. To put it more bluntly, there is no reason why a district that spends $20,173 per stu- dent should not be able to provide the basics to students.11 In fact, Philadelphia has thousands of unused books.12 Sitting in the basement of the Philadel- phia School District’s main office are thousands of new books that were consolidated when mul- tiple schools were closed a few years ago. Keeping these resources out of reach of teachers and stu- dents in a school district that has nearly 60 percent of students reading below grade level is a tragedy. These are not poor school districts. These are wealthy districts that are poorly managed to the detriment of students from low-income households. PUTTING STUDENTS ABOVE MONEY Throughout the past several editions of this Re- port Card on American Education, the focus has been on low-income students. High-income stu- dents have distinct advantages, including easier access to private schools and the ability to “buy” a better public education by moving to a better dis- trict, which is typically out of the monetary reach of those most in need. Those who are most harmed by inefficiencies are the low-income students who are depending on their school to provide them with a high-quality education. The low-income students in Philadel- phia and across the country are trapped in poor- performing schools that are wasting money and setting students up for failure. There have been extreme variations in not just student funding, but in how well that funding is used for educating students. If states, districts and schools are able to provide a better education by better using what is being spent on students now, they have a responsibility to do so. They owe it to those who are funding the system with a not-so- trivial amount of money. But most important, they owe it to students.
  • 112. 104 Report Card on American Education CHAPTER FOUR ENDNOTES 1. O’Dea, Colleen, “Interactive Map: Per-Pupil Costs Vary Widely in New Jersey’s Schools.” May 16, 2014 http://www. njspotlight.com/stories/14/05/15/per-pupil-school-spending/ 2. United States Census Bureau. State & County QuickFacts. Accessed July 2015. http://quickfacts.census.gov/qfd/ states/34/3451000.html 3. City of Newark, NJ’s “Read and Believe” initiative. http://www.ci.newark.nj.us/readbelieve/ 4. This looks at both Chatham Township and Chatham Burrough, which jointly run the School District of the Chathams. Sources for poverty are from http://www.census.gov/quickfacts/table/PST045214/3412100,3402712130,00 5. Ibid 6. Wyoming’s per-pupil revenue for years 2006 – 2007. Total revenue rose from $13,328.93 in 2006 to $17,351.79 in 2007. http://www.governing.com/gov-data/education-data/state-education-spending-per-pupil-data.html 7. “Early Warning! Why Reading by the End of Third Grade Matters” Annie E. Casey Foundation http://www.aecf.org/ resources/early-warning-why-reading-by-the-end-of-third-grade-matters/ 8. Ladner, Matthew, Andrew LeFevre, and Dan Lips. Report Card on American Education, American Legislative Exchange Council http://www.alec.org/publications/report-card-on-american-education/ 9. DiPerna, Paul and Brian Gottlob. The Friedman Foundation for Educational Choice. 2015 Schooling in America Survey http://www.edchoice.org/research/2015-schooling-in-america-survey/ 10. Broussard, Meredith. “Why Poor Schools Can’t Win at Standardized Testing” The Atlantic. July 15, 2014 http://www. theatlantic.com/features/archive/2014/07/why-poor-schools-cant-win-at-standardized-testing/374287/ 11. openPAgov.org, School Spending http://www.openpagov.org/education_revenue_and_expenses.asp 12. Newall, Mike. “In cash-strapped School District, a hidden treasure trove of books.” Philadelphia Inquirer http://articles. philly.com/2015-03-19/news/60254454_1_science-books-many-city-teachers-philadelphia-school-district
  • 113. www.alec.org 105 COST VERSUS OUTCOMES – THE IMPORTANCE OF EDUCATIONAL EFFICIENCY
  • 114. 106 Report Card on American Education APPENDIX A | CHANGE IN NAEP SCORES FOR ALL STUDENTS CHANGE IN NAEP SCORES FOR ALL STUDENTS FROM 2003 TO 2013 (Non-IEP, Non-ELL) Average scores Jurisdiction Change in Fourth-Grade Reading Scores Change in Fourth-Grade Math Scores Alabama 11 10 Alaska -2 3 Arizona 4 11 Arkansas 5 11 California 7 7 Colorado 3 12 Connecticut 1 2 Delaware 2 7 District of Columbia 17 24 Florida 9 8 Georgia 8 10 Hawaii 7 16 Idaho 1 6 Illinois 2 6 Indiana 5 11 Iowa 1 8 Kansas 3 4 Kentucky 5 12 Louisiana 6 5 Maine 1 8 Maryland 13 12 Massachusetts 5 11 Michigan -1 1 Minnesota 4 11 Mississippi 3 8 Missouri 0 5 Montana 0 8 National Average 4 7 Nebraska 3 7 Nevada 7 8 New Hampshire 4 10 New Jersey 4 8 New Mexico 3 10 New York 2 4 North Carolina 1 3 North Dakota 2 8 Ohio 2 8 Oklahoma 3 10 Oregon 2 4 Pennsylvania 8 8 Rhode Island 6 11 South Carolina -1 1 South Dakota -4 4 Tennessee 8 12 Texas 2 5 Utah 4 8 Vermont 2 6 Virginia 5 7 Washington 4 8 West Virginia -5 6 Wisconsin 0 8 Wyoming 4 6
  • 115. www.alec.org 107 Jurisdiction Change in Eighth-Grade Reading Scores Change in Eighth-Grade Math Scores Alabama 4 7 Alaska 5 3 Arizona 5 9 Arkansas 4 12 California 11 9 Colorado 3 7 Connecticut 7 1 Delaware 1 5 District of Columbia 9 22 Florida 9 10 Georgia 7 9 Hawaii 9 15 Idaho 6 6 Illinois 1 8 Indiana 2 7 Iowa 1 1 Kansas 1 6 Kentucky 4 7 Louisiana 4 7 Maine 1 7 Maryland 12 9 Massachusetts 4 14 Michigan 2 4 Minnesota 3 4 Mississippi -2 10 Missouri 0 4 Montana 2 3 National Average 5 7 Nebraska 3 3 Nevada 10 10 New Hampshire 3 10 New Jersey 8 15 New Mexico 4 10 New York 1 2 North Carolina 3 5 North Dakota -2 4 Ohio 2 8 Oklahoma 0 4 Oregon 4 3 Pennsylvania 8 11 Rhode Island 6 12 South Carolina 3 3 South Dakota -2 2 Tennessee 7 10 Texas 5 11 Utah 6 3 Vermont 3 9 Virginia 0 6 Washington 8 9 West Virginia -3 3 Wisconsin 2 5 Wyoming 4 4
  • 116. 108 Report Card on American Education APPENDIX B | EDUCATION POLICY GRADE COMPONENTS Jurisdiction State Academic Standards Charter School Law Charter School Grade Homeschool Regulation Burden Private School Choice Programs Alabama F N – B C Alaska D+ Y D A F Arizona C Y A B A Arkansas D Y D C B California C+ Y B B F Colorado B Y B C F Connecticut C- Y D A F Delaware C Y C B F District of Columbia C Y A C D Florida B Y B C A Georgia F Y C B B Hawaii C Y C C F Idaho D Y B A F Illinois B- Y C A C Indiana C- Y A A A Iowa C Y D A C Kansas D+ Y F B D Kentucky A N – B F Louisiana D Y C C A Maine C+ Y C C C Maryland C Y F C F Massachusetts A Y C D F Michigan B Y A A F Minnesota B- Y A C C Mississippi C- Y D B B Missouri A Y B A F Montana C N – B D Nebraska C N – B F Nevada C+ Y C B A New Hampshire C+ Y D C D New Jersey B- Y C A F New Mexico B- Y C B F New York A Y B D F North Carolina A Y C C B North Dakota C N – C F Ohio C- Y C C A Oklahoma D Y C A A Oregon C Y C C F Pennsylvania A Y C D D Rhode Island C+ Y D D D South Carolina D+ Y B C D South Dakota C N – C F Tennessee A Y C C C Texas C- Y C A F Utah A Y B B D Vermont B- N – D B Virginia C+ Y F C D Washington B Y C C F West Virginia B N – C F Wisconsin A Y C B A Wyoming C Y D B F EDUCATION POLICY GRADE COMPONENTS
  • 117. www.alec.org 109 Jurisdiction Overall Teacher Quality and Policies Grade Digital Learning Grade Alabama D D- Alaska D D+ Arizona C- C+ Arkansas B- C California D+ D- Colorado C+ D+ Connecticut B- F Delaware C+ D- District of Columbia D+ – Florida B+ A- Georgia B- B Hawaii D+ D Idaho D+ C Illinois C+ D- Indiana B- B- Iowa D D Kansas D B- Kentucky C D Louisiana B B- Maine C- C Maryland D+ C Massachusetts B- D+ Michigan B- C Minnesota C- B+ Mississippi C D- Missouri C- D+ Montana F F Nebraska D- F Nevada C- B+ New Hampshire D D New Jersey B- D- New Mexico D+ C New York B- D- North Carolina C C North Dakota D F Ohio B- D Oklahoma B- C+ Oregon D C Pennsylvania C- D Rhode Island B C South Carolina C- B- South Dakota D- C Tennessee B F Texas C- B- Utah C A- Vermont D- D- Virginia C+ B Washington C- B- West Virginia C- B- Wisconsin D+ D Wyoming D C-
  • 118. 110 Report Card on American Education APPENDICES Issue Areas: CIVIL JUSTICE • Civil Liability Predictability • Fairness in Damages • Discouraging Lawsuit Abuse COMMERCE, INSURANCE AND ECONOMIC DEVELOPMENT • Limiting Government Mandates on Business • Transportation and Infrastructure • Employee Rights and Freedoms COMMUNICATIONS AND TECHNOLOGY • Broadband Deployment • Consumer Privacy • E-Commerce EDUCATION AND WORKFORCE DEVELOPMENT • Education Reform • Parental Choice • Efficiency, Accountability and Transparency ENERGY, ENVIRONMENT AND AGRICULTURE • Energy Affordability and Reliability • Regulatory Reform • Agriculture and Land Use HEALTH AND HUMAN SERVICES • Pro-Patient, Free-Market Health Policy • Private and Public Health Insurance • Federal Health Reform INTERNATIONAL RELATIONS AND FEDERALISM • International Trade • Intellectual Property Rights Protection • Federalism JUSTICE PERFORMANCE PROJECT • Recidivism Reduction • Overcriminalization • Data-Driven Criminal Justice Reform TAX AND FISCAL POLICY • Pro-Growth Tax Reform • Priority-Based Budgeting • Pension Reform About the American Legislative Exchange Council The American Legislative Exchange Council (ALEC) is America’s largest nonpartisan, voluntary mem- bership organization of state legislators. ALEC provides a unique opportunity for state lawmak- ers, business leaders and citizen organizations from around the country to share experienc- es and develop statebased, pro-growth models based on academic research, existing state pol- icy and proven business practices. The ultimate goal of ALEC is to help state lawmakers make gov- ernment work more efficiently and move gov- ernment closer to the communities they serve, thereby creating opportunity for all Americans. In state legislatures around the country, citizen groups foster ideas, participate in discussions and provide their points of view to lawmakers. This process is an important part of American democracy. ALEC and its nine task forces closely imitate the state legislative process: Resolutions are intro- duced and assigned to an appropriate task force based on subject and scope; meetings are con- ducted where experts present facts and opinion for discussion, just as they would in committee hearings; these discussions are followed by a vote. ALEC task forces serve as testing grounds to judge whether resolutions can achieve consensus and enough support to survive the legislative process in a state capitol. All adopted model policies are published at www.alec.org to promote increased education and the open exchange of ideas across America.