Seq2seq Model introduction with practicing hands on coding.pdf
0 likes25 views

seq2seq and transformer architectures introduction


![Multi-head-attention
• Attention mechanism:
• Select more useful information from words.
• Q, K and V are obtained by applying a linear transformation to the input word
vector x. (token 經過 word embedding 之後就是 x)
• Each matrix W can be learned through training.
14
Q: Information to be queried
K: Vectors being queried
V: Values obtained from the query
(多頭的意思,想像成 CNN 中多個卷積核的作用(抓取特徵值) => 【多個注意力】機制
RNN 難以學到遠距離的依賴關係,因此需要導入 attention 機制。
1. how are you 經過 Q·
Kᵀ 之後為注意力分數 [0.8, 1.2, -0.4] ,再透過 softmax 為 [0.31,
0.52, 0.17] ,這表示how應該要關注的字詞為 are 因為有 52%
2. 接下來 how 這個詞 [0.31 ·
vhow+0.52 ·
vare+0.17 ·
vyou],這會有 768維
3. 三個字詞算完,一共有 [3x768] 進入 Layer Norm](https://image.slidesharecdn.com/seq2seqmodel-250504135505-a6930420/85/Seq2seq-Model-introduction-with-practicing-hands-on-coding-pdf-14-320.jpg)

![• Bidirectional Encoder Representations from Transformers
• 使用 Encoder 進行編碼,採用 self-attention 機制在編碼 token 同時考慮上下
文的 token,上下文的意思就是雙向的意思 (bidirectional)
• 採用 Self-Attention多頭機制提取全面性信息
• 採用猜字的方式進行學習,稱為 Masked Language Model (MLM) ,以 Cross
entropy 計算損失,以達到模型收斂效果
• 使用 Transformer 的 Encoder 進行特徵提取,可說 Encoder 就是 BERT模型
16
當訓練的時候,雙向的意思就是 => 透過 MASK,會同時看到【今天天氣】 [MASK] 【,我想吃冰淇淋】
當預測字詞【很】的時候,雙向的意思就是 => 會同時看到【我今天】 【開心】
Transformer Models (BERT)
Encoder-only
處理「這部電影會很好看,結果非常無聊」時,它同時看到整句的前後文,知道「非常無聊」才是真正的情緒,
不會被「很好看」這個片段誤導。 pytorch_bert.ipynb](https://image.slidesharecdn.com/seq2seqmodel-250504135505-a6930420/85/Seq2seq-Model-introduction-with-practicing-hands-on-coding-pdf-16-320.jpg)


Ad
More Related Content
Similar to Seq2seq Model introduction with practicing hands on coding.pdf (20)
More from FEG (20)


Ad
Recently uploaded (19)


Ad
Seq2seq Model introduction with practicing hands on coding.pdf
- 2. About me 2 • Education • NCU (MIS)、NCCU (CS) • Experiences • Telecom big data Innovation • Retail Media Network (RMN) • Customer Data Platform (CDP) • Know-your-customer (KYC) • Digital Transformation • LLM Architecture & Development • Research • Data Ops (ML Ops) • Generative AI research • Business Data Analysis, AI
- 3. Tutorial Content 3 Homework Transformer 三種架構 • 理解與生成機制 • RNN 問題 (梯度消失/爆炸) • (非序列資料) VAE 應用,如推薦系統 Seq2seq 架構 • Encoder-only (BERT model) • Decoder-only (GPT model) • Encoder-decoder (T5, BART model)
- 4. Code • Sample code • https://drive.google.com/drive/folders/1wEdGUZbqvmVNwS8AtsO5hXODpK Dn6Qk3?usp=sharing 4
- 5. Seq2seq (文字序列應用案例) • 輸入:我今天想吃拉麵 • Encoder: • 【理解】你在說什麼,它會先讀完整段話,形成一個內部的語意理解 • Decoder: • 根據理解回答你,像是一步一步【生成】:我知道附近哪裡有拉麵店! 5
- 6. Seq2seq (結合2個RNN) 6 用來處理序列轉換任務,例如: 【機器翻譯、對話系統、文本摘要】 利用 RNN 的架構進行逐一讀入,將【理解】轉換成 hidden state ,輸出一個壓縮過的語意向量 接收字詞的輸入與來自 Encoder 的 hidden state,這樣 才能正確地翻譯並【生成】對應的輸出序列 壓 縮
- 7. • 仍然有梯度的問題 • 【長文本】容易在 encoder 階段被【遺忘】,導致 decoder 無法生成【對齊 語意】 • 遺忘機制在實務上效果還是有限,有可能【錯判】資訊的重要性 • Decoder 階段是序列式生成字詞一步接一步 (greedy/ beam search),屬於 【自回歸生成】,這限制了整體語意【上下文】掌握能力 • RNN 為【時間步依賴 (Time step)】結構 (一步接一步),無法【平行】運算 • LSTM/GRU 屬於單層或少數層推疊,很難表現出語意、語法等多層次結構 7 因為不斷學習每一個字詞,然後再遺忘,避免訓練階段梯度爆炸 當輸入序列太長時,誤差反向傳播回去會發生:計算後的梯度會被不斷縮小 (梯度消失) 或 梯度被不斷放大 (梯度爆炸) Seq2seq (結合2個RNN)
- 8. • 可視為 seq2seq 的一種特殊形式,但它的輸出目標是輸入本身, 不是【序列】資料 • 採用機率空間 (latent space) 的 encoder-decoder 架構,並不是 為了解碼語言,而是為了學習一個隱變量生成模型 • 模型學會使用者對物品偏好的【隱藏分佈】,然後透過這個潛在 向量來生成對其他物品的預測分佈 8 加入了 latent space 的機率分布假設 (通常是高斯分布),使模型可以學到更平滑、更有泛化能力的隱變量空間 Seq2seq (非序列資料) VAE (Variational Autoencoders)
- 9. • 與 seq2seq 相同處 • 與 seq2seq 不同處 9 特點 說明 Encoder-Decoder 架構 都具有 【輸入】=> 【壓縮】 => 【輸出】 隱藏空間 (Latent space) 將輸入資料轉為某種內部表示,再生成輸出 用於生成任務 都可以用來產生某種輸出,如: 句子、推薦分數 特點 VAE Seq2seq 中間的 latent 表示 機率分佈 (有 μ, σ) + 抽樣機制 單一 hidden state 向量 學習目標 (計算損失) 最大化 KL + 重建損失 生成與實際的 Cross entropy 應用範圍 壓縮、生成、推薦、圖像重建 機器翻譯、對話、摘要 VAE 中使用 KL 散度將 latent space 正則化為標準常態 N(0,1) 目的就是每個使用者評分高低會有不同 Seq2seq (非序列資料) VAE (Variational Autoencoders)
- 10. • 輸入: • 五個使用者對於十個物品評分,有些物品是空的 (表示沒評分) • Encoder (編碼使用者偏好分佈): • 將這個稀疏的評分向量轉為潛在空間 Z ~ N (μ, σ²) • Decoder (重建完整評分向量): • 將 Z 表徵傳回 decoder,產生對所有物品的預測分數 • Loss 計算: • 重建損失,已知評分 vs 預測評分 • KL 散度損失: 讓潛在空間 (使用者的Z 表徵) 接近標準常態分佈 10 (Z 表徵為使用者個人偏好) • 標準常態分佈(平均值為 0,變異數為 1) • 一般常態分佈 (平均值為 μ,變異數為 σ² ) VAE.ipynb VAE_encoder_Z.ipynb MSE(x_hat, x) 衡量每位使用者的 μ 與 σ 距離標準常態分佈有多遠,距離越遠就要大幅調乘權重參數 Seq2seq (非序列資料) VAE (Variational Autoencoders)
- 11. Transformer Models • They are a more recent and highly effective architecture for sequence modeling. • They move away from recurrence and rely on a self-attention mechanism to process sequences in parallel and capture long-term dependencies in data, making them more efficient than traditional RNNs. • Self-attention mechanisms to weight the importance of different parts of input data. • They have been particularly successful in NLP tasks and have led to models like BERT, GPT, and others. 11
- 12. • In the paper Attention is all you need (2017). • It abandons traditional CNNs and RNNs. • It includes Encoder and Decoder. 12 https://arxiv.org/abs/1706.03762 由多層的編碼器/解碼器堆疊而成,每層包含 Multi-head Self-Attention、LayerNorm、前饋神經網 路(FFN)、殘差連接(Residual) 等模組,整體架構是可微分的,並透過 反向傳播 (Backpropagation) 進行訓練 Q: 來自於 Decoder 的輸入 K,V: 來自於 Encoder 的輸出 (4x768) 類似 BERT GPT GPT不靠時間步方式, 以 Tokens + PE 方式以 attention 機制來生成 ChatGPT屬於那種? Transformer Models RNN與GPT都採用自回歸方式生成
- 13. • How are you? • 你好嗎? Tokenizer <CLS> “How” “are” “you” “?” <SEP> Vocabulary How 1 are 10 you 300 ? 4 Word to index mapping d=768 Add PE (Positional Encoding) Multi-Head- Attention (HMA) In parallel Feed Forward Residual Connection N O R M Residual Connection N O R M Block Block Block context vectors BERT 的模型約有 30,000個 tokens,這些常用的詞、詞根、 子詞(subword) 編上編號 embedding 逐元素相加: 這樣模型就知道哪些詞 是出現在前面、哪些在 後面,才能理解語序 BERT 有 12 個 Block,BERT Large 有 24 個 Block 用 sin 和 cos 波形來表示不同位置,奇數用 cos,偶數用 sin; 每個位置 pos 對應一組固定向量 機器翻譯 計算的方向 Transformer Models Encoder 階段 何謂 Token?
- 14. Multi-head-attention • Attention mechanism: • Select more useful information from words. • Q, K and V are obtained by applying a linear transformation to the input word vector x. (token 經過 word embedding 之後就是 x) • Each matrix W can be learned through training. 14 Q: Information to be queried K: Vectors being queried V: Values obtained from the query (多頭的意思,想像成 CNN 中多個卷積核的作用(抓取特徵值) => 【多個注意力】機制 RNN 難以學到遠距離的依賴關係,因此需要導入 attention 機制。 1. how are you 經過 Q· Kᵀ 之後為注意力分數 [0.8, 1.2, -0.4] ,再透過 softmax 為 [0.31, 0.52, 0.17] ,這表示how應該要關注的字詞為 are 因為有 52% 2. 接下來 how 這個詞 [0.31 · vhow+0.52 · vare+0.17 · vyou],這會有 768維 3. 三個字詞算完,一共有 [3x768] 進入 Layer Norm
- 15. 15 模型透過 Self-Attention 機制,在這 128K 的 token 中動態找出: • 哪些字詞 (Tokens) 彼此有關係 • 哪些部分該被【關注】 • 哪些可忽略 Multi-head-attention 1. 每個 token 的向量會分別經過三個矩陣變換,產生 Q, K, V 2. 利用 Q 與所有 K 的內積來計算關聯分數,再經 softmax 得到注意力分數 (機率) 3. 權重越高,表示模型對該 token 給予越高的注意力
- 16. • Bidirectional Encoder Representations from Transformers • 使用 Encoder 進行編碼,採用 self-attention 機制在編碼 token 同時考慮上下 文的 token,上下文的意思就是雙向的意思 (bidirectional) • 採用 Self-Attention多頭機制提取全面性信息 • 採用猜字的方式進行學習,稱為 Masked Language Model (MLM) ,以 Cross entropy 計算損失,以達到模型收斂效果 • 使用 Transformer 的 Encoder 進行特徵提取,可說 Encoder 就是 BERT模型 16 當訓練的時候,雙向的意思就是 => 透過 MASK,會同時看到【今天天氣】 [MASK] 【,我想吃冰淇淋】 當預測字詞【很】的時候,雙向的意思就是 => 會同時看到【我今天】 【開心】 Transformer Models (BERT) Encoder-only 處理「這部電影會很好看,結果非常無聊」時,它同時看到整句的前後文,知道「非常無聊」才是真正的情緒, 不會被「很好看」這個片段誤導。 pytorch_bert.ipynb
- 17. 17 Context Vector (K,V) B O S 你 好 嗎 你 好 嗎 ? max max max max 你 0.8 好 0 嗎 0.1 … … END 0 ? E N D max Add PE Masked MHA Cross Attention Feed Forward 你 1 好 0 嗎 0 … … … 0 Ground truth Minimize cross entropy Embedding 1. 剛開始進行模型訓練時,QKV 參數都是隨機值,剛開始的關注詞根本不具參考性 2. 每做完一次訓練就是 (FFN + Backward),根據 Loss 的結果進行 Backward 3. 更新 QKV 讓 attention 的分數越來越有判斷力 pytorch_transformer.ipynb (Token-level loss) 1. 透過 Encoder 的 Context Vector (K,V ) 2. 生成第一個字詞:你 (softmax(Linear(Context Vector))) 3. 將字詞:你,作為Q,進行KV查表後,生成字詞:好… 如果沒有 Context Vector 輸入, 稱為 Decoder-only 模型,例如: ChatGPT 該模型為 Causal Masking 方式: 整合 QA pairs 問 題資料集為一個欄位,一起訓練 只看過去字詞(tokens),遮住未來字詞(tokens) Helsinki-NLP/opus-mt-zh-en ·Hugging Face Transformer Models Decoder 階段 當它看到「我以為這部電影會很好看,結果」, 它只能依靠前面的字猜「接下來會說什麼」, 所以「非常無聊」這個反轉情緒,它是之後才看到的,不能提前感知 機器翻譯
- 18. 補充: 執行 pytorch_transformer.ipynb 需要算力 18
- 19. HuggingFace LLM models • Model card: • https://huggingface.co/TheBloke/Llama-2-7B-Chat-fp16 • 何謂預訓練模型 ? 如何啟動本地端模型? • 了解訓練資料集、建模、評估、推論 • 下一步 ? 19 hf_pytorch_pretrain_gpt.ipynb https://ollama.com
- 20. Homework • 改寫 HW03.ipynb,將生活居家.csv 與 彩妝保養.csv 進行分類 • 輸入「簡單的外型設計,香氣清新」 • 得到「生活居家」 分類結果 20
- 21. • 將 pytorch_transformer.ipynb 修改為中文輸入,注音符號輸出 • 將中文字轉注音,例如 pypinyin + 注音對應表 • 台灣教育部標準注音字表或萌典API 抓取 • Base model 改為 t5-small 或 facebook/mbart-large-50 21 挑戰
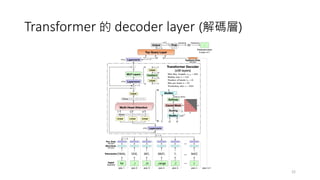
- 22. Transformer 的 decoder layer (解碼層) 22