


![ Using DMVs
◦ sys.dm_exec_query_stats
◦ Run the following query to get the TOP 25 completed
queries that are consuming the most cumulative CPU
SELECT highest_cpu_queries.plan_handle,
(highest_cpu_queries.total_worker_time/highest_cpu_queries.execution_count) AS
AverageCPU, highest_cpu_queries.execution_count,
highest_cpu_queries.total_worker_time, highest_cpu_queries.plan_generation_num,
highest_cpu_queries.creation_time, highest_cpu_queries.last_execution_time,
highest_cpu_queries.last_physical_reads, highest_cpu_queries.min_physical_reads,
q.dbid, q.objectid, q.number, q.encrypted, q.[text]
FROM (SELECT TOP 25 qs.plan_handle, qs.total_worker_time, qs.last_execution_time,
qs.plan_generation_num, qs.creation_time, qs.execution_count, qs.last_physical_reads,
qs.min_physical_reads FROM sys.dm_exec_query_stats qs
ORDER BY qs.total_worker_time DESC) AS highest_cpu_queries
CROSS APPLY sys.dm_exec_sql_text(plan_handle) AS q
ORDER BY AverageCPU DESC](https://image.slidesharecdn.com/sqlserverperformancetuning-180730224531/85/Sql-server-performance-tuning-12-320.jpg)


Ad
More Related Content
What's hot (20)
Similar to Sql server performance tuning (20)


Ad
Recently uploaded (20)


Ad
Sql server performance tuning
- 2. I have 14 plus years of IT experience and I have worked on different kinds of roles like Manager, Solution Architect, DBA, Developer and Software engineer. I have worked on many database technologies which includes SQL Server, MySQL, PostgreSQL, AWS Redshift, AWS Aurora, MariaDB, AWS RDS and cloud technologies. I received the MVP award in SQL Server (2010, 2011, 2012 and 2013) by Microsoft and trend setter award from MSSQLTips.com
- 3. Most common cause of performance problems SQL Server/Database Configuration Issues Database/table/schema Design Issues Wait Statistics CPU/IO/Memory Bottleneck Blocking Bottleneck Network Bottleneck Wait Statistics Poor Indexing Strategy Out-of-date/missing statistics Application Code T-SQL Code
- 4. DMVs: Dynamic management views and functions return server state information that can be used to monitor the health of a server instance, diagnose problems, and tune performance. Performance Monitor: This tool is available as part of the Windows® operating system. SQL Server Profiler: See SQL Server Profiler in the Performance Tools group in the SQL Server 2008 program group. DBCC commands: DBCC statements that act as Database Console Commands for SQL Server SSMS: SQL Server Management Studio
- 5. Separate AD Service account with the least privilege for SQL Server Services Configure antivirus software to skip LDF/MDF/NDF files Configure the minimum, max memory and lock pages in memory local policy Tweak the model database to setup best practice across all the databases TempDB configuration Configure AWE and PAE for 32-bit system Set the Page File in C: 2GB Configure the default SQL Server Settings
- 6. Normalization Use the Constraints while DB Design Auto Update/Create Statistics Auto Shrink should be turned off Set the Auto Growth option Files and File groups Database Maintenance Excessive Sorting Operations Excessive RID Lookups performed on heap tables Key lookups against the clustering keys look like joins however they are marked as “lookups” only in the XML showplan.
- 7. One of the first items that I check, when troubleshooting performance problems on a SQL Server, is the wait statistics, which are tracked by the SQLOS during normal operations of any SQL Server SELECT TOP 10 wait_type , max_wait_time_ms wait_time_ms , signal_wait_time_ms , wait_time_ms - signal_wait_time_ms AS resource_wait_time_ms , 100.0 * wait_time_ms / SUM(wait_time_ms) OVER ( ) AS percent_total_waits , 100.0 * signal_wait_time_ms / SUM(signal_wait_time_ms) OVER ( ) AS percent_total_signal_waits , 100.0 * ( wait_time_ms - signal_wait_time_ms ) / SUM(wait_time_ms) OVER ( ) AS percent_total_resource_waits FROM sys.dm_os_wait_stats WHERE wait_time_ms > 0 -- remove zero wait_time AND wait_type NOT IN -- filter out additional irrelevant waits ( 'SLEEP_TASK', 'BROKER_TASK_STOP', 'BROKER_TO_FLUSH', 'SQLTRACE_BUFFER_FLUSH','CLR_AUTO_EVENT', 'CLR_MANUAL_EVENT', 'LAZYWRITER_SLEEP', 'SLEEP_SYSTEMTASK', 'SLEEP_BPOOL_FLUSH', 'BROKER_EVENTHANDLER', 'XE_DISPATCHER_WAIT', 'FT_IFTSHC_MUTEX', 'CHECKPOINT_QUEUE', 'FT_IFTS_SCHEDULER_IDLE_WAIT', 'BROKER_TRANSMITTER', 'FT_IFTSHC_MUTEX', 'KSOURCE_WAKEUP', 'LAZYWRITER_SLEEP', 'LOGMGR_QUEUE', 'ONDEMAND_TASK_QUEUE', 'REQUEST_FOR_DEADLOCK_SEARCH', 'XE_TIMER_EVENT', 'BAD_PAGE_PROCESS', 'DBMIRROR_EVENTS_QUEUE', 'BROKER_RECEIVE_WAITFOR', 'PREEMPTIVE_OS_GETPROCADDRESS', 'PREEMPTIVE_OS_AUTHENTICATIONOPS', 'WAITFOR', 'DISPATCHER_QUEUE_SEMAPHORE', 'XE_DISPATCHER_JOIN', 'RESOURCE_QUEUE' ) ORDER BY wait_time_ms DESC
- 8. CXPACKET :Often indicates nothing more than that certain queries are executing with parallelism; CXPACKET waits in the server are not an immediate sign of problems, although they may be the symptom of another problem, associated with one of the other high value wait types in the instance. SOS_SCHEDULER_YIELD :The tasks executing in the system are yielding the scheduler, having exceeded their quantum, and are having to wait in the runnable queue for other tasks to execute. This may indicate that the server is under CPU pressure. THREADPOOL :A task had to wait to have a worker bound to it, in order to execute. This could be a sign of worker thread starvation, requiring an increase in the number of CPUs in the server, to handle a highly concurrent workload, or it can be a sign of blocking, resulting in a large number of parallel tasks consuming the worker threads for long periods. LCK_* :These wait types signify that blocking is occurring in the system and that sessions have had to wait to acquire a lock of a specific type, which was being held by another database session. This problem can be investigated further using, for example, the information in the sys.dm_db_index_operational_stats. PAGEIOLATCH_*, IO_COMPLETION, WRITELOG :These waits are commonly associated with disk I/O bottlenecks, though the root cause of the problem may be, and commonly is, a poorly performing query that is consuming excessive amounts of memory in the server. PAGEIOLATCH_* waits are specifically associated with delays in being able to read or write data from the database files. WRITELOG waits are related to issues with writing to log files. These waits should be evaluated in conjunction with the virtual file statistics as well as Physical Disk performance counters, to determine if the problem is specific to a single database, file, or disk, or is instance wide.
- 9. PAGELATCH_* :Non-I/O waits for latches on data pages in the buffer pool. A lot of times PAGELATCH_* waits are associated with allocation contention issues. One of the best-known allocations issues associated with PAGELATCH_* waits occurs in tempdb when the a large number of objects are being created and destroyed in tempdb and the system experiences contention on the Shared Global Allocation Map (SGAM), Global Allocation Map (GAM), and Page Free Space (PFS) pages in the tempdb database. LATCH_* :These waits are associated with lightweight short-term synchronization objects that are used to protect access to internal caches, but not the buffer cache. These waits can indicate a range of problems, depending on the latch type. Determining the specific latch class that has the most accumulated wait time associated with it can be found by querying the sys.dm_os_latch_stats DMV. ASYNC_NETWORK_IO :This wait is often incorrectly attributed to a network bottleneck. In fact, the most common cause of this wait is a client application that is performing row-by-row processing of the data being streamed from SQL Server as a result set (client accepts one row, processes, accepts next row, and so on). Correcting this wait type generally requires changing the client-side code so that it reads the result set as fast as possible, and then performs processing.
- 10. A CPU bottleneck can be caused by hardware resources that are insufficient for the load. However, excessive CPU utilization can commonly be reduced by query tuning (especially if there was a sudden increase without additional load or different queries on the server), addressing any application design factors, and optimizing the system configuration. Investigate when: ◦ Processor:% Processor Time for each CPU consistently above 80% Look to see if: ◦ Process:% Processor Time for sqlservr is high ◦ Value of runnable_tasks_count is non-zero SELECT scheduler_id, current_tasks_count, runnable_tasks_count FROM sys.dm_os_schedulers WHERE scheduler_id < 255 What to do next? ◦ These values only indicate that your server is CPU bound. ◦ However, first, find the largest consumers of CPU bandwidth and fine tune them. ◦ Only consider buying additional CPU power, if the these consumers cannot be fine tuned.
- 11. ◦ Inefficient Query Execution Plan ◦ Excessive Compilations and Recompilations ◦ Intra-Query Parallelism ◦ Inefficient Use of Server Side Cursors ◦ User-Defined Functions Background SQL Server optimizer attempts to find a plan with best response time based on internal costing algorithms However, due to several factors (missing indexes, out of date statistics), it might end up using a sub-optimal execution plan. Certain elements of such sub-optimal execution plan (Hash, Sort etc.) could drive CPU high.
- 12. Using DMVs ◦ sys.dm_exec_query_stats ◦ Run the following query to get the TOP 25 completed queries that are consuming the most cumulative CPU SELECT highest_cpu_queries.plan_handle, (highest_cpu_queries.total_worker_time/highest_cpu_queries.execution_count) AS AverageCPU, highest_cpu_queries.execution_count, highest_cpu_queries.total_worker_time, highest_cpu_queries.plan_generation_num, highest_cpu_queries.creation_time, highest_cpu_queries.last_execution_time, highest_cpu_queries.last_physical_reads, highest_cpu_queries.min_physical_reads, q.dbid, q.objectid, q.number, q.encrypted, q.[text] FROM (SELECT TOP 25 qs.plan_handle, qs.total_worker_time, qs.last_execution_time, qs.plan_generation_num, qs.creation_time, qs.execution_count, qs.last_physical_reads, qs.min_physical_reads FROM sys.dm_exec_query_stats qs ORDER BY qs.total_worker_time DESC) AS highest_cpu_queries CROSS APPLY sys.dm_exec_sql_text(plan_handle) AS q ORDER BY AverageCPU DESC
- 13. ◦ Plan_Handle ◦ Total_worker_time ◦ Plan_generation_number ◦ Creation_time ◦ Last_execution_time ◦ Execution_count ◦ Last_physical_reads ◦ Min_physical reads Run each query identified in Management Studio To get the actual execution plan with SET STATISTICS PROFILE ON or SET STATISTICS XML ON Use sys.dm_exec_query_plan to find out the execution plan and missing indexes Compare the actual vs (estimate rows x estimated executions). A huge difference of the order of 10x could indicate inaccurate cardinality estimates Look at the execution plan for any inefficient operators – index scans vs seeks, hash or sort operators, table spools, etc. What to do with the Output?
- 14. ◦ UPDATE STATISTICS If cardinality estimates are off, update the statistics. ◦ Check for missing Indexes Use Database Engine Tuning Advisor to find out any missing indexes that could enhance query performance ◦ Modify Query Try to modify the query to make better use (restrictive WHERE clause etc.) ◦ Use new features in SQL 2005 to force execution plan You can use the Plan Guides in SQL 2005 to force a particular execution plan for a query. Refer to the BOL section on Understanding Plan Guides for more details on how to use plan guides, the associated overheads and the scenarios in which they are most suited.
- 15. Background ◦ Query optimizer picks the plan that gives the fastest response time based on internal SQL Server costing algorithms. ◦ If the query’s estimated cost is > cost threshold for parallelism option (default is 5), optimizer may use parallelism in the query plan. ◦ In most scenarios, parallelism should enhance query performance. ◦ However, the response time for a given query must be weighed against the overall throughput and responsiveness of the rest of the queries on the system.
- 16. Using DMVs ◦ Run this query to determine all active queries running in parallel SELECT r.session_id, r.request_id, r.start_time, r.status, r.command, r.database_id, r.user_id, r.blocking_session_id, r.wait_type, r.wait_time, r.last_wait_type, r.wait_resource, max(isnull(exec_context_id, 0)) as number_of_workers, r.sql_handle, r.statement_start_offset, r.statement_end_offset, r.plan_handle FROM sys.dm_exec_requests r JOIN sys.dm_os_tasks t ON r.session_id = t.session_id JOIN sys.dm_exec_sessions s ON r.session_id = s.session_id WHERE s.is_user_process = 0x1 GROUP BY r.session_id, r.request_id, r.sql_handle, r.plan_handle, r.statement_start_offset, r.statement_end_offset, r.start_time, r.status, r.command, r.database_id, r.user_id, r.blocking_session_id, r.wait_type, r.wait_time, r.last_wait_type, r.wait_resource HAVING max(isnull(exec_context_id, 0)) > 0
- 17. Looking at the output ◦ Session_id ◦ Start_time ◦ Status ◦ Database_id ◦ User_id ◦ Blocking_session_id, wait_type, wait_time, last_wait_type, wait_resource Use sys.dm_exec_query_plan DMF to find the query text
- 18. Common Resolutions ◦ MAXDOP = 1 For the queries identified as running in parallel, use MAXDOP = 1 to see if there is any improvement. ◦ Cardinality Estimates Compare the differences in the actual versus the estimated cardinality. If they are significant, then update statistics on underlying tables to see if there is an improvement in performance ◦ Analyze missing indexes Use Database Engine Tuning Advisor to check for any missing indexes which could improve performance. ◦ Modify the query Investigate the possibilities of re-writing the query to take advantage of other T- SQL constructs
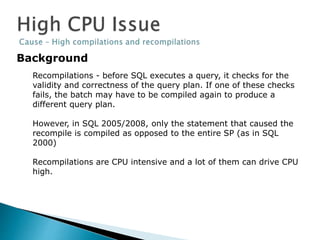
- 19. Background Recompilations - before SQL executes a query, it checks for the validity and correctness of the query plan. If one of these checks fails, the batch may have to be compiled again to produce a different query plan. However, in SQL 2005/2008, only the statement that caused the recompile is compiled as opposed to the entire SP (as in SQL 2000) Recompilations are CPU intensive and a lot of them can drive CPU high.
- 20. ◦ Using DMVs Run the following query to find out the top 25 SPs that have been recompiled the most The text column will give you the exact text of the SP that has been recompiled. SELECT TOP 25 sql_text.text, sql_handle, plan_generation_num, last_execution_time, execution_count, dbid, objectid FROM sys.dm_exec_query_stats a CROSS APPLY sys.dm_exec_sql_text(sql_handle) as sql_text WHERE plan_generation_num >1 ORDER BY plan_generation_num DESC
- 21. Common Resolutions ◦ Recompilations due to SET Using profiler, you will be able to find out the statement that caused the recompile. If it was a SET statement, you might want to take it out and set at the connection level, to avoid recompilations. ◦ Hint Usage Make sure that the SP was not created using WITH RECOMPILE option or RECOMPILE query hint. ◦ Use DTA Use Database Engine Tuning Advisor to see if any index changes improve the compile time and execution time of the query. ◦ Workarounds KEEP FIXED PLAN ensures that the same plan is used even though the statistics have been updated. This plan will be recompiled only when the schema of the underlying tables change Disable Auto Update Statistics This should be the last resort, as it could lead to inefficient query execution plans
- 22. About Cursor Usage ◦ Earlier versions of SQL allowed only one command per connection. ◦ Another command couldn’t be issued on the same connection, if the query was still executing or results were pending to be sent to the client ◦ In scenarios where another command needs to be run based on the row just read, customers resorted to server side cursors. ◦ sp_cursorfetch controls the number of rows to be returned by the server to the client. This allows ODBC or OLEDB driver to cache the rows. ◦ The same connection can then be used to issue another command.
- 23. Using DMVs ◦ Run the following query to find out the API cursors which have a fetch buffer size of 1. ◦ From the output, you can find the session_id and the sql_handle. Use the DMV sys.dm_exec_sql_text to find the details about the sql_handle. SELECT cur.* FROM sys.dm_exec_connections con CROSS APPLY sys.dm_exec_cursors(con.session_id) as cur WHERE cur.fetch_buffer_size = 1
- 24. Common Resolutions ◦ Can you avoid server side cursors? You should evaluate other options if possible. ◦ Consider using MARS MARS allows multiple commands to be issued on the same connection in parallel. ◦ Try using a bigger fetch buffer size Instead of fetching 1 result, check to see if you could return a larger buffer from the server
- 25. UDFs causing High CPU ◦ Sometimes the query that you identify is using one or more UDFs which account for most of the CPU usage. ◦ Identify the UDFs via query review, along with UDF source code.
- 26. Alternatives to UDF usage ◦ Can the query be re-written to use more efficient methods? ◦ Can the UDF code be moved into a stored procedure being called? ◦ Can the UDF be rewritten in SQL CLR as a User- Defined Function or User-Defined Aggregate?
- 27. Introduction ◦ I/O is a very expensive activity. SQL Server’s performance depends upon the performance of your disk subsystem. ◦ Not all the data pages of all your databases can fit into memory at all times, thereby causing I/O to disk. ◦ Also, SQL Server depends on Tempdb (row versions, sort results etc.), so optimizing TempDB performance is also critical for overall SQL Server performance.
- 28. When to investigate Counters to identify I/O bottlenecks: Counter Values PhysicalDisk Object: Avg. Disk Queue Length Consistently > 2 Physical Disk: %Disk Time > 50% Avg. Disk Sec/Read Less than 10 ms - very good Between 10 - 20 ms - okay Between 20 - 50 ms - slow, needs attention Greater than 50 ms – Serious I/O bottleneck Avg. Disk Sec/Write Avg. Disk Reads/Sec > 85% of disk capacity Avg. Disk Writes/Sec
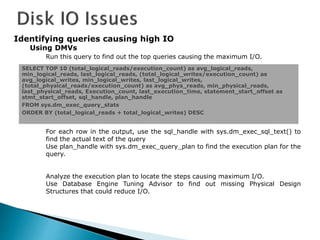
- 29. Identifying queries causing high IO Using DMVs Run this query to find out the top queries causing the maximum I/O. For each row in the output, use the sql_handle with sys.dm_exec_sql_text() to find the actual text of the query Use plan_handle with sys.dm_exec_query_plan to find the execution plan for the query. Analyze the execution plan to locate the steps causing maximum I/O. Use Database Engine Tuning Advisor to find out missing Physical Design Structures that could reduce I/O. SELECT TOP 10 (total_logical_reads/execution_count) as avg_logical_reads, min_logical_reads, last_logical_reads, (total_logical_writes/execution_count) as avg_logical_writes, min_logical_writes, last_logical_writes, (total_physical_reads/execution_count) as avg_phys_reads, min_physical_reads, last_physical_reads, Execution_count, last_execution_time, statement_start_offset as stmt_start_offset, sql_handle, plan_handle FROM sys.dm_exec_query_stats ORDER BY (total_logical_reads + total_logical_writes) DESC
- 30. Common Resolutions ◦ Analyze the execution plans for missing PDS Use Database Engine Tuning Advisor to find out any missing physical design structures (i.e. Indexes) that could enhance performance and reduce I/O overhead. For example, the right index could reduce the I/O, thereby causing lesser wait times for other queries to execute on the same disk sub-system. ◦ Analyze Memory Consumption Insufficient memory and its configuration could cause more I/Os for your disk (as not all the data pages are in memory and need to be fetched from the disk). ◦ Implement best practices for SQL Log files should be on a separate physical disk than the data files Use RAID for data files and log files Optimize tempdb for performance. ◦ Increase I/O bandwidth If none of the above yield any significant improvements, you might want to consider getting a better disk subsystem
- 31. Common Causes for High Disk I/O ◦ SQL Server Related Bad Query Plan Poorly Designed Queries SQL Server MDF, LDF, and Backup Locations ◦ Hardware Related Firmware out of Date Faulty or Degraded Hardware RAID configurations Hardware not sufficient for IO Demands
- 32. One of the most important routes to high performance in a SQL Server database is the index. Indexes speed up the querying process by providing swift access to rows in the data tables, similarly to the way a book’s index helps you find information quickly within that book. Index Types: In addition to an index being clustered or non clustered, it can be configured in other ways: Clustered Index : A clustered index sorts and stores the data rows of the table or view in order based on the clustered index key. The clustered index is implemented as a B-tree index structure that supports fast retrieval of the rows, based on their clustered index key values. Non-Clustered Index :A nonclustered index can be defined on a table or view with a clustered index or on a heap. Each index row in the nonclustered index contains the nonclustered key value and a row locator. This locator points to the data row in the clustered index or heap having the key value. The rows in the index are stored in the order of the index key values, but the data rows are not guaranteed to be in any particular order unless a clustered index is created on the table. Composite Index: An index that contains more than one column Unique Index: An index that ensures the uniqueness of each value in the indexed column. Cover Index: A type of index that includes all the columns that are needed to process a particular query
- 33. Index fragmentation actually comes in two different forms: external fragmentation and internal fragmentation. Each of these two forms of fragmentation basically is the inefficient use of pages within an index. This inefficient use may be because the logical order of the pages are wrong (external fragmentation) or because the amount of data stored within each page is less than the data page can contain (internal fragmentation). Whichever type of fragmentation occurs in your index, you could face performance issues with your queries because of the fragmentation. Fragmentation % Value Action avg_fragmentation_in_percent > 5 AND < 30 Reorganize Index avg_fragmentation_in_percent > 30 Rebuild Index How do you know when a table is fragmented? Poor query performance over time. More disk activity. Poor cache utilization. Verify the I/O of a query. Verify scan density in SQL 2000 using DBCC SHOWCONTIG and in SQL 2005/2008 using the dynamic management view sys.dm_db_index_physical_stats. SELECT OBJECT_NAME(i.object_id) AS TableName , i.name AS TableIndexName ,phystat.avg_fragmentation_in_percent FROM sys.dm_db_index_physical_stats(DB_ID(), NULL, NULL, NULL, ‘DETAILED’) phystat inner JOIN sys.indexes i ON i.object_id = phystat.object_id AND i.index_id = phystat.index_id WHERE phystat.avg_fragmentation_in_percent > 5 AND phystat.avg_fragmentation_in_percent < 30
- 34. SQL Server collects statistics about individual columns (single-column statistics) or sets of columns (multicolumn statistics). Statistics are used by the query optimizer to estimate the selectivity of expressions, and thus the size of intermediate and final query results. Good statistics allow the optimizer to accurately assess the cost of different query plans and then choose a high-quality plan. All information about a single statistics object is stored in several columns of a single row in the sysindexes table, and in a statistics binary large object (statblob) kept in an internal-only table. information about statistics can be found in the metadata views sys.stats and sys.indexes.
- 35. How old are your statistics? How many rows sampled in the statistics (out of the total rows)? How many steps in the statistics (up to 201 steps in SQL Server 2008)? Steps = number of rows in your histogram. What is the density of that key? Density * # of Rows = average rows returned for a given value You also get the average length of the column. For every step: actual value (high for step), total rows, count of unique rows. Data could be sampled (not based on every row, but just a subset).
Editor's Notes
- #11: HIGH CPU ISSUES – What symptoms to look for? When to investigate? If the value of the counter Processor: % Processor Time is consistently higher than 80% for each CPU over a period of time, it warrants investigating the causes that are driving CPU high. Next, look to see if: Process : % Processor Time for sqlservr process is high. This counter will indicate if SQL Server is the culprit for driving CPU high. If it is note whether or not the processor time is either Kernel Based (Protected) or User based. This could indicate where the problem is located. If not, then you should look at the same counter for other processes running on your server to find out what is driving the CPU high. The value of runnable_tasks_count is non-zero. Runnable_tasks_count is the number of workers, with tasks assigned to them, that are waiting to be scheduled on the runnable queue. If this value is non-zero, it indicates that tasks have to wait to be scheduled on the CPU as it is busy. Higher the value, more are the tasks that are waiting. What to do next? High values of these counters are only an indication of the fact that your system is CPU bound. However, you should first start with finding the largest consumers of CPU bandwidth and try to fine tune them. Several reasons (like non-optimal query plan, a poor configuration, or other design factors) could drive your CPU high. If these factors can be fine tuned or corrected, then they could bring down the CPU usage drastically. However, if they cannot be fine tuned, you should consider enhancing your CPU power by buying additional CPUs. Having established that SQL Server is driving the CPU high, let’s move ahead find out the what factors are driving SQL Server to hog so much CPU.
- #13: Using DMVs The first step is to find out the queries that are most CPU bound. To find out the TOP 25 completed such queries which have the highest cumulative CPU usage, run the following query: SELECT highest_cpu_queries.plan_handle, (highest_cpu_queries.total_worker_time/highest_cpu_queries.execution_count) AS AverageCPU, highest_cpu_queries.execution_count, highest_cpu_queries.total_worker_time, highest_cpu_queries.plan_generation_num, highest_cpu_queries.creation_time, highest_cpu_queries.last_execution_time, highest_cpu_queries.last_physical_reads, highest_cpu_queries.min_physical_reads, q.dbid, q.objectid, q.number, q.encrypted, q.[text] FROM (SELECT TOP 25 qs.plan_handle, qs.total_worker_time, qs.last_execution_time, qs.plan_generation_num, qs.creation_time, qs.execution_count, qs.last_physical_reads, qs.min_physical_reads FROM sys.dm_exec_query_stats qs ORDER BY qs.total_worker_time DESC) AS highest_cpu_queries CROSS APPLY sys.dm_exec_sql_text(plan_handle) AS q ORDER BY AverageCPU DESC NOTE: Since the query above only returns queries that have completed you may want to make sure that any currently running queries are also known about: SELECT SPID, CPU, s2.text, open_tran, status, program_name, net_library, loginame FROM sys.sysprocesses CROSS APPLY sys.dm_exec_sql_text(sql_handle) AS s2 where cpu > 5000 and status = 'runnable' -- CPU greater than five seconds and Active Caveat: The CPU field is a cumulative CPU time for the SPID and may not reflect the current activity on the SPID. Use DBCC INPUTBUFFER(spid) to get the current input buffer. This will not be an exact science, but should be captured for quick analysis.
- #14: Analyzing the Output Remember that : 1. The DMV sys.dm_exec_query_stats stores information since the last restart of your SQL Server. 2. DBCC SQLPERF doesn’t clear out the data in this DMV. The only way to clear it out is either by restarting SQL Server or by running DBCC DROPCLEANBUFFERS and DBCC FREEPROCCACHE together, along with checkpoint. The output will give you all the requisite information that you need about the query. Here is the description of some of the columns: Plan_handle Pointer to the plan. This value can be passed to the dm_exec_query_plan dynamic management function. Total_worker_time Total amount of CPU time, in microseconds, that was consumed by executions of this plan since it was compiled. The above output is order by this column’s value, thereby putting the top CPU consuming queries at the top Plan_generation_number Number of times this plan has been recompiled while it has remained in the cache. Higher numbers indicate that the plan had to be recompiled several times. Creation_time Most recent time at which the plan was compiled. Last_execution_time Last time at which the plan was executed. Your output could contain rows from a time when the problem was not happening. Execution_count Number of times that the plan has been executed since it was last compiled. Last_physical_reads Number of physical reads performed the last time the plan was executed. Min_physical reads Minimum number of physical reads that this plan has ever performed during a single execution. NEXT STEPS For each query which is part of the result set, start by looking at the last_execution_time column to find out the last time this query was run. If this time is NOT during the time you were experiencing the high CPU, then you might want to move to the ones that were actually running at the time the CPU went high. However, keep this query in mind as well, because it is definitely consuming a lot of CPU and need to be looked at. After identifying all the queries that were running during the time CPU was high, you need to examine their execution plan. You can get the execution plan in the following ways: Use SET STATISTICS PROFILE ON or SET STATISTICS XML ON Use Management Studio to get the execution plan Use sys.dm_exec_query_plan For each of the plan_handle, run the following query to get the XML execution plan
- #16: HIGH CPU ISSUES – caused by intra query parallelism ABOUT PARALLELISM Query optimizer picks the plan that gives the fastest response time based on internal SQL Server costing algorithms. If the query’s estimated cost is greater than the cost threshold for parallelism option, the query may execute in parallel if the optimizer thinks it will return data more efficiently. The default value of cost threshold for parallelism is set to 5 seconds. You can check this using sp_configure option. In most scenarios, parallelism should enhance query performance. However, the response time for a given query must be weighed against the overall throughput and responsiveness of the rest of the queries on the system. A parallel query typically uses a similar but slightly higher amount of CPU time as compared to the corresponding serial execution plan, but it does so in a shorter duration of elapsed time. Parallel queries are generally best suited to batch processing and decision support workloads and might not be desirable in a transaction processing environment.
- #17: USING DMVs You can run this query to find out the details about all active queries that are running in parallel. SELECT r.session_id, r.request_id, r.start_time, r.status, r.command, r.database_id, r.user_id, r.blocking_session_id, r.wait_type, r.wait_time, r.last_wait_type, r.wait_resource, max(isnull(exec_context_id, 0)) as number_of_workers, r.sql_handle, r.statement_start_offset, r.statement_end_offset, r.plan_handle FROM sys.dm_exec_requests r JOIN sys.dm_os_tasks t ON r.session_id = t.session_id JOIN sys.dm_exec_sessions s ON r.session_id = s.session_id WHERE s.is_user_process = 0x1 GROUP BY r.session_id, r.request_id, r.sql_handle, r.plan_handle, r.statement_start_offset, r.statement_end_offset, r.start_time, r.status, r.command, r.database_id, r.user_id, r.blocking_session_id, r.wait_type, r.wait_time, r.last_wait_type, r.wait_resource HAVING max(isnull(exec_context_id, 0)) > 0
- #18: Let’s take a look at some of the important columns returned in the output of this query: Session_id ID of the session to which this request is related Start_time Timestamp when the request arrived Status Status of the request. Could be Background, Running, Runnable, Sleeping, Suspended Database_id ID of the database against which the request arrived. User_id ID of the user who submitted the request. Blocking_session_id, wait_type, wait_time, last_wait_type, wait_resource These columns have details about blocking, if any, the related wait_types, wait_times etc. Sql_handle, plan_handle Can be used to retrieve the actual details about the executing query. For each output, use the following queries to find out the exact TEXT and the plan for each statement select * from sys.dm_exec_sql_text (sql_handle) select * from sys.dm_exec_query_plan (plan_handle)
- #19: Let’s take a look at some of the important columns returned in the output of this query: Session_id ID of the session to which this request is related Start_time Timestamp when the request arrived Status Status of the request. Could be Background, Running, Runnable, Sleeping, Suspended Database_id ID of the database against which the request arrived. User_id ID of the user who submitted the request. Blocking_session_id, wait_type, wait_time, last_wait_type, wait_resource These columns have details about blocking, if any, the related wait_types, wait_times etc. Sql_handle, plan_handle Can be used to retrieve the actual details about the executing query. For each output, use the following queries to find out the exact TEXT and the plan for each statement select * from sys.dm_exec_sql_text (sql_handle) select * from sys.dm_exec_query_plan (plan_handle)
- #20: HIGH CPU ISSUES – caused by high compilations and recompilations When SQL Server runs a query for the first time, it compiles the query and keeps the compiled plan in cache for future executions of this query. When the same query runs next time, SQL checks for the validity and correctness of the query plan. If one of these checks fails, the batch may have to be compiled again to produce a different query plan. Recompiles are CPU intensive operations. Recompilation can happen due to various reasons, such as: Schema changed Statistics changed Deferred compile SET option changed Temporary table changed Stored procedure created with the RECOMPILE query hint or which uses OPTION (RECOMPILE) In SQL 2005, only the statement that caused the recompile is compiled as opposed to the entire SP (as in SQL 2000). This reduces the overhead. However, still a lot of recompiles can significantly add to the overhead and drive CPU high.
- #21: Using DMVs You can run the following query to find out the TOP 25 most recompiled stored procedures or queries. SELECT TOP 25 sql_text.text, sql_handle, plan_generation_num, last_execution_time, execution_count, dbid, objectid FROM sys.dm_exec_query_stats a CROSS APPLY sys.dm_exec_sql_text(sql_handle) as sql_text WHERE plan_generation_num >1 ORDER BY plan_generation_num DESC The text column indicates the SP or query that has been recompiled.
- #22: Common Resolutions Recompilations due to SET Using profiler, you will be able to find out the statement that caused the recompile. If it was a SET statement, you might want to take it out and set at the connection level, to avoid recompilations. Hint Usage Make sure that the SP was not created using WITH RECOMPILE option or RECOMPILE query hint, which causes recompile on every execution. Use DTA Use Database Engine Tuning Advisor to see if any index changes improve the compile time and execution time of the query. Workarounds KEEP FIXED PLAN ensures that the same plan is used even though the statistics have been updated. This plan will be recompiled only when the schema of the underlying tables change Disable Auto Update Statistics This should be the last resort, as it could lead to inefficient query execution plans These are some of the common resolutions to explore for your customer.
- #23: Common Resolutions Recompilations due to SET Using profiler, you will be able to find out the statement that caused the recompile. If it was a SET statement, you might want to take it out and set at the connection level, to avoid recompilations. Hint Usage Make sure that the SP was not created using WITH RECOMPILE option or RECOMPILE query hint, which causes recompile on every execution. Use DTA Use Database Engine Tuning Advisor to see if any index changes improve the compile time and execution time of the query. Workarounds KEEP FIXED PLAN ensures that the same plan is used even though the statistics have been updated. This plan will be recompiled only when the schema of the underlying tables change Disable Auto Update Statistics This should be the last resort, as it could lead to inefficient query execution plans These are some of the common resolutions to explore for your customer.
- #24: USING DMVS Run the following query to get a list of all the active cursors that have a fetch buffer size of 1. SELECT cur.* FROM sys.dm_exec_connections con CROSS APPLY sys.dm_exec_cursors(con.session_id) as cur WHERE cur.fetch_buffer_size = 1 In the output, you can use the sql_handle to identify the cursor details.
- #25: RESOLUTIONS Can you avoid cursors? Determine if cursors are the most appropriate means to accomplish the processing or whether a set-based operation, which is generally more efficient, is possible. Client-side cursors, etc. Consider using MARS MARS allows multiple commands to be issued on the same connection in parallel. Try using a bigger fetch buffer size Instead of fetching 1 result, check to see if you could return a larger buffer from the server
- #26: UDFs causing High CPU This is common scenario where the query that is identified with the highest CPU is also using one or more UDFs. You can see the UDF code via the SP:Stmtxxx commands. You should gather the code for each UDF and find out what the customer is trying to accomplish by using the UDF so that you can find a way to reduce CPU usage by the UDF.
- #27: UDFs causing High CPU This is common scenario where the query that is identified with the highest CPU is also using one or more UDFs. You can see the UDF code via the SP:Stmtxxx commands. You should gather the code for each UDF and find out what the customer is trying to accomplish by using the UDF so that you can find a way to reduce CPU usage by the UDF.
- #28: UDFs causing High CPU This is common scenario where the query that is identified with the highest CPU is also using one or more UDFs. You can see the UDF code via the SP:Stmtxxx commands. You should gather the code for each UDF and find out what the customer is trying to accomplish by using the UDF so that you can find a way to reduce CPU usage by the UDF.
- #29: WHEN TO INVESTIGATE YOUR DISK SUBSYSTEM Note that the values of these counters are only guidelines. It is worthwhile to investigate I/O bottlenecks if: PhysicalDisk Object: Avg. Disk Queue Length Is the average number of both read and write requests that were queued for the selected disk during the sample interval. If this value is greater than 2 consistently over a period of time, then it indicates a disk bottleneck. Physical Disk: %Disk Time Is the percentage of elapsed time that the selected disk drive was busy servicing read or write requests. If this is greater than 50%, the disk drive might be causing an overall slowdown. Avg. Disk Sec/Read and Avg. Disk Sec/Write Is the average time, in seconds, of a read or write of data from the disk. Anything greater than 20 ms is worth investigating. Avg. Disk Reads/Sec and Avg. Disk Writes/Sec Is the rate of read or write operations on the disk. This should not be more than 85% of your disk specifications. You can check for your disk specifications from your vendor. Special considerations for RAID If you are using RAID configurations, then the values of the above counters should be adjusted using the following formula. Raid 0 -- I/Os per disk = (reads + writes) / number of disks Raid 1 -- I/Os per disk = [reads + (2 * writes)] / 2 Raid 5 -- I/Os per disk = [reads + (4 * writes)] / number of disks Raid 10 -- I/Os per disk = [reads + (2 * writes)] / number of disks The same formula should be used for average disk queue lengths to adjust them for RAID.
- #30: After taking a look at the counters, you will be able to decided if investigating the disk activity is worthwhile. The next step would be to find out the top queries that are I/O bound. Run the following query to find out the TOP 10 queries causing the most I/O. select top 10 (total_logical_reads/execution_count) as avg_logical_reads, min_logical_reads, last_logical_reads, (total_logical_writes/execution_count) as avg_logical_writes, min_logical_writes, last_logical_writes, (total_physical_reads/execution_count) as avg_phys_reads, min_physical_reads, last_physical_reads, Execution_count, last_execution_time, statement_start_offset as stmt_start_offset, sql_handle, plan_handle from sys.dm_exec_query_stats order by (total_logical_reads + total_logical_writes) Desc Lets take a look at the output columns: Avg_logical_reads, min_logical_reads, last_logical_reads Indicates the logical reads performed – average, minimal since the last restart of SQL and the last time this query was run. Avg_logical_writes, min_logical_writes, last_logical_writes Indicates the logical writes performed – average, minimal since the last restart of SQL and the last time this query was run. Avg_physical_reads, min_physical_reads, last_physical_reads Indicates the actual physical reads performed – average, minimal since the last restart of SQL and the last time this query was run. Execution_count, last_execution_time Indicates the number of times this query has been executed since the last compilation and the last execution time. Slq_handle and plan_handle Can be used with the following queries to find out the actual text of the query and its plan. select * from sys.dm_exec_sql_text (sql_handle) select * from sys.dm_exec_query_plan (plan_handle) WHAT TO DO NEXT? Look at the execution plans for each of these queries for any sub-optimal operators like index scans vs seeks, hash or sort operators etc. Use Database Engine Tuning Advisor to find any missing physical design structures that could enhance performance of these queries. ALTERNATIVE METHOD You can use a profiler trace and put it as an input to ReadTrace. The output report produced by ReaddTrace can be used to identify the queries that are causing the most I/O. However, my personal choice is still the DMVs because of the less overhead and quicker response. After taking a look at the counters, you will be able to decided if investigating the disk activity is worthwhile. The next step would be to find out the top queries that are I/O bound. Run the following query to find out the TOP 10 queries causing the most I/O. select top 10 (total_logical_reads/execution_count) as avg_logical_reads, min_logical_reads, last_logical_reads, (total_logical_writes/execution_count) as avg_logical_writes, min_logical_writes, last_logical_writes, (total_physical_reads/execution_count) as avg_phys_reads, min_physical_reads, last_physical_reads, Execution_count, last_execution_time, statement_start_offset as stmt_start_offset, sql_handle, plan_handle from sys.dm_exec_query_stats order by (total_logical_reads + total_logical_writes) Desc Lets take a look at the output columns: Avg_logical_reads, min_logical_reads, last_logical_reads Indicates the logical reads performed – average, minimal since the last restart of SQL and the last time this query was run. Avg_logical_writes, min_logical_writes, last_logical_writes Indicates the logical writes performed – average, minimal since the last restart of SQL and the last time this query was run. Avg_physical_reads, min_physical_reads, last_physical_reads Indicates the actual physical reads performed – average, minimal since the last restart of SQL and the last time this query was run. Execution_count, last_execution_time Indicates the number of times this query has been executed since the last compilation and the last execution time. Slq_handle and plan_handle Can be used with the following queries to find out the actual text of the query and its plan. select * from sys.dm_exec_sql_text (sql_handle) select * from sys.dm_exec_query_plan (plan_handle) WHAT TO DO NEXT? Look at the execution plans for each of these queries for any sub-optimal operators like index scans vs seeks, hash or sort operators etc. Use Database Engine Tuning Advisor to find any missing physical design structures that could enhance performance of these queries. ALTERNATIVE METHOD You can use a profiler trace and put it as an input to ReadTrace. The output report produced by ReaddTrace can be used to identify the queries that are causing the most I/O. However, my personal choice is still the DMVs because of the less overhead and quicker response.
- #31: COMMON RESOLUTIONS Analyze the execution plans for missing PDS Use Database Engine Tuning Advisor to find out any missing physical design structures that could enhance performance and reduce I/O overhead. For example, the right index could reduce the I/O for your query, thereby causing lesser wait times for other queries to execute on the same disk sub-system. Analyze Memory Consumption Insufficient memory and its configuration could cause more I/Os for your disk (as not all the data pages are in memory and need to be fetched from the disk). You should look at memory troubleshooting section of the training SQL 2005 Performance – Memory concepts and troubleshooting to understand how to identify if memory is bottleneck. Implement best practices for SQL Log files should be on a separate physical disk than the data files Use RAID for log and data files Optimize tempdb for performance. Increase I/O bandwidth If none of the above yield any significant improvements, you might want to consider getting a better disk subsystem
- #32: UDFs causing High CPU This is common scenario where the query that is identified with the highest CPU is also using one or more UDFs. You can see the UDF code via the SP:Stmtxxx commands. You should gather the code for each UDF and find out what the customer is trying to accomplish by using the UDF so that you can find a way to reduce CPU usage by the UDF.