SQLd360 is a free tool designed to help collecting and analyzing SQL Tuning-related info from an Oracle database.
Available for free on GitHub, just google "sqld360"
Understanding my database through SQL*Plus using the free tool eDB360Carlos Sierra
This session introduces eDB360 - a free tool that is executed from SQL*Plus and generates a set of reports providing a 360-degree view of an Oracle database; all without installing anything on the database.
If using Oracle Enterprise Manager (OEM) is off-limits for you or your team, and you can only access the database thorough a SQL*Plus connection with no direct access to the database server, then this tool is a perfect fit to provide you with a broad overview of the database configuration, performance, top SQL and much more. You only need a SQL*Plus account with read access to the data dictionary, and common Oracle licenses like the Diagnostics or the Tuning Pack.
Typical uses of this eDB360 tool include: databases health-checks, performance assessments, pre or post upgrade verifications, snapshots of the environment for later use, compare between two similar environments, documenting the state of a database when taking ownership of it, etc.
Once you learn how to use eDB360 and get to appreciate its value, you may want to execute this tool on all your databases on a regular basis, so you can keep track of things for long periods of time. This tool is becoming part of a large collection of goodies many DBAs use today.
During this session you will learn the basics about the free eDB360 tool, plus some cool tricks. The target audience is: DBAs, developers and consultants (some managers could also benefit).
This is a recording of my Advanced Oracle Troubleshooting seminar preparation session - where I showed how I set up my command line environment and some of the main performance scripts I use!
Session aims at introducing less familiar audience to the Oracle database statistics concept, why statistics are necessary and how the Oracle Cost-Based Optimizer uses them
Any DBA from beginner to advanced level, who wants to fill in some gaps in his/her knowledge about Performance Tuning on an Oracle Database, will benefit from this workshop.
Oracle Database Performance Tuning Advanced Features and Best Practices for DBAsZohar Elkayam
Oracle Week 2017 slides.
Agenda:
Basics: How and What To Tune?
Using the Automatic Workload Repository (AWR)
Using AWR-Based Tools: ASH, ADDM
Real-Time Database Operation Monitoring (12c)
Identifying Problem SQL Statements
Using SQL Performance Analyzer
Tuning Memory (SGA and PGA)
Parallel Execution and Compression
Oracle Database 12c Performance New Features
Survey of some free Tools to enhance your SQL Tuning and Performance Diagnost...Carlos Sierra
Several free tools are available to help with SQL tuning and performance diagnostics, including SQLd360, SQLT, and eDB360. SQLd360 and SQLT are good for diagnosing a single SQL statement, while eDB360 provides a 360-degree view of an entire Oracle database. Snapper and TUNAs360 can diagnose sessions and database activity. Standalone scripts like planx and sqlmon provide specialized diagnostics for individual cases. These free tools vary in size and capabilities, but all aim to help tune and diagnose SQL and database performance issues.
Your tuning arsenal: AWR, ADDM, ASH, Metrics and AdvisorsJohn Kanagaraj
Oracle Database 10g brought in a slew of tuning and performance related tools and indeed a new way of dealing with performance issues. Even though 10g has been around for a while, many DBAs haven’t really used many of the new features, mostly because they are not well known or understood. In this Expert session, we will look past the slick demos of the new tuning and performance related tools and go “under the hood”. Using this knowledge, we will bypass the GUI and look at the views and counters that matter and quickly understand what they are saying. Tools covered include AWR, ADDM, ASH, Metrics, Tuning Advisors and their related views. Much of information about Oracle Database 10g presented in this paper has been adapted from my book and I acknowledge that with gratitude to my publisher - SAMS (Pearson).
This presentation talks about the different ways of getting SQL Monitoring reports, reading them correctly, common issues with SQL Monitoring reports - and plenty of Oracle 12c-specific improvements!
Exploring Oracle Database Performance Tuning Best Practices for DBAs and Deve...Aaron Shilo
The document provides an overview of Oracle database performance tuning best practices for DBAs and developers. It discusses the connection between SQL tuning and instance tuning, and how tuning both the database and SQL statements is important. It also covers the connection between the database and operating system, how features like data integrity and zero downtime updates are important. The presentation agenda includes topics like identifying bottlenecks, benchmarking, optimization techniques, the cost-based optimizer, indexes, and more.
This document discusses Oracle database performance tuning. It covers identifying common Oracle performance issues such as CPU bottlenecks, memory issues, and inefficient SQL statements. It also outlines the Oracle performance tuning method and tools like the Automatic Database Diagnostic Monitor (ADDM) and performance page in Oracle Enterprise Manager. These tools help administrators monitor performance, identify bottlenecks, implement ADDM recommendations, and tune SQL statements reactively when issues arise.
Understanding SQL Trace, TKPROF and Execution Plan for beginnersCarlos Sierra
The three fundamental steps of SQL Tuning are: 1) Diagnostics Collection; 2) Root Cause Analysis (RCA); and 3) Remediation. This introductory session on SQL Tuning is for novice DBAs and Developers that are required to investigate a piece of an application performing poorly.
On this session participants will learn about producing a SQL Trace then a summary TKPROF report. A sample TKPROF is navigated with the audience, where the trivial and the no so trivial is exposed and explain. Execution Plans are also navigated and explained, so participants can later untangle complex Execution Plans and start diagnosing SQL performing badly.
This session encourages participants to ask all kind of questions that could be potential road-blocks for deeper understanding of how to address a SQL performing poorly.
Ash masters : advanced ash analytics on Oracle Kyle Hailey
The document discusses database performance tuning. It recommends using Active Session History (ASH) and sampling sessions to identify the root causes of performance issues like buffer busy waits. ASH provides key details on sessions, SQL statements, wait events, and durations to understand top resource consumers. Counting rows in ASH approximates time spent and is important for analysis. Sampling sessions in real-time can provide the SQL, objects, and blocking sessions involved in issues like buffer busy waits.
This document provides an overview and interpretation of the Automatic Workload Repository (AWR) report in Oracle database. Some key points:
- AWR collects snapshots of database metrics and performance data every 60 minutes by default and retains them for 7 days. This data is used by tools like ADDM for self-management and diagnosing issues.
- The top timed waits in the AWR report usually indicate where to focus tuning efforts. Common waits include I/O waits, buffer busy waits, and enqueue waits.
- Other useful AWR metrics include parse/execute ratios, wait event distributions, and top activities to identify bottlenecks like parsing overhead, locking issues, or inefficient SQL.
Learn from the author of SQLTXPLAIN the fundamentals of SQL Tuning: 1) Diagnostics Collection; 2) Root Cause Analysis (RCA); and 3) Remediation.
SQL Tuning is a complex and intimidating area of knowledge, and it requires years of frequent practice to master it. Nevertheless, there are some concepts and practices that are fundamental to succeed. From basic understanding of the Cost-based Optimizer (CBO) and the Execution Plans, to more advance topics such as Plan Stability and the caveats of using SQL Profiles and SQL Plan Baselines, this session is full of advice and experience sharing. Learn what works and what doesn't when it comes to SQL Tuning.
Participants of this session will also learn about several free tools (besides SQLTXPLAIN) that can be used to diagnose a SQL statement performing poorly, and some others to improve Execution Plan Stability.
Either if your are a novice DBA, or an experienced DBA or Developer, there will be something new for you on this session. And if this is your first encounter with SQL Tuning, at least you will learn the basic concepts and steps to succeed in your endeavor.
This document discusses techniques for optimizing SQL performance in Oracle databases. It covers topics like optimizing the optimizer itself through configuration changes and statistics collection, detecting poorly performing SQL, and methods for improving plans such as indexing, partitioning, hints and baselines. The goal is to maximize the optimizer's accuracy and ability to handle edge cases, while also knowing how to intervene when needed to capture fugitive SQL and ensure acceptable performance.
Adapting and adopting SQL Plan Management (SPM) to achieve execution plan stability for sub-second queries on a high-rate OLTP mission-critical application
Troubleshooting Complex Oracle Performance Problems with Tanel PoderTanel Poder
The document describes troubleshooting a performance issue involving parallel data loads into a data warehouse. It is determined that the slowness is due to recursive locking and buffer busy waits occurring during inserts into the SEG$ table as new segments are created by parallel CREATE TABLE AS SELECT statements. This is causing a nested locking ping-pong effect between the cache, transaction, and I/O layers as sessions repeatedly acquire and release locks and buffers.
The document discusses Oracle database logging and redo operations. It describes how Oracle uses physiological logging to generate redo records from change vectors. Change vectors transition database blocks between versions. Redo records group change vectors and transition the overall database state. The document provides an example redo record for an INSERT statement, showing the change vectors for both the table and undo segments involved in the transaction.
AIOUG : OTNYathra - Troubleshooting and Diagnosing Oracle Database 12.2 and O...Sandesh Rao
This document provides an overview of Oracle Database 12c and Oracle Real Application Clusters (RAC) troubleshooting and diagnosing. It begins with an architectural overview of Grid Infrastructure including Oracle Clusterware and Automatic Storage Management. It then discusses common troubleshooting scenarios and tools that can be used for both proactive and reactive troubleshooting of Oracle RAC environments.
This document provides an overview of Automatic Workload Repository (AWR) and Active Session History (ASH) reports in Oracle Database. It discusses the various reports available in AWR and ASH, how to generate and interpret them. Key sections include explanations of the AWR reports, using ASH reports to identify specific database issues, and techniques for querying ASH data directly for detailed analysis. The document concludes with examples of using SQL to generate graphs of ASH data from the command line.
Design and develop with performance in mind
Establish a tuning environment
Index wisely
Reduce parsing
Take advantage of Cost Based Optimizer
Avoid accidental table scans
Optimize necessary table scans
Optimize joins
Use array processing
Consider PL/SQL for “tricky” SQL
Tanel Poder - Troubleshooting Complex Oracle Performance Issues - Part 1Tanel Poder
The document describes troubleshooting a complex performance issue in an Oracle database. Key details:
- The problem was sporadic extreme slowness of the Oracle database and server lasting 1-20 minutes.
- Initial AWR reports and OS metrics showed a spike at 18:10 with CPU usage at 66.89%, confirming a problem occurred then.
- Further investigation using additional metrics was needed to fully understand the root cause, as initial diagnostics did not provide enough context about this brief problem period.
Troubleshooting Complex Performance issues - Oracle SEG$ contentionTanel Poder
From Tanel Poder's Troubleshooting Complex Performance Issues series - an example of Oracle SEG$ internal segment contention due to some direct path insert activity.
This presentation is based on Lawrence To's Maximum Availability Architecture (MAA) Oracle Open World Presentation talking about the latest updates on high availability (HA) best practices across multiple architectures, features and products in Oracle Database 19c. It considers all workloads, OLTP, DWH and analytics, mixed workload as well as on-premises and cloud-based deployments.
This is the presentation on ASH that I did with Graham Wood at RMOUG 2014 and that represents the final best effort to capture essential and advanced ASH content as started in a presentation Uri Shaft and I gave at a small conference in Denmark sometime in 2012 perhaps. The presentation is also available publicly through the RMOUG website, so I felt at liberty to post it myself here. If it disappears it would likely be because I have been asked to remove it by Oracle.
This document provides an overview of Oracle Automatic Workload Repository (AWR) and Active Session History (ASH) analytics. It discusses the AWR infrastructure, how AWR collects and stores database performance snapshots, and how Automatic Database Diagnostic Monitor (ADDM) analyzes the snapshots. It also describes how ASH collects real-time database activity samples and enables enhanced monitoring and troubleshooting capabilities in Oracle 12c. The presentation includes examples of AWR and ASH reports and demonstrations of new features in Oracle 12c such as Real-Time ADDM and enhanced ASH Analytics.
- The document discusses using various Oracle diagnostic tools like AWR, ASH, and SQL Monitoring for SQL tuning. It focuses on scenarios where multiple data sources are needed to fully understand performance issues.
- Historical ASH and AWR data can provide different perspectives on SQL executions over time that help identify problems like long-running queries or concurrent executions. However, ASH only samples a subset of data so it may miss short queries.
- GV$SQL and AWR reports aggregate performance metrics over all executions of a SQL, so they do not show the full user experience if a query runs intermittently. ASH sampled data can help determine how database time relates to clock time in such cases.
-
Oracle Exadata is the equivalent of a F1 car in terms of performance but are you sure your application is driving it at its full potential? A simple "lift&shift" approach to Exadata migration might lose significant opportunities for improvements. This session highlights a few example where making little changes dramatically changed the application performance
Oracle continues to add more and more automated features and advisors to assist with diagnosing and fixing problems. Given all this automation and advice Oracle is providing, a question to ask is whether or not all this advice is "dumbing us down" or "smartening us up". Too often more automation can lead to using these features as a crutch and bypassing the acquisition of key skills and knowledge. Ideally, these features should be tools to help us do our jobs better instead of simply letting Oracle do it for us. The key is to know what help the advisors can provide and know how to use them properly and effectively. The risk is becoming trained to only follow the advisors output, but when a situation arises where our skills and knowledge are needed, it's not there. This presentation will review several cases where the Oracle SQL Tuning Advisor (in particular) isn't able to provide any help with identifying and correcting poorly performing SQL. We'll then review the knowledge and critical thinking skills needed by the DBA or Developer to understand how to make the needed improvements to the code to provide enhanced performance.
One of the most frustrating challenges many of us deal with is SQL performance regression caused by execution plan changes. Performance seems to take a nose-dive for no apparent reason and everyone scrambles to figure out what happened. Perhaps statistics changed, perhaps an instance parameter changed, perhaps indexes were added or dropped, or perhaps nothing identifiable has changed at all. Regardless of why it happens, the regression needs to be found and corrected quickly.
Karen Morton, Oracle ACE and Embarcadero's Scott Walz will guide you through plan stability strategies.
Watch this webinar on demand to learn:
- How to define and identify plan stability/instability issues
- How SQL profiles and SQL patches can be used to stabilize plans
- Limitations of SQL profiles and SQL patches
- How Oracle's SQL Plan Management features provide a broad solution for plan stability
Indexing Strategies for Oracle Databases - Beyond the Create Index StatementSean Scott
B-tree indexes are the most common type of index and order data within the index in branches and leaves. Composite indexes consist of more than one column to improve performance. When choosing indexes, consider columns frequently used in queries, primary keys, and foreign keys. Index maintenance includes rebuilding, coalescing, and shrinking indexes.
Parallel Execution With Oracle Database 12c - MasterclassIvica Arsov
This document provides an overview of parallel execution in Oracle Database 12c. It discusses parallel execution basics like degree of parallelism (DOP), producer-consumer model, and data flow operations (DFOs). It also covers parallel execution administration topics such as ways to enable parallel query, DML, and DDL. Reasons why parallel DML is not enabled by default are also mentioned. The document then dives deeper into parallel execution concepts like distribution methods, auto DOP, in-memory parallel execution, and tracing parallel operations.
Think simple and spare yourself a facepalm - ENMichal Simonik
This document provides guidance on simplifying SQL queries to improve performance. It recommends identifying relationships between tables, checking for indexes and statistics, and eliminating unnecessary operations. Testing techniques are outlined to compare query plans and performance before and after changes. Examples demonstrate transforming queries using joins, aggregations and window functions to reduce complexity and optimize execution. The goal is to help consultants approach SQL tuning systematically and identify opportunities for improvement.
Dbms plan - A swiss army knife for performance engineersRiyaj Shamsudeen
This document discusses dbms_xplan, a tool for performance engineers to analyze execution plans. It provides options for displaying plans from the plan table, shared SQL area in memory, and AWR history. Dbms_xplan provides more detailed information than traditional tools like tkprof, including predicates, notes, bind values, and plan history. It requires privileges to access dictionary views for displaying plans from memory and AWR. The document also demonstrates usage examples and output formats for dbms_xplan.analyze.
The document describes a visual SQL tuning (VST) presentation. It provides steps for using VST to analyze SQL queries, including laying out the tables and joins in a diagram, identifying filters, and determining the optimal execution path starting with the most selective filter and joining down before joining up. Filters are important for determining the best path, with the goal of starting at the filter with the highest selectivity.
This document describes a visualization technique for SQL tuning called Visual SQL Tuning (VST). VST involves drawing the tables involved in a SQL query as nodes and the joins between the tables as connecting lines to show the relationships. It also identifies any filter conditions in the WHERE clause marked on the relevant tables. This visual representation of the tables, joins, and filters can help identify the optimal execution path for the SQL query.
Subquery factoring, introduced in Oracle 9i, allows queries to be rewritten using a WITH clause to simplify queries and improve performance in some cases. For a query using a full table scan that scanned the same table twice, subquery factoring reduced logical and physical I/O by half by scanning the table once and storing results in memory. For a query using unique index scans, subquery factoring increased I/O due to creating a temporary table, showing there is no single best approach and testing is required.
By expanding our knowledge of SQL facilities, we can let all the boring work be handled via SQL rather than a lot of middle-tier code, and we can get performance benefits as an added bonus. Here are some SQL techniques to solve problems that would otherwise require a lot of complex coding, freeing up your time to focus on the delivery of great applications.
The document discusses different types of joins in Oracle: nested loop joins and hash joins. It provides an example query and explains plan output to demonstrate a nested loop join. The same example is then run with a hint to use a hash join, and the plan is explained, showing the hash table operations instead of nested loops. The key steps of each join method are outlined.
This document provides the schedule for the National University of Lesotho's second semester examinations from May 4-17, 2015. It lists the course codes, names, and locations for exams held each day from 9:00am to 2:00pm. Exams are held Monday through Saturday at the Daniel Thamaga Foundation (DTF) buildings and the National University of Lesotho (NETHL) campus.
1) The document presents the results of two GARCH models (GARCH(1,1) and GARCH(1,1)-AR(2)) fitted to RKLCI return data from 2000 to 2005.
2) Both models show no autoregression or heteroskedasticity based on diagnostic tests of the residuals.
3) Model 2, which includes an AR(2) term, has a slightly better fit based on information criteria.
My insight data engineering project. I created a big data pipeline for performing user sentiment analysis on US Stock market.
www.hashtagcashtag.com
https://github.com/shafiab/MarketSentiment
This document describes a big data pipeline for analyzing user sentiment from Twitter and stock market data. The pipeline ingests Twitter and stock market data from various sources into a Kafka cluster. It then uses Spark batch and streaming jobs to perform sentiment analysis, track trending stocks, and generate real-time and batch views that are stored in Cassandra. The views include time series data of tweet volumes and sentiments for individual stocks. The architecture aims to provide both real-time and batch processing capabilities for user sentiment analysis on stock market data.
Paul Guerin is an OCP Meetup presenter who has worked as a DBA at Origin Energy for 3.5 years. He discusses different types of access paths that a database query optimizer can use to retrieve data from a database, including full table scans, index scans using rowids, unique index scans, range index scans, skip index scans, and full index scans. He provides examples of how the optimizer chooses between these access paths based on factors like indexes available and estimated execution costs.
Oracle Query Tuning Tips - Get it Right the First TimeDean Richards
Whether you are a developer or DBA, this presentation will outline a method for determining the best approach for tuning a query every time by utilizing response time analysis and SQL Diagramming techniques. Regardless of the complexity of the statement or database platform being utilized (this method works on all), this quick and systematic approach will lead you down the correct
tuning path with no guessing. If you are a beginner or expert, this approach will save you countless hours tuning a query.
1. The document describes tasks for a database practice assignment on June 26, 2011. It includes commands to create a database called "pertemuan3" and tables for students, courses, and grades within that database. Data is inserted into the tables.
2. The document then provides answers to 5 questions by running SELECT queries on the tables to retrieve student names, course names, and grades based on different criteria like faculty or grade value.
3. In total, the document demonstrates how to set up a basic student grade tracking database and retrieve information from it through queries.
TestMigrationsInPy: A Dataset of Test Migrations from Unittest to Pytest (MSR...Andre Hora
Unittest and pytest are the most popular testing frameworks in Python. Overall, pytest provides some advantages, including simpler assertion, reuse of fixtures, and interoperability. Due to such benefits, multiple projects in the Python ecosystem have migrated from unittest to pytest. To facilitate the migration, pytest can also run unittest tests, thus, the migration can happen gradually over time. However, the migration can be timeconsuming and take a long time to conclude. In this context, projects would benefit from automated solutions to support the migration process. In this paper, we propose TestMigrationsInPy, a dataset of test migrations from unittest to pytest. TestMigrationsInPy contains 923 real-world migrations performed by developers. Future research proposing novel solutions to migrate frameworks in Python can rely on TestMigrationsInPy as a ground truth. Moreover, as TestMigrationsInPy includes information about the migration type (e.g., changes in assertions or fixtures), our dataset enables novel solutions to be verified effectively, for instance, from simpler assertion migrations to more complex fixture migrations. TestMigrationsInPy is publicly available at: https://github.com/altinoalvesjunior/TestMigrationsInPy.
Why Orangescrum Is a Game Changer for Construction Companies in 2025Orangescrum
Orangescrum revolutionizes construction project management in 2025 with real-time collaboration, resource planning, task tracking, and workflow automation, boosting efficiency, transparency, and on-time project delivery.
WinRAR Crack for Windows (100% Working 2025)sh607827
copy and past on google ➤ ➤➤ https://hdlicense.org/ddl/
WinRAR Crack Free Download is a powerful archive manager that provides full support for RAR and ZIP archives and decompresses CAB, ARJ, LZH, TAR, GZ, ACE, UUE, .
How to Batch Export Lotus Notes NSF Emails to Outlook PST Easily?steaveroggers
Migrating from Lotus Notes to Outlook can be a complex and time-consuming task, especially when dealing with large volumes of NSF emails. This presentation provides a complete guide on how to batch export Lotus Notes NSF emails to Outlook PST format quickly and securely. It highlights the challenges of manual methods, the benefits of using an automated tool, and introduces eSoftTools NSF to PST Converter Software — a reliable solution designed to handle bulk email migrations efficiently. Learn about the software’s key features, step-by-step export process, system requirements, and how it ensures 100% data accuracy and folder structure preservation during migration. Make your email transition smoother, safer, and faster with the right approach.
Read More:- https://www.esofttools.com/nsf-to-pst-converter.html
Avast Premium Security Crack FREE Latest Version 2025mu394968
🌍📱👉COPY LINK & PASTE ON GOOGLE https://dr-kain-geera.info/👈🌍
Avast Premium Security is a paid subscription service that provides comprehensive online security and privacy protection for multiple devices. It includes features like antivirus, firewall, ransomware protection, and website scanning, all designed to safeguard against a wide range of online threats, according to Avast.
Key features of Avast Premium Security:
Antivirus: Protects against viruses, malware, and other malicious software, according to Avast.
Firewall: Controls network traffic and blocks unauthorized access to your devices, as noted by All About Cookies.
Ransomware protection: Helps prevent ransomware attacks, which can encrypt your files and hold them hostage.
Website scanning: Checks websites for malicious content before you visit them, according to Avast.
Email Guardian: Scans your emails for suspicious attachments and phishing attempts.
Multi-device protection: Covers up to 10 devices, including Windows, Mac, Android, and iOS, as stated by 2GO Software.
Privacy features: Helps protect your personal data and online privacy.
In essence, Avast Premium Security provides a robust suite of tools to keep your devices and online activity safe and secure, according to Avast.
⭕️➡️ FOR DOWNLOAD LINK : http://drfiles.net/ ⬅️⭕️
Maxon Cinema 4D 2025 is the latest version of the Maxon's 3D software, released in September 2024, and it builds upon previous versions with new tools for procedural modeling and animation, as well as enhancements to particle, Pyro, and rigid body simulations. CG Channel also mentions that Cinema 4D 2025.2, released in April 2025, focuses on spline tools and unified simulation enhancements.
Key improvements and features of Cinema 4D 2025 include:
Procedural Modeling: New tools and workflows for creating models procedurally, including fabric weave and constellation generators.
Procedural Animation: Field Driver tag for procedural animation.
Simulation Enhancements: Improved particle, Pyro, and rigid body simulations.
Spline Tools: Enhanced spline tools for motion graphics and animation, including spline modifiers from Rocket Lasso now included for all subscribers.
Unified Simulation & Particles: Refined physics-based effects and improved particle systems.
Boolean System: Modernized boolean system for precise 3D modeling.
Particle Node Modifier: New particle node modifier for creating particle scenes.
Learning Panel: Intuitive learning panel for new users.
Redshift Integration: Maxon now includes access to the full power of Redshift rendering for all new subscriptions.
In essence, Cinema 4D 2025 is a major update that provides artists with more powerful tools and workflows for creating 3D content, particularly in the fields of motion graphics, VFX, and visualization.
Scaling GraphRAG: Efficient Knowledge Retrieval for Enterprise AIdanshalev
If we were building a GenAI stack today, we'd start with one question: Can your retrieval system handle multi-hop logic?
Trick question, b/c most can’t. They treat retrieval as nearest-neighbor search.
Today, we discussed scaling #GraphRAG at AWS DevOps Day, and the takeaway is clear: VectorRAG is naive, lacks domain awareness, and can’t handle full dataset retrieval.
GraphRAG builds a knowledge graph from source documents, allowing for a deeper understanding of the data + higher accuracy.
FL Studio Producer Edition Crack 2025 Full Versiontahirabibi60507
Copy & Past Link 👉👉
http://drfiles.net/
FL Studio is a Digital Audio Workstation (DAW) software used for music production. It's developed by the Belgian company Image-Line. FL Studio allows users to create and edit music using a graphical user interface with a pattern-based music sequencer.
Adobe After Effects Crack FREE FRESH version 2025kashifyounis067
🌍📱👉COPY LINK & PASTE ON GOOGLE http://drfiles.net/ 👈🌍
Adobe After Effects is a software application used for creating motion graphics, special effects, and video compositing. It's widely used in TV and film post-production, as well as for creating visuals for online content, presentations, and more. While it can be used to create basic animations and designs, its primary strength lies in adding visual effects and motion to videos and graphics after they have been edited.
Here's a more detailed breakdown:
Motion Graphics:
.
After Effects is powerful for creating animated titles, transitions, and other visual elements to enhance the look of videos and presentations.
Visual Effects:
.
It's used extensively in film and television for creating special effects like green screen compositing, object manipulation, and other visual enhancements.
Video Compositing:
.
After Effects allows users to combine multiple video clips, images, and graphics to create a final, cohesive visual.
Animation:
.
It uses keyframes to create smooth, animated sequences, allowing for precise control over the movement and appearance of objects.
Integration with Adobe Creative Cloud:
.
After Effects is part of the Adobe Creative Cloud, a suite of software that includes other popular applications like Photoshop and Premiere Pro.
Post-Production Tool:
.
After Effects is primarily used in the post-production phase, meaning it's used to enhance the visuals after the initial editing of footage has been completed.
Join Ajay Sarpal and Miray Vu to learn about key Marketo Engage enhancements. Discover improved in-app Salesforce CRM connector statistics for easy monitoring of sync health and throughput. Explore new Salesforce CRM Synch Dashboards providing up-to-date insights into weekly activity usage, thresholds, and limits with drill-down capabilities. Learn about proactive notifications for both Salesforce CRM sync and product usage overages. Get an update on improved Salesforce CRM synch scale and reliability coming in Q2 2025.
Key Takeaways:
Improved Salesforce CRM User Experience: Learn how self-service visibility enhances satisfaction.
Utilize Salesforce CRM Synch Dashboards: Explore real-time weekly activity data.
Monitor Performance Against Limits: See threshold limits for each product level.
Get Usage Over-Limit Alerts: Receive notifications for exceeding thresholds.
Learn About Improved Salesforce CRM Scale: Understand upcoming cloud-based incremental sync.
Download YouTube By Click 2025 Free Full Activatedsaniamalik72555
Copy & Past Link 👉👉
https://dr-up-community.info/
"YouTube by Click" likely refers to the ByClick Downloader software, a video downloading and conversion tool, specifically designed to download content from YouTube and other video platforms. It allows users to download YouTube videos for offline viewing and to convert them to different formats.
PDF Reader Pro Crack Latest Version FREE Download 2025mu394968
🌍📱👉COPY LINK & PASTE ON GOOGLE https://dr-kain-geera.info/👈🌍
PDF Reader Pro is a software application, often referred to as an AI-powered PDF editor and converter, designed for viewing, editing, annotating, and managing PDF files. It supports various PDF functionalities like merging, splitting, converting, and protecting PDFs. Additionally, it can handle tasks such as creating fillable forms, adding digital signatures, and performing optical character recognition (OCR).
How Valletta helped healthcare SaaS to transform QA and compliance to grow wi...Egor Kaleynik
This case study explores how we partnered with a mid-sized U.S. healthcare SaaS provider to help them scale from a successful pilot phase to supporting over 10,000 users—while meeting strict HIPAA compliance requirements.
Faced with slow, manual testing cycles, frequent regression bugs, and looming audit risks, their growth was at risk. Their existing QA processes couldn’t keep up with the complexity of real-time biometric data handling, and earlier automation attempts had failed due to unreliable tools and fragmented workflows.
We stepped in to deliver a full QA and DevOps transformation. Our team replaced their fragile legacy tests with Testim’s self-healing automation, integrated Postman and OWASP ZAP into Jenkins pipelines for continuous API and security validation, and leveraged AWS Device Farm for real-device, region-specific compliance testing. Custom deployment scripts gave them control over rollouts without relying on heavy CI/CD infrastructure.
The result? Test cycle times were reduced from 3 days to just 8 hours, regression bugs dropped by 40%, and they passed their first HIPAA audit without issue—unlocking faster contract signings and enabling them to expand confidently. More than just a technical upgrade, this project embedded compliance into every phase of development, proving that SaaS providers in regulated industries can scale fast and stay secure.
This presentation explores code comprehension challenges in scientific programming based on a survey of 57 research scientists. It reveals that 57.9% of scientists have no formal training in writing readable code. Key findings highlight a "documentation paradox" where documentation is both the most common readability practice and the biggest challenge scientists face. The study identifies critical issues with naming conventions and code organization, noting that 100% of scientists agree readable code is essential for reproducible research. The research concludes with four key recommendations: expanding programming education for scientists, conducting targeted research on scientific code quality, developing specialized tools, and establishing clearer documentation guidelines for scientific software.
Presented at: The 33rd International Conference on Program Comprehension (ICPC '25)
Date of Conference: April 2025
Conference Location: Ottawa, Ontario, Canada
Preprint: https://arxiv.org/abs/2501.10037
Copy & Paste On Google >>> https://dr-up-community.info/
EASEUS Partition Master Final with Crack and Key Download If you are looking for a powerful and easy-to-use disk partitioning software,
14. Meet SQLd360
• FREE!
• No installation
• Can be executed any time
• Single step execution
• Extensive use of visualization
• Leverage existing Oracle features
1/29/17 14
21. Bind peeking, data distrib on histogram
• 1998 SQL Tuning (aka traces)
– Trace each exec and collect histgram info manually
• 2007 SQL tuning (aka SQLT)
– Provides every info necessary
– Straightforward to spot distribution
• But still requires to read a table of up to 2048 rows
1/29/17 21
23. SQL Y breaks SLA since Monday
• 1998 SQL Tuning (aka traces)
– Sorry, can’t help you
• 2007 SQL tuning (aka SQLT)
– Plan stability issue, second plan is takes 909 secs
PLAN_HASH_VALUE EXECS AVG_BUFFER_GETS AVG_ELAPSED_TIME_SECS
3716292209 43 195354839 909.592
4161077702 3 15562769 71.769
1/29/17 23
“But my SLA is
1000secs!!!!”
and PHV 3716… was
used before Monday
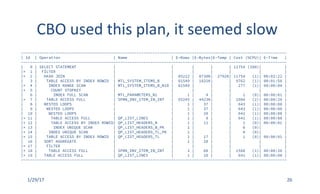
28. Old approaches make it hard
• 2007 SQL tuning (aka SQLT)
– You have the data, figure it out
…
SELECT sql_plan_hash_value, count(*), count(distinct sql_exec_id)
FROM dba_hist_active_sess_history
WHERE sql_id = ‘…’
GROUP BY sql_plan_hash_value
…
SELECT sql_exec_id, sql_exec_start, count(*)
FROM dba_hist_active_sess_history
WHERE sql_id = ‘…’
AND sql_plan_hash_value = …
GROUP BY sql_exec_id, sql_exec_start
…
<<another 10 SQL statements>>
1/29/17 28