


Standard measurements
- 1. Scalable performance monitoring of networks, servers and applications using standard metrics
- 24. Host Structures
- 25. Host Structures • CPU: load_one, load_five, load_fifteen, proc_run, proc_total, cpu_num, cpu_speed, uptime, cpu_user, cpu_nice, cpu_system, cpu_idle, cpu_wio, cpu_intr, cpu_sintr, interupts, contexts
- 26. Host Structures • CPU: load_one, load_five, load_fifteen, proc_run, proc_total, cpu_num, cpu_speed, uptime, cpu_user, cpu_nice, cpu_system, cpu_idle, cpu_wio, cpu_intr, cpu_sintr, interupts, contexts • Memory: mem_total, mem_free, mem_shared, mem_buffers, mem_cached, swap_total, swap_free, page_in, page_out, swap_in, swap_out
- 27. Host Structures • CPU: load_one, load_five, load_fifteen, proc_run, proc_total, cpu_num, cpu_speed, uptime, cpu_user, cpu_nice, cpu_system, cpu_idle, cpu_wio, cpu_intr, cpu_sintr, interupts, contexts • Memory: mem_total, mem_free, mem_shared, mem_buffers, mem_cached, swap_total, swap_free, page_in, page_out, swap_in, swap_out • Disk IO: disk_total, disk_free, part_max_used, reads, bytes_read, read_time, writes, bytes_written, write_time
- 28. Host Structures • CPU: load_one, load_five, load_fifteen, proc_run, proc_total, cpu_num, cpu_speed, uptime, cpu_user, cpu_nice, cpu_system, cpu_idle, cpu_wio, cpu_intr, cpu_sintr, interupts, contexts • Memory: mem_total, mem_free, mem_shared, mem_buffers, mem_cached, swap_total, swap_free, page_in, page_out, swap_in, swap_out • Disk IO: disk_total, disk_free, part_max_used, reads, bytes_read, read_time, writes, bytes_written, write_time • Network IO: bytes_in, packets_in, errs_in, drops_in, bytes_out, packet_out, errs_out, drops_out
- 42. Web Services
- 43. Web Services • HTTP Counters: method_option_count, method_get_count, method_head_count, method_post_count, method_put_count, method_delete_count, method_trace_count, method_connect_count, method_other_count, status_1xx_count, status_2xx_count, status_3xx_count, status_4xx_count, status_5xx_count, status_other_count
- 44. Web Services • HTTP Counters: method_option_count, method_get_count, method_head_count, method_post_count, method_put_count, method_delete_count, method_trace_count, method_connect_count, method_other_count, status_1xx_count, status_2xx_count, status_3xx_count, status_4xx_count, status_5xx_count, status_other_count • HTTP Operations: method, uri, host, referer, useragent, authuser, mime-type, bytes, duration, status
- 45. Web Services • HTTP Counters: method_option_count, method_get_count, method_head_count, method_post_count, method_put_count, method_delete_count, method_trace_count, method_connect_count, method_other_count, status_1xx_count, status_2xx_count, status_3xx_count, status_4xx_count, status_5xx_count, status_other_count • HTTP Operations: method, uri, host, referer, useragent, authuser, mime-type, bytes, duration, status sFlow supports random sampling of operations for scalability - centralized monitoring of thousands of web servers, load balancers etc.
- 46. Unified data model links network, servers and applications Sampled Transactions Transaction Counters APPLICATION TCP/UDP Socket CPU Memory I/O HOST Power, Temp. Adapter MACs Sampled Packet Headers I/F Counters NETWORK Power, Temp.
- 47. Unified data model links network, servers and applications Sampled Transactions Transaction Counters APPLICATION TCP/UDP Socket CPU Memory Packet Header I/O Source Destination HOST Power, Temp. TCP/UDP Socket TCP/UDP Socket Adapter MACs MAC Address MAC Address Sampled Packet Headers I/F Counters NETWORK Power, Temp.
- 48. Unified data model links network, servers and applications Sampled Transactions Transaction Counters APPLICATION TCP/UDP Socket CPU Memory Packet Header I/O Source Destination HOST Power, Temp. TCP/UDP Socket TCP/UDP Socket Adapter MACs MAC Address MAC Address Sampled Packet Headers I/F Counters NETWORK Power, Temp.
- 49. Unified data model links network, servers and applications Sampled Transactions Transaction Counters APPLICATION TCP/UDP Socket CPU Memory Packet Header I/O Source Destination HOST Power, Temp. TCP/UDP Socket TCP/UDP Socket Adapter MACs MAC Address MAC Address Sampled Packet Headers I/F Counters NETWORK Power, Temp.
- 51. Current Activities • sFlow.org standardizing metrics for core services (HTTP, Memcache, HDFS, NFS etc)
- 52. Current Activities • sFlow.org standardizing metrics for core services (HTTP, Memcache, HDFS, NFS etc) • Embed sFlow in operating systems, hypervisors and applications (Apache, NGINX, HAproxy, Memcached, Membase, Hadoop ...)
- 53. Current Activities • sFlow.org standardizing metrics for core services (HTTP, Memcache, HDFS, NFS etc) • Embed sFlow in operating systems, hypervisors and applications (Apache, NGINX, HAproxy, Memcached, Membase, Hadoop ...) • Native support for sFlow in performance monitoring tools (Ganglia, Nagios, Collectd, Munin, log file analyzers etc.)
- 54. Current Activities • sFlow.org standardizing metrics for core services (HTTP, Memcache, HDFS, NFS etc) • Embed sFlow in operating systems, hypervisors and applications (Apache, NGINX, HAproxy, Memcached, Membase, Hadoop ...) • Native support for sFlow in performance monitoring tools (Ganglia, Nagios, Collectd, Munin, log file analyzers etc.) • Integrated network, server and application visibility
Editor's Notes
- #2: Hi. My name is Peter Phaal and I am one of the authors of the sFlow standard. \n\nIn this talk we will be looking at some of the scalability challenges in current performance monitoring approaches and explore how standard performance metrics can enhance the scalability of network, server and application monitoring systems.\n\nFirst, let me quickly briefly introduce sFlow.\n
- #3: sFlow is a multi-vendor industry standard for monitoring performance in high-speed switched networks. The standard identifies a common set of metrics and provides an efficient way to centrally monitor network performance.\n
- #4: sFlow is widely supported by network vendors, allowing network managers to choose from a wide variety of open source and commercial performance management applications.\n\nVirtualization and scale-out applications are transforming network architectures, closely linking network and system performance. In order to address this challenge, sFlow has been extended to include server performance monitoring. \n\nTo understand how sFlow can help simplify performance management and improve scalability, it is worth looking at current approaches to server performance monitoring.\n\n\n
- #5: sFlow is widely supported by network vendors, allowing network managers to choose from a wide variety of open source and commercial performance management applications.\n\nVirtualization and scale-out applications are transforming network architectures, closely linking network and system performance. In order to address this challenge, sFlow has been extended to include server performance monitoring. \n\nTo understand how sFlow can help simplify performance management and improve scalability, it is worth looking at current approaches to server performance monitoring.\n\n\n
- #6: sFlow is widely supported by network vendors, allowing network managers to choose from a wide variety of open source and commercial performance management applications.\n\nVirtualization and scale-out applications are transforming network architectures, closely linking network and system performance. In order to address this challenge, sFlow has been extended to include server performance monitoring. \n\nTo understand how sFlow can help simplify performance management and improve scalability, it is worth looking at current approaches to server performance monitoring.\n\n\n
- #7: sFlow is widely supported by network vendors, allowing network managers to choose from a wide variety of open source and commercial performance management applications.\n\nVirtualization and scale-out applications are transforming network architectures, closely linking network and system performance. In order to address this challenge, sFlow has been extended to include server performance monitoring. \n\nTo understand how sFlow can help simplify performance management and improve scalability, it is worth looking at current approaches to server performance monitoring.\n\n\n
- #8: sFlow is widely supported by network vendors, allowing network managers to choose from a wide variety of open source and commercial performance management applications.\n\nVirtualization and scale-out applications are transforming network architectures, closely linking network and system performance. In order to address this challenge, sFlow has been extended to include server performance monitoring. \n\nTo understand how sFlow can help simplify performance management and improve scalability, it is worth looking at current approaches to server performance monitoring.\n\n\n
- #9: sFlow is widely supported by network vendors, allowing network managers to choose from a wide variety of open source and commercial performance management applications.\n\nVirtualization and scale-out applications are transforming network architectures, closely linking network and system performance. In order to address this challenge, sFlow has been extended to include server performance monitoring. \n\nTo understand how sFlow can help simplify performance management and improve scalability, it is worth looking at current approaches to server performance monitoring.\n\n\n
- #10: sFlow is widely supported by network vendors, allowing network managers to choose from a wide variety of open source and commercial performance management applications.\n\nVirtualization and scale-out applications are transforming network architectures, closely linking network and system performance. In order to address this challenge, sFlow has been extended to include server performance monitoring. \n\nTo understand how sFlow can help simplify performance management and improve scalability, it is worth looking at current approaches to server performance monitoring.\n\n\n
- #11: sFlow is widely supported by network vendors, allowing network managers to choose from a wide variety of open source and commercial performance management applications.\n\nVirtualization and scale-out applications are transforming network architectures, closely linking network and system performance. In order to address this challenge, sFlow has been extended to include server performance monitoring. \n\nTo understand how sFlow can help simplify performance management and improve scalability, it is worth looking at current approaches to server performance monitoring.\n\n\n
- #12: sFlow is widely supported by network vendors, allowing network managers to choose from a wide variety of open source and commercial performance management applications.\n\nVirtualization and scale-out applications are transforming network architectures, closely linking network and system performance. In order to address this challenge, sFlow has been extended to include server performance monitoring. \n\nTo understand how sFlow can help simplify performance management and improve scalability, it is worth looking at current approaches to server performance monitoring.\n\n\n
- #13: sFlow is widely supported by network vendors, allowing network managers to choose from a wide variety of open source and commercial performance management applications.\n\nVirtualization and scale-out applications are transforming network architectures, closely linking network and system performance. In order to address this challenge, sFlow has been extended to include server performance monitoring. \n\nTo understand how sFlow can help simplify performance management and improve scalability, it is worth looking at current approaches to server performance monitoring.\n\n\n
- #14: sFlow is widely supported by network vendors, allowing network managers to choose from a wide variety of open source and commercial performance management applications.\n\nVirtualization and scale-out applications are transforming network architectures, closely linking network and system performance. In order to address this challenge, sFlow has been extended to include server performance monitoring. \n\nTo understand how sFlow can help simplify performance management and improve scalability, it is worth looking at current approaches to server performance monitoring.\n\n\n
- #15: sFlow is widely supported by network vendors, allowing network managers to choose from a wide variety of open source and commercial performance management applications.\n\nVirtualization and scale-out applications are transforming network architectures, closely linking network and system performance. In order to address this challenge, sFlow has been extended to include server performance monitoring. \n\nTo understand how sFlow can help simplify performance management and improve scalability, it is worth looking at current approaches to server performance monitoring.\n\n\n
- #16: sFlow is widely supported by network vendors, allowing network managers to choose from a wide variety of open source and commercial performance management applications.\n\nVirtualization and scale-out applications are transforming network architectures, closely linking network and system performance. In order to address this challenge, sFlow has been extended to include server performance monitoring. \n\nTo understand how sFlow can help simplify performance management and improve scalability, it is worth looking at current approaches to server performance monitoring.\n\n\n
- #17: sFlow is widely supported by network vendors, allowing network managers to choose from a wide variety of open source and commercial performance management applications.\n\nVirtualization and scale-out applications are transforming network architectures, closely linking network and system performance. In order to address this challenge, sFlow has been extended to include server performance monitoring. \n\nTo understand how sFlow can help simplify performance management and improve scalability, it is worth looking at current approaches to server performance monitoring.\n\n\n
- #18: sFlow is widely supported by network vendors, allowing network managers to choose from a wide variety of open source and commercial performance management applications.\n\nVirtualization and scale-out applications are transforming network architectures, closely linking network and system performance. In order to address this challenge, sFlow has been extended to include server performance monitoring. \n\nTo understand how sFlow can help simplify performance management and improve scalability, it is worth looking at current approaches to server performance monitoring.\n\n\n
- #19: sFlow is widely supported by network vendors, allowing network managers to choose from a wide variety of open source and commercial performance management applications.\n\nVirtualization and scale-out applications are transforming network architectures, closely linking network and system performance. In order to address this challenge, sFlow has been extended to include server performance monitoring. \n\nTo understand how sFlow can help simplify performance management and improve scalability, it is worth looking at current approaches to server performance monitoring.\n\n\n
- #20: sFlow is widely supported by network vendors, allowing network managers to choose from a wide variety of open source and commercial performance management applications.\n\nVirtualization and scale-out applications are transforming network architectures, closely linking network and system performance. In order to address this challenge, sFlow has been extended to include server performance monitoring. \n\nTo understand how sFlow can help simplify performance management and improve scalability, it is worth looking at current approaches to server performance monitoring.\n\n\n
- #21: sFlow is widely supported by network vendors, allowing network managers to choose from a wide variety of open source and commercial performance management applications.\n\nVirtualization and scale-out applications are transforming network architectures, closely linking network and system performance. In order to address this challenge, sFlow has been extended to include server performance monitoring. \n\nTo understand how sFlow can help simplify performance management and improve scalability, it is worth looking at current approaches to server performance monitoring.\n\n\n
- #22: sFlow is widely supported by network vendors, allowing network managers to choose from a wide variety of open source and commercial performance management applications.\n\nVirtualization and scale-out applications are transforming network architectures, closely linking network and system performance. In order to address this challenge, sFlow has been extended to include server performance monitoring. \n\nTo understand how sFlow can help simplify performance management and improve scalability, it is worth looking at current approaches to server performance monitoring.\n\n\n
- #23: sFlow is widely supported by network vendors, allowing network managers to choose from a wide variety of open source and commercial performance management applications.\n\nVirtualization and scale-out applications are transforming network architectures, closely linking network and system performance. In order to address this challenge, sFlow has been extended to include server performance monitoring. \n\nTo understand how sFlow can help simplify performance management and improve scalability, it is worth looking at current approaches to server performance monitoring.\n\n\n
- #24: sFlow is widely supported by network vendors, allowing network managers to choose from a wide variety of open source and commercial performance management applications.\n\nVirtualization and scale-out applications are transforming network architectures, closely linking network and system performance. In order to address this challenge, sFlow has been extended to include server performance monitoring. \n\nTo understand how sFlow can help simplify performance management and improve scalability, it is worth looking at current approaches to server performance monitoring.\n\n\n
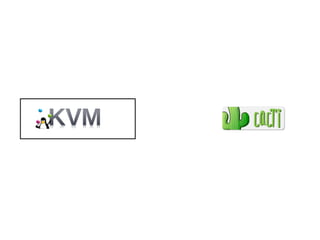
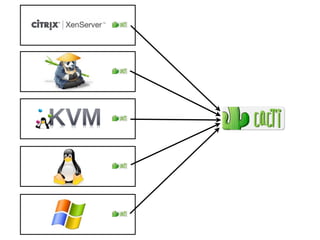
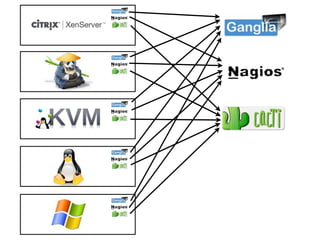
- #25: Let’s start with something simple, monitoring KVM servers using Cacti. Setting up the monitoring system involves installing agents on the servers and configuring Cacti to collect data. Next you decide that you would also like to monitor additional platforms, including: Linux, Xen, Citrix XenServer and Windows. Each new platform requires an agent and additional configuration before it can be monitored.\n\nAfter a while you decide to deploy Nagios to monitor status and generate events. This involves additional agents for each platform and additional configuration to monitor each server. Next Ganglia is installed to monitor the performance of server clusters, requiring additional agents and configuration. Each new tool provides distinct capabilities, but at the cost of operational complexity and overhead associated with deploying additional agents.\n
- #26: Let’s start with something simple, monitoring KVM servers using Cacti. Setting up the monitoring system involves installing agents on the servers and configuring Cacti to collect data. Next you decide that you would also like to monitor additional platforms, including: Linux, Xen, Citrix XenServer and Windows. Each new platform requires an agent and additional configuration before it can be monitored.\n\nAfter a while you decide to deploy Nagios to monitor status and generate events. This involves additional agents for each platform and additional configuration to monitor each server. Next Ganglia is installed to monitor the performance of server clusters, requiring additional agents and configuration. Each new tool provides distinct capabilities, but at the cost of operational complexity and overhead associated with deploying additional agents.\n
- #27: Let’s start with something simple, monitoring KVM servers using Cacti. Setting up the monitoring system involves installing agents on the servers and configuring Cacti to collect data. Next you decide that you would also like to monitor additional platforms, including: Linux, Xen, Citrix XenServer and Windows. Each new platform requires an agent and additional configuration before it can be monitored.\n\nAfter a while you decide to deploy Nagios to monitor status and generate events. This involves additional agents for each platform and additional configuration to monitor each server. Next Ganglia is installed to monitor the performance of server clusters, requiring additional agents and configuration. Each new tool provides distinct capabilities, but at the cost of operational complexity and overhead associated with deploying additional agents.\n
- #28: Let’s start with something simple, monitoring KVM servers using Cacti. Setting up the monitoring system involves installing agents on the servers and configuring Cacti to collect data. Next you decide that you would also like to monitor additional platforms, including: Linux, Xen, Citrix XenServer and Windows. Each new platform requires an agent and additional configuration before it can be monitored.\n\nAfter a while you decide to deploy Nagios to monitor status and generate events. This involves additional agents for each platform and additional configuration to monitor each server. Next Ganglia is installed to monitor the performance of server clusters, requiring additional agents and configuration. Each new tool provides distinct capabilities, but at the cost of operational complexity and overhead associated with deploying additional agents.\n
- #29: Let’s start with something simple, monitoring KVM servers using Cacti. Setting up the monitoring system involves installing agents on the servers and configuring Cacti to collect data. Next you decide that you would also like to monitor additional platforms, including: Linux, Xen, Citrix XenServer and Windows. Each new platform requires an agent and additional configuration before it can be monitored.\n\nAfter a while you decide to deploy Nagios to monitor status and generate events. This involves additional agents for each platform and additional configuration to monitor each server. Next Ganglia is installed to monitor the performance of server clusters, requiring additional agents and configuration. Each new tool provides distinct capabilities, but at the cost of operational complexity and overhead associated with deploying additional agents.\n
- #30: Let’s start with something simple, monitoring KVM servers using Cacti. Setting up the monitoring system involves installing agents on the servers and configuring Cacti to collect data. Next you decide that you would also like to monitor additional platforms, including: Linux, Xen, Citrix XenServer and Windows. Each new platform requires an agent and additional configuration before it can be monitored.\n\nAfter a while you decide to deploy Nagios to monitor status and generate events. This involves additional agents for each platform and additional configuration to monitor each server. Next Ganglia is installed to monitor the performance of server clusters, requiring additional agents and configuration. Each new tool provides distinct capabilities, but at the cost of operational complexity and overhead associated with deploying additional agents.\n
- #31: Let’s start with something simple, monitoring KVM servers using Cacti. Setting up the monitoring system involves installing agents on the servers and configuring Cacti to collect data. Next you decide that you would also like to monitor additional platforms, including: Linux, Xen, Citrix XenServer and Windows. Each new platform requires an agent and additional configuration before it can be monitored.\n\nAfter a while you decide to deploy Nagios to monitor status and generate events. This involves additional agents for each platform and additional configuration to monitor each server. Next Ganglia is installed to monitor the performance of server clusters, requiring additional agents and configuration. Each new tool provides distinct capabilities, but at the cost of operational complexity and overhead associated with deploying additional agents.\n
- #32: Let’s start with something simple, monitoring KVM servers using Cacti. Setting up the monitoring system involves installing agents on the servers and configuring Cacti to collect data. Next you decide that you would also like to monitor additional platforms, including: Linux, Xen, Citrix XenServer and Windows. Each new platform requires an agent and additional configuration before it can be monitored.\n\nAfter a while you decide to deploy Nagios to monitor status and generate events. This involves additional agents for each platform and additional configuration to monitor each server. Next Ganglia is installed to monitor the performance of server clusters, requiring additional agents and configuration. Each new tool provides distinct capabilities, but at the cost of operational complexity and overhead associated with deploying additional agents.\n
- #33: Let’s start with something simple, monitoring KVM servers using Cacti. Setting up the monitoring system involves installing agents on the servers and configuring Cacti to collect data. Next you decide that you would also like to monitor additional platforms, including: Linux, Xen, Citrix XenServer and Windows. Each new platform requires an agent and additional configuration before it can be monitored.\n\nAfter a while you decide to deploy Nagios to monitor status and generate events. This involves additional agents for each platform and additional configuration to monitor each server. Next Ganglia is installed to monitor the performance of server clusters, requiring additional agents and configuration. Each new tool provides distinct capabilities, but at the cost of operational complexity and overhead associated with deploying additional agents.\n
- #34: Let’s start with something simple, monitoring KVM servers using Cacti. Setting up the monitoring system involves installing agents on the servers and configuring Cacti to collect data. Next you decide that you would also like to monitor additional platforms, including: Linux, Xen, Citrix XenServer and Windows. Each new platform requires an agent and additional configuration before it can be monitored.\n\nAfter a while you decide to deploy Nagios to monitor status and generate events. This involves additional agents for each platform and additional configuration to monitor each server. Next Ganglia is installed to monitor the performance of server clusters, requiring additional agents and configuration. Each new tool provides distinct capabilities, but at the cost of operational complexity and overhead associated with deploying additional agents.\n
- #35: Let’s start with something simple, monitoring KVM servers using Cacti. Setting up the monitoring system involves installing agents on the servers and configuring Cacti to collect data. Next you decide that you would also like to monitor additional platforms, including: Linux, Xen, Citrix XenServer and Windows. Each new platform requires an agent and additional configuration before it can be monitored.\n\nAfter a while you decide to deploy Nagios to monitor status and generate events. This involves additional agents for each platform and additional configuration to monitor each server. Next Ganglia is installed to monitor the performance of server clusters, requiring additional agents and configuration. Each new tool provides distinct capabilities, but at the cost of operational complexity and overhead associated with deploying additional agents.\n
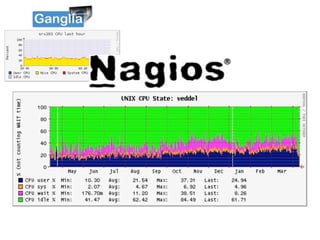
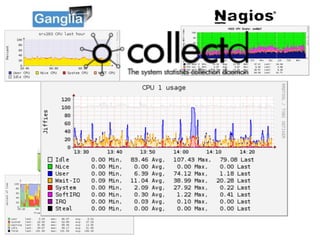
- #36: Looking at each of the performance monitoring tools in a little more detail. This is a chart showing CPU utilization in:\nGanglia, \nNagios, \nCacti, \nCollectd \nand Munin. No prizes for spotting the similarities between the charts.\n\nIt is clear that there is a common set of metrics that is generally accepted for system performance monitoring and that these metrics deliver the core functionality in performance monitoring tools. It is these core statistics that are now part of the sFlow standard.\n
- #37: Looking at each of the performance monitoring tools in a little more detail. This is a chart showing CPU utilization in:\nGanglia, \nNagios, \nCacti, \nCollectd \nand Munin. No prizes for spotting the similarities between the charts.\n\nIt is clear that there is a common set of metrics that is generally accepted for system performance monitoring and that these metrics deliver the core functionality in performance monitoring tools. It is these core statistics that are now part of the sFlow standard.\n
- #38: Looking at each of the performance monitoring tools in a little more detail. This is a chart showing CPU utilization in:\nGanglia, \nNagios, \nCacti, \nCollectd \nand Munin. No prizes for spotting the similarities between the charts.\n\nIt is clear that there is a common set of metrics that is generally accepted for system performance monitoring and that these metrics deliver the core functionality in performance monitoring tools. It is these core statistics that are now part of the sFlow standard.\n
- #39: Looking at each of the performance monitoring tools in a little more detail. This is a chart showing CPU utilization in:\nGanglia, \nNagios, \nCacti, \nCollectd \nand Munin. No prizes for spotting the similarities between the charts.\n\nIt is clear that there is a common set of metrics that is generally accepted for system performance monitoring and that these metrics deliver the core functionality in performance monitoring tools. It is these core statistics that are now part of the sFlow standard.\n
- #40: Looking at each of the performance monitoring tools in a little more detail. This is a chart showing CPU utilization in:\nGanglia, \nNagios, \nCacti, \nCollectd \nand Munin. No prizes for spotting the similarities between the charts.\n\nIt is clear that there is a common set of metrics that is generally accepted for system performance monitoring and that these metrics deliver the core functionality in performance monitoring tools. It is these core statistics that are now part of the sFlow standard.\n
- #41: Looking at each of the performance monitoring tools in a little more detail. This is a chart showing CPU utilization in:\nGanglia, \nNagios, \nCacti, \nCollectd \nand Munin. No prizes for spotting the similarities between the charts.\n\nIt is clear that there is a common set of metrics that is generally accepted for system performance monitoring and that these metrics deliver the core functionality in performance monitoring tools. It is these core statistics that are now part of the sFlow standard.\n
- #42: Looking at each of the performance monitoring tools in a little more detail. This is a chart showing CPU utilization in:\nGanglia, \nNagios, \nCacti, \nCollectd \nand Munin. No prizes for spotting the similarities between the charts.\n\nIt is clear that there is a common set of metrics that is generally accepted for system performance monitoring and that these metrics deliver the core functionality in performance monitoring tools. It is these core statistics that are now part of the sFlow standard.\n
- #43: Looking at each of the performance monitoring tools in a little more detail. This is a chart showing CPU utilization in:\nGanglia, \nNagios, \nCacti, \nCollectd \nand Munin. No prizes for spotting the similarities between the charts.\n\nIt is clear that there is a common set of metrics that is generally accepted for system performance monitoring and that these metrics deliver the core functionality in performance monitoring tools. It is these core statistics that are now part of the sFlow standard.\n
- #44: Looking at each of the performance monitoring tools in a little more detail. This is a chart showing CPU utilization in:\nGanglia, \nNagios, \nCacti, \nCollectd \nand Munin. No prizes for spotting the similarities between the charts.\n\nIt is clear that there is a common set of metrics that is generally accepted for system performance monitoring and that these metrics deliver the core functionality in performance monitoring tools. It is these core statistics that are now part of the sFlow standard.\n
- #45: Looking at each of the performance monitoring tools in a little more detail. This is a chart showing CPU utilization in:\nGanglia, \nNagios, \nCacti, \nCollectd \nand Munin. No prizes for spotting the similarities between the charts.\n\nIt is clear that there is a common set of metrics that is generally accepted for system performance monitoring and that these metrics deliver the core functionality in performance monitoring tools. It is these core statistics that are now part of the sFlow standard.\n
- #46: Looking at each of the performance monitoring tools in a little more detail. This is a chart showing CPU utilization in:\nGanglia, \nNagios, \nCacti, \nCollectd \nand Munin. No prizes for spotting the similarities between the charts.\n\nIt is clear that there is a common set of metrics that is generally accepted for system performance monitoring and that these metrics deliver the core functionality in performance monitoring tools. It is these core statistics that are now part of the sFlow standard.\n
- #47: Looking at each of the performance monitoring tools in a little more detail. This is a chart showing CPU utilization in:\nGanglia, \nNagios, \nCacti, \nCollectd \nand Munin. No prizes for spotting the similarities between the charts.\n\nIt is clear that there is a common set of metrics that is generally accepted for system performance monitoring and that these metrics deliver the core functionality in performance monitoring tools. It is these core statistics that are now part of the sFlow standard.\n
- #48: Looking at each of the performance monitoring tools in a little more detail. This is a chart showing CPU utilization in:\nGanglia, \nNagios, \nCacti, \nCollectd \nand Munin. No prizes for spotting the similarities between the charts.\n\nIt is clear that there is a common set of metrics that is generally accepted for system performance monitoring and that these metrics deliver the core functionality in performance monitoring tools. It is these core statistics that are now part of the sFlow standard.\n
- #49: Looking at each of the performance monitoring tools in a little more detail. This is a chart showing CPU utilization in:\nGanglia, \nNagios, \nCacti, \nCollectd \nand Munin. No prizes for spotting the similarities between the charts.\n\nIt is clear that there is a common set of metrics that is generally accepted for system performance monitoring and that these metrics deliver the core functionality in performance monitoring tools. It is these core statistics that are now part of the sFlow standard.\n
- #50: Looking at each of the performance monitoring tools in a little more detail. This is a chart showing CPU utilization in:\nGanglia, \nNagios, \nCacti, \nCollectd \nand Munin. No prizes for spotting the similarities between the charts.\n\nIt is clear that there is a common set of metrics that is generally accepted for system performance monitoring and that these metrics deliver the core functionality in performance monitoring tools. It is these core statistics that are now part of the sFlow standard.\n
- #51: The standard sFlow metrics cover \nCPU, \nMemory, \nDisk IO and \nNetwork IO. \n\nFor anyone familiar with Ganglia, these metrics should be instantly recognizable. The choice of metrics was heavily influenced by the Ganglia project which has a developed a mature set set of core metrics that can be gathered from a wide range of operation systems.\n
- #52: The standard sFlow metrics cover \nCPU, \nMemory, \nDisk IO and \nNetwork IO. \n\nFor anyone familiar with Ganglia, these metrics should be instantly recognizable. The choice of metrics was heavily influenced by the Ganglia project which has a developed a mature set set of core metrics that can be gathered from a wide range of operation systems.\n
- #53: The standard sFlow metrics cover \nCPU, \nMemory, \nDisk IO and \nNetwork IO. \n\nFor anyone familiar with Ganglia, these metrics should be instantly recognizable. The choice of metrics was heavily influenced by the Ganglia project which has a developed a mature set set of core metrics that can be gathered from a wide range of operation systems.\n
- #54: The standard sFlow metrics cover \nCPU, \nMemory, \nDisk IO and \nNetwork IO. \n\nFor anyone familiar with Ganglia, these metrics should be instantly recognizable. The choice of metrics was heavily influenced by the Ganglia project which has a developed a mature set set of core metrics that can be gathered from a wide range of operation systems.\n
- #55: The Host sFlow project is hosted on Sourceforge and provides an open source agent implementing the sFlow standard. \n\nThe agent currently runs on \nLinux, \nFreeBSD \nand Windows systems, \n\nalong with KVM \nand Xen based hypervisors.\n
- #56: Lets see how standard metrics transform performance monitoring. In this case, sFlow agents can be deployed as a standard component of each platform.\n\nDeploying a performance monitoring application simply involves turning on the already deployed agents. Additional management tools can share the same standard measurement stream so there is no additional overhead involved in adding applications. Standard metrics ensure consistency between measurements displayed on the different tools making it easier to transition between tools.\n\nStandard agents allow performance monitoring tools to focus on data analysis and presentation, rather than the complexity of maintaining agents on different platforms. Pooling resources on the agent side eliminates wasteful duplication and greatly simplifies operational deployment.\n\nIn addition, standard agents lower the barrier to entry, making it easier to create and deploy innovative performance management tools.\n
- #57: Lets see how standard metrics transform performance monitoring. In this case, sFlow agents can be deployed as a standard component of each platform.\n\nDeploying a performance monitoring application simply involves turning on the already deployed agents. Additional management tools can share the same standard measurement stream so there is no additional overhead involved in adding applications. Standard metrics ensure consistency between measurements displayed on the different tools making it easier to transition between tools.\n\nStandard agents allow performance monitoring tools to focus on data analysis and presentation, rather than the complexity of maintaining agents on different platforms. Pooling resources on the agent side eliminates wasteful duplication and greatly simplifies operational deployment.\n\nIn addition, standard agents lower the barrier to entry, making it easier to create and deploy innovative performance management tools.\n
- #58: Lets see how standard metrics transform performance monitoring. In this case, sFlow agents can be deployed as a standard component of each platform.\n\nDeploying a performance monitoring application simply involves turning on the already deployed agents. Additional management tools can share the same standard measurement stream so there is no additional overhead involved in adding applications. Standard metrics ensure consistency between measurements displayed on the different tools making it easier to transition between tools.\n\nStandard agents allow performance monitoring tools to focus on data analysis and presentation, rather than the complexity of maintaining agents on different platforms. Pooling resources on the agent side eliminates wasteful duplication and greatly simplifies operational deployment.\n\nIn addition, standard agents lower the barrier to entry, making it easier to create and deploy innovative performance management tools.\n
- #59: Lets see how standard metrics transform performance monitoring. In this case, sFlow agents can be deployed as a standard component of each platform.\n\nDeploying a performance monitoring application simply involves turning on the already deployed agents. Additional management tools can share the same standard measurement stream so there is no additional overhead involved in adding applications. Standard metrics ensure consistency between measurements displayed on the different tools making it easier to transition between tools.\n\nStandard agents allow performance monitoring tools to focus on data analysis and presentation, rather than the complexity of maintaining agents on different platforms. Pooling resources on the agent side eliminates wasteful duplication and greatly simplifies operational deployment.\n\nIn addition, standard agents lower the barrier to entry, making it easier to create and deploy innovative performance management tools.\n
- #60: Lets see how standard metrics transform performance monitoring. In this case, sFlow agents can be deployed as a standard component of each platform.\n\nDeploying a performance monitoring application simply involves turning on the already deployed agents. Additional management tools can share the same standard measurement stream so there is no additional overhead involved in adding applications. Standard metrics ensure consistency between measurements displayed on the different tools making it easier to transition between tools.\n\nStandard agents allow performance monitoring tools to focus on data analysis and presentation, rather than the complexity of maintaining agents on different platforms. Pooling resources on the agent side eliminates wasteful duplication and greatly simplifies operational deployment.\n\nIn addition, standard agents lower the barrier to entry, making it easier to create and deploy innovative performance management tools.\n
- #61: Lets see how standard metrics transform performance monitoring. In this case, sFlow agents can be deployed as a standard component of each platform.\n\nDeploying a performance monitoring application simply involves turning on the already deployed agents. Additional management tools can share the same standard measurement stream so there is no additional overhead involved in adding applications. Standard metrics ensure consistency between measurements displayed on the different tools making it easier to transition between tools.\n\nStandard agents allow performance monitoring tools to focus on data analysis and presentation, rather than the complexity of maintaining agents on different platforms. Pooling resources on the agent side eliminates wasteful duplication and greatly simplifies operational deployment.\n\nIn addition, standard agents lower the barrier to entry, making it easier to create and deploy innovative performance management tools.\n
- #62: Lets see how standard metrics transform performance monitoring. In this case, sFlow agents can be deployed as a standard component of each platform.\n\nDeploying a performance monitoring application simply involves turning on the already deployed agents. Additional management tools can share the same standard measurement stream so there is no additional overhead involved in adding applications. Standard metrics ensure consistency between measurements displayed on the different tools making it easier to transition between tools.\n\nStandard agents allow performance monitoring tools to focus on data analysis and presentation, rather than the complexity of maintaining agents on different platforms. Pooling resources on the agent side eliminates wasteful duplication and greatly simplifies operational deployment.\n\nIn addition, standard agents lower the barrier to entry, making it easier to create and deploy innovative performance management tools.\n
- #63: Lets see how standard metrics transform performance monitoring. In this case, sFlow agents can be deployed as a standard component of each platform.\n\nDeploying a performance monitoring application simply involves turning on the already deployed agents. Additional management tools can share the same standard measurement stream so there is no additional overhead involved in adding applications. Standard metrics ensure consistency between measurements displayed on the different tools making it easier to transition between tools.\n\nStandard agents allow performance monitoring tools to focus on data analysis and presentation, rather than the complexity of maintaining agents on different platforms. Pooling resources on the agent side eliminates wasteful duplication and greatly simplifies operational deployment.\n\nIn addition, standard agents lower the barrier to entry, making it easier to create and deploy innovative performance management tools.\n
- #64: Lets see how standard metrics transform performance monitoring. In this case, sFlow agents can be deployed as a standard component of each platform.\n\nDeploying a performance monitoring application simply involves turning on the already deployed agents. Additional management tools can share the same standard measurement stream so there is no additional overhead involved in adding applications. Standard metrics ensure consistency between measurements displayed on the different tools making it easier to transition between tools.\n\nStandard agents allow performance monitoring tools to focus on data analysis and presentation, rather than the complexity of maintaining agents on different platforms. Pooling resources on the agent side eliminates wasteful duplication and greatly simplifies operational deployment.\n\nIn addition, standard agents lower the barrier to entry, making it easier to create and deploy innovative performance management tools.\n
- #65: Lets see how standard metrics transform performance monitoring. In this case, sFlow agents can be deployed as a standard component of each platform.\n\nDeploying a performance monitoring application simply involves turning on the already deployed agents. Additional management tools can share the same standard measurement stream so there is no additional overhead involved in adding applications. Standard metrics ensure consistency between measurements displayed on the different tools making it easier to transition between tools.\n\nStandard agents allow performance monitoring tools to focus on data analysis and presentation, rather than the complexity of maintaining agents on different platforms. Pooling resources on the agent side eliminates wasteful duplication and greatly simplifies operational deployment.\n\nIn addition, standard agents lower the barrier to entry, making it easier to create and deploy innovative performance management tools.\n
- #66: Lets see how standard metrics transform performance monitoring. In this case, sFlow agents can be deployed as a standard component of each platform.\n\nDeploying a performance monitoring application simply involves turning on the already deployed agents. Additional management tools can share the same standard measurement stream so there is no additional overhead involved in adding applications. Standard metrics ensure consistency between measurements displayed on the different tools making it easier to transition between tools.\n\nStandard agents allow performance monitoring tools to focus on data analysis and presentation, rather than the complexity of maintaining agents on different platforms. Pooling resources on the agent side eliminates wasteful duplication and greatly simplifies operational deployment.\n\nIn addition, standard agents lower the barrier to entry, making it easier to create and deploy innovative performance management tools.\n
- #67: Another area that’s ripe for standardization is web services. Current efforts in sFlow.org are focussing on the key metrics that can describe the performance of web servers, load balancers etc.\n\nA standard set of counters is only part of the story. The sFlow protocol also provides a way to monitor HTTP operations. Defining a standard set of transaction attributes allows sFlow to efficiently report on web activity across larger server farms. Here again, there is already broad consensus on the set of attributes. The combined log file format is widely supported. Exporting the same data using sFlow provides real-time, centralized monitoring and can easily be converted back into a log file for existing tools as well as allowing a new class of real-time log analyzers to be created for performance monitoring.\n\nThe sFlow standard also support statistical sampling. By randomly selecting 1 in N records, you can centrally monitor the largest of web services.\n
- #68: Another area that’s ripe for standardization is web services. Current efforts in sFlow.org are focussing on the key metrics that can describe the performance of web servers, load balancers etc.\n\nA standard set of counters is only part of the story. The sFlow protocol also provides a way to monitor HTTP operations. Defining a standard set of transaction attributes allows sFlow to efficiently report on web activity across larger server farms. Here again, there is already broad consensus on the set of attributes. The combined log file format is widely supported. Exporting the same data using sFlow provides real-time, centralized monitoring and can easily be converted back into a log file for existing tools as well as allowing a new class of real-time log analyzers to be created for performance monitoring.\n\nThe sFlow standard also support statistical sampling. By randomly selecting 1 in N records, you can centrally monitor the largest of web services.\n
- #69: Another area that’s ripe for standardization is web services. Current efforts in sFlow.org are focussing on the key metrics that can describe the performance of web servers, load balancers etc.\n\nA standard set of counters is only part of the story. The sFlow protocol also provides a way to monitor HTTP operations. Defining a standard set of transaction attributes allows sFlow to efficiently report on web activity across larger server farms. Here again, there is already broad consensus on the set of attributes. The combined log file format is widely supported. Exporting the same data using sFlow provides real-time, centralized monitoring and can easily be converted back into a log file for existing tools as well as allowing a new class of real-time log analyzers to be created for performance monitoring.\n\nThe sFlow standard also support statistical sampling. By randomly selecting 1 in N records, you can centrally monitor the largest of web services.\n
- #70: Looking at the big picture, sFlow doesn’t just define performance metrics and a scalable method for collecting them.\n\nAn important part of the standard is a data model that links network, host and application metrics together. For example, when exporting host metrics the host also exports its MAC addresses, allowing network and server performance to be linked. When an application transaction is exported, the layer 4 socket associated with the transaction is also included, providing a way to link network and application performance.\n
- #71: Looking at the big picture, sFlow doesn’t just define performance metrics and a scalable method for collecting them.\n\nAn important part of the standard is a data model that links network, host and application metrics together. For example, when exporting host metrics the host also exports its MAC addresses, allowing network and server performance to be linked. When an application transaction is exported, the layer 4 socket associated with the transaction is also included, providing a way to link network and application performance.\n
- #72: Looking at the big picture, sFlow doesn’t just define performance metrics and a scalable method for collecting them.\n\nAn important part of the standard is a data model that links network, host and application metrics together. For example, when exporting host metrics the host also exports its MAC addresses, allowing network and server performance to be linked. When an application transaction is exported, the layer 4 socket associated with the transaction is also included, providing a way to link network and application performance.\n
- #73: I would like to finish by describing current areas of activity and invite participation from the broader comminity.\n\nI’ve already touched on some of the areas where standard metrics are being defined. Other areas include memcache, Hadoop and networked storage.\n\nAs the metrics become settled, they need to be implemented within the different operating systems, hypervisors and applications so that they can be efficiently deployed in production environments.\n\nNative support for sFlow in existing performance management applications is needed to deliver value from the instrumentation.\n\nFinally, a single measurement system linking network, server and application performance allows a new class of application to be developed, simplifying performance management by providing an integrated view of performance.\n\n\n
- #74: I would like to finish by describing current areas of activity and invite participation from the broader comminity.\n\nI’ve already touched on some of the areas where standard metrics are being defined. Other areas include memcache, Hadoop and networked storage.\n\nAs the metrics become settled, they need to be implemented within the different operating systems, hypervisors and applications so that they can be efficiently deployed in production environments.\n\nNative support for sFlow in existing performance management applications is needed to deliver value from the instrumentation.\n\nFinally, a single measurement system linking network, server and application performance allows a new class of application to be developed, simplifying performance management by providing an integrated view of performance.\n\n\n
- #75: I would like to finish by describing current areas of activity and invite participation from the broader comminity.\n\nI’ve already touched on some of the areas where standard metrics are being defined. Other areas include memcache, Hadoop and networked storage.\n\nAs the metrics become settled, they need to be implemented within the different operating systems, hypervisors and applications so that they can be efficiently deployed in production environments.\n\nNative support for sFlow in existing performance management applications is needed to deliver value from the instrumentation.\n\nFinally, a single measurement system linking network, server and application performance allows a new class of application to be developed, simplifying performance management by providing an integrated view of performance.\n\n\n
- #76: I would like to finish by describing current areas of activity and invite participation from the broader comminity.\n\nI’ve already touched on some of the areas where standard metrics are being defined. Other areas include memcache, Hadoop and networked storage.\n\nAs the metrics become settled, they need to be implemented within the different operating systems, hypervisors and applications so that they can be efficiently deployed in production environments.\n\nNative support for sFlow in existing performance management applications is needed to deliver value from the instrumentation.\n\nFinally, a single measurement system linking network, server and application performance allows a new class of application to be developed, simplifying performance management by providing an integrated view of performance.\n\n\n