


![Method of data input
C function (concatenate)
Eg: > x <- c(1, 2, 3)
> y <- c(10, 20)
> c(x, y, 5) # R command
[1] 1 2 3 10 20 5
Sequence function
seq (“sequence”), is used for equidistant series of
numbers.
Eg: > seq(4,9) # R command
[1] 4 5 6 7 8 9](https://image.slidesharecdn.com/seminar-160825135912/85/statistical-computation-using-R-an-intro-9-320.jpg)
![ If you want a sequence in jumps of 2
Eg: > seq(4,10,2)
[1] 4 6 8 10
Sequence operator “:”
> 4:9 # R command
[1] 4 5 6 7 8 9
Scan function
Used to provide small quantities of data.
variable=scan() # R command
Used for creating data object
Eg: wt=Scan(103,102,108);
[1] 103 102 108](https://image.slidesharecdn.com/seminar-160825135912/85/statistical-computation-using-R-an-intro-10-320.jpg)

![ Matrix function
> x <- 1:12
> dim(x) <- c(3,4)
> x
[,1] [,2] [,3] [,4]
[1,] 1 4 7 10
[2,] 2 5 8 11
[3,] 3 6 9 12
o The dim assignment function sets or changes the dimension
attribute of x, causing R to treat the vector of 12 numbers as a
3 × 4 matrix
o storage is column-major; that is, the elements of the first
column are followed by those of the second, etc.
o Convenient function to provide matrix type data.
o Another function used to create a data frame.
Object=matrix(c(data values) nrow=m,byrow=T/F)
o The byrow=T switch causes the matrix to be filled in a row
wise fashion rather than column wise](https://image.slidesharecdn.com/seminar-160825135912/85/statistical-computation-using-R-an-intro-13-320.jpg)
![ List function
It is sometimes useful to combine a collection of
objects into a larger composite object.This can be
done using lists.
Eg: > list1 <- c(5640,6180,6390,6805,7515)
list2 <- c(3910,3885,5160,5645,7335)
> mylist <- list(before=list1,after=list2)
>mylist
$before
[1] 5640 6180 6390 6515 6805 7515
$after
[1] 3910 3885 5160 5645 7335](https://image.slidesharecdn.com/seminar-160825135912/85/statistical-computation-using-R-an-intro-14-320.jpg)


![ Binomial Distribution
> n<-10
> p<-.5
> pr<dbinom(x,n,p)# for pmf (pbinom for pdf)
Error: object 'pr' not found
> pr<-dbinom(x,n,p)
> pr
[1] 0.009765625 0.117187500 0.246093750 0.009765625
> pmf<-data.frame(x,pr)
> pmf
x pr
1 1 0.009765625
2 3 0.117187500
3 5 0.246093750
4 9 0.009765625
>
plot(x,pr,type="h",main="binomial",lwd=2,xlab="x",ylab="pr")](https://image.slidesharecdn.com/seminar-160825135912/85/statistical-computation-using-R-an-intro-21-320.jpg)


Ad
More Related Content
What's hot (20)
Viewers also liked (9)


Ad
Similar to statistical computation using R- an intro.. (20)


Ad
Recently uploaded (20)


statistical computation using R- an intro..
- 2. Introduction R as a statistical software Statistical features R preliminaries Functions in R Graphics in R Distributions Conclusion References
- 3. Introduction programming language and software environment for statistical computing and graphics. S,S PLUS. Developed by Ross Ihaka and Robert Gentleman at the University of Auckland, New Zealand. Open source software R works fundamentally by the question-and-answer model Can be downloaded from http://R-Project.org
- 4. R - as a Statistical software It has very good computing performance R makes its view especially in colleges & universities It has excellent built in help system Its graphical environment is flexible and powerful Easy for new user Easy to extend with user written functions It provides scripting and interacting facilities Vectors as the basic data structure
- 5. Statistical features R is an interpreted language users typically access it through a command-line interpreter Like other similar languages such as APL and MATLAB, R supports matrix arithmetic R's data structures include vectors, matrices, arrays, data frames (similar to tables in a relational database) and lists. R supports procedural programming with functions and, for some functions, object-oriented programming with generic functions.
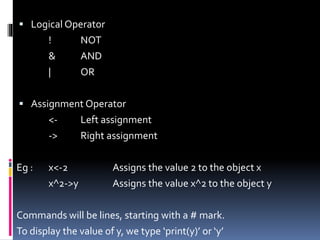
- 6. R-Preliminaries Common operators: Arithmatic Operator + Addition - Subtract * Multiplication / Division ^ Exponential Relational Operator < Lessthan > Greaterthan <= Lessthan Equal >= Greaterthan Equal == Is Equal to != Not Equal
- 7. Logical Operator ! NOT & AND | OR Assignment Operator <- Left assignment -> Right assignment Eg : x<-2 Assigns the value 2 to the object x x^2->y Assigns the value x^2 to the object y Commands will be lines, starting with a # mark. To display the value of y, we type ‘print(y)’ or ‘y’
- 8. Functions function name is followed by a set of parentheses containing one or more arguments. Eg: plot(height,weight) the function name is ‘plot’ and the arguments are ‘height’ and weight. positional matching
- 9. Method of data input C function (concatenate) Eg: > x <- c(1, 2, 3) > y <- c(10, 20) > c(x, y, 5) # R command [1] 1 2 3 10 20 5 Sequence function seq (“sequence”), is used for equidistant series of numbers. Eg: > seq(4,9) # R command [1] 4 5 6 7 8 9
- 10. If you want a sequence in jumps of 2 Eg: > seq(4,10,2) [1] 4 6 8 10 Sequence operator “:” > 4:9 # R command [1] 4 5 6 7 8 9 Scan function Used to provide small quantities of data. variable=scan() # R command Used for creating data object Eg: wt=Scan(103,102,108); [1] 103 102 108
- 11. Rep function rep (“replicate”), is used to generate repeated values y=rep(x,n) # R command X<-c(rep(1,4),rep(2,2)); Data frames o provides the table of data in R object=data.frame(list of variables); # R command o Display the content of data frame with row no. o Column headings can be modified after creation of frame. o Colnames(name of data frame)= c(list of column under double quotes)
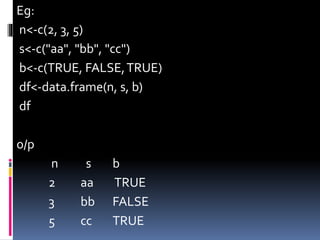
- 12. Eg: n<-c(2, 3, 5) s<-c("aa", "bb", "cc") b<-c(TRUE, FALSE,TRUE) df<-data.frame(n, s, b) df o/p n s b 2 aa TRUE 3 bb FALSE 5 cc TRUE
- 13. Matrix function > x <- 1:12 > dim(x) <- c(3,4) > x [,1] [,2] [,3] [,4] [1,] 1 4 7 10 [2,] 2 5 8 11 [3,] 3 6 9 12 o The dim assignment function sets or changes the dimension attribute of x, causing R to treat the vector of 12 numbers as a 3 × 4 matrix o storage is column-major; that is, the elements of the first column are followed by those of the second, etc. o Convenient function to provide matrix type data. o Another function used to create a data frame. Object=matrix(c(data values) nrow=m,byrow=T/F) o The byrow=T switch causes the matrix to be filled in a row wise fashion rather than column wise
- 14. List function It is sometimes useful to combine a collection of objects into a larger composite object.This can be done using lists. Eg: > list1 <- c(5640,6180,6390,6805,7515) list2 <- c(3910,3885,5160,5645,7335) > mylist <- list(before=list1,after=list2) >mylist $before [1] 5640 6180 6390 6515 6805 7515 $after [1] 3910 3885 5160 5645 7335
- 15. Class function used to decide the class of the data object Eg: > a1<-c(‘x’,’y’); class(a1); o/p: character Built in functions length() no. of elements of data max()the maximum element of data min() the minimum element of data sort() sorting in increasing magnitude -sort() “ decreasing “ etc
- 16. Graphics in R 2 types of graphics function o High level function, which creates a new graph o Low level function, which adds elements to an already existing graph High level ploting functions plot() Scatter plot hist() Histogram boxplot() box & whisker barplot() bar diagram
- 17. Arguments to plot function Argument explanation Main= Tittle Xlab= Label of X axis Ylab Label of Y axis Xlim= Specific X limit Ylim= “ Y limit Type= type of ‘p’ for points Pch= Style of points(bw 0&20) Col= colour
- 18. Low level ploting functions Lines() Draw lines abline() Lines given by intercept and slopes points() Points text() Texts in the plot legent() List of symbols
- 19. > age<-c(5,10,15,20) > freq<-c(10,15,30,20) >plot(age,freq,xlab=age,ylab=freq,pch=1,col="b lue",main="age vs frequency")
- 20. Probability Distributions Distribution Rname Additional Argument Binomial binom size,probability Poisson pois lamda Geometric geom probability Hyper geom hyper m,n,k Normal norm mean,sd Uniform unif min,max Gamma gamma shape,scale Chi-square chisq df,df2,nCp F p df1,df2,nCp
- 21. Binomial Distribution > n<-10 > p<-.5 > pr<dbinom(x,n,p)# for pmf (pbinom for pdf) Error: object 'pr' not found > pr<-dbinom(x,n,p) > pr [1] 0.009765625 0.117187500 0.246093750 0.009765625 > pmf<-data.frame(x,pr) > pmf x pr 1 1 0.009765625 2 3 0.117187500 3 5 0.246093750 4 9 0.009765625 > plot(x,pr,type="h",main="binomial",lwd=2,xlab="x",ylab="pr")
- 22. Conclusion R is a flexible programming language designed to facilitate exploratory data analysis, classical statistical tests, and high- level graphics. R is a full-fledged programming language, with a rich complement of mathematical functions, matrix operations and control structures. With its rich and ever-expanding library of packages, R is on the leading edge of development in statistics, data analytics, and data mining. R has proven itself a useful tool within the growing field of big data and has been integrated into several commercial packages, such as IBM SPSS and InfoSphere, as well as Mathematica.
- 23. References Introductory Statistics with R- Peter Dalgaard(2nd edition) Statistical Computing with R- Eric Slud Quick-R : Creating Graphs http://www.statmethods.net/graphs/
- 25. Thank you