SlideShare a Scribd company logo
© NICE 2018. All rights reserved. Subject to notice of rights.
Subgroup analyses
F. Maignen
Why subgroups? The importance
of (some) covariates…
Baseline covariate: qualitative factor or quantitative
variable measured or observed before a subject
starts taking the study medication (usually before
randomisation) and expected to influence the primary
variable to be analysed.
Examples:
Previous therapies
Age
Severity of disease
Given phenotype of a gene (BRCA2 mutation)
Ethnicity, etc.
2
You can take into consideration the
influence of a covariate in your
analysis either …
Stratification: performing a statistical procedure
separately in groups (strata) with implied pooling
across groups to reduce the effect of group factor.
OR
Subgrouping: estimate of the treatment effect in a
subset of a clinical trial population. Patients excluded
from a particular subgroup are described as the
complement subgroup.
3
Baseline covariate … analysis …
4
Subgrouping
Unstratified (black line)
Stratified
(green line)
Baseline covariate … what could
go wrong?
Assuming that a particular covariate plays an
important role in the efficacy of a given product …
what could go wrong during the conduct of your trial?
5
What can you do to avoid this
situation and achieve …
6
Stratified randomisation … include your covariate in
the randomisation factors.
Baseline covariates …
You should:
- Adjust your statistical analysis for your baseline
covariate
OR you can:
- Perform a subgroup analysis
AND/OR if this covariate is likely to greatly
influence the efficacy of your new technology.
- Perform a stratified randomisation (i.e. add your
baseline covariate in your stratification factors) to
avoid any imbalance (wrt this covariate) between
the arms of your study.
7
The risk of subgroup analyses …
FALSE CLAIMS!!!!!!!!!!!!!!!!!!!!
8
The risk of subgroup analyses …
For a hypothesis test, I have (usually) a 5% risk of
rejecting a null hypothesis which is actually true (risk
alpha) … What would happen if I was performing
simultaneous tests (say 6) in the same trial?
9
Multiplicity
1 – (1 – 0.05)6 = 26.5%
The more you perform statistical
tests, the higher the risk alpha is
inflated i.e. the higher the likelihood
of wrongly rejecting a null
hypothesis …
10
Circumstances in which you will
increase your alpha error rate …
include:
• Multiple endpoints (primary, then
secondary) or comparisons (e.g.
doses)
• Interim analyses
• Subgroup analyses …
It is important to control the error rate
i.e. to maintain the OVERALL error rate
at 5% …
11
Bonferroni correction
Use alpha/n (n = number of hypotheses tested) i.e.
use 0.05/6 (0.008) instead of 0.05 …
BUT WHAT COULD BE THE CONSEQUENCE OF
THIS CORRECTION ON YOUR HYPOTHESIS
TESTING???
12
What we’ve seen so far …
• Some baseline covariates can influence the
efficacy of a product.
• These covariates may or may not have been
identified before the conduct of a trial.
• You can stratify or adjust your clinical trial analysis
according to this (these) covariate(s) = 1 estimate
for the treatment effect.
• You can perform a stratified randomisation
according to a limited number of covariates (to
avoid imbalances in your trial).
• You probably want to make sure that the efficacy
is homogeneous across different subgroups of
patients in which the efficacy is NOT expected to
differ (or may differ).
• You may want to estimate the efficacy of your new
product in a particular subgroup of patients.
13
What we’ve seen so far …
• Stratification can have different meanings
(stratified analysis OR stratified randomisation).
• Subgrouping and stratification mean different
things.
• Subgroup analyses are attached to additional
(statistical and financial) costs (i.e. adjustment for
multiple comparisons).
• Post-hoc subgroup analyses are
BAAAAAAAAAAAD.
14
Does this medicine …
15
work (better or differently) …
1/ in men than in women?
2/ in adults and elderly (say people over 60)?
3/ in persons who own a female hamster (like I just
found in a subgroup analysis)?
4/ only in patients carrying a specific mutation (e.g.
patients carrying the BRAC2 mutation) compared to
the general population of patients?
WHAT ARE YOU LOOKING FOR IN EACH OF
THESE SUBGROUPS?!?!?!?
16
The different types of subgroup
analyses
- Exploratory analyses: differential responses from
early trials or from clinical trials that failed to
establish treatment efficacy in its intended
population. Hypothesis generating at best.
- Supportive analyses: consistency of treatment
effect across subgroups that has established
treatment efficacy in its intended overall
population.
- Inferential analyses: aimed at establishing
treatment efficacy in a pre-defined targeted
subgroup and/or overall population.
17
Connect the dots …
Covariate
Men vs women
Adults vs elderly
Owns a pet hamster
BRCA 2 mutation
18
Interpretation
Homogeneity
Heterogeneity
Inferential
Spurious / exploratory
Connect the dots …
Covariate
Men vs women
Adults vs elderly
Hamster
BRCA 2 mutation
19
Interpretation
Homogeneity
Heterog. (adjust.) or safety
Inferential
Spurious / exploratory
Supportive subgroup analyses
The statistical analysis will include an interaction
term (interaction treatment*subgroup), the efficacy is
assumed to be homogeneous across strata
(subgroups) if the interaction term is not significant.
Supportive subgroup analyses must be interpreted
with caution:
- Lack of statistical power to show differences
- Differences can show up by complete chance
- Multiple comparisons …
- Credibility, replication and confirmation of the
result +++
20
Inferential subgroup analyses
Completely different objective: the result of the
subgroup analysis will result in a specific efficacy
claim in the population pre-defined by the subgroup.
The trial and the analysis must be designed a priori
to establish (greater) efficacy in this subgroup
(compared to the rest of the population – the tested
product may OR may not be efficacious in the
complement subgroup).
21
Inferential subgroup analyses
22
Inferential subgroup analyses
The issues which will come up in SA might relate to:
- Power of the test
- Relative treatment effect and relative size of the
subgroup
- Adjustments for multiple comparisons (and
allocation of alpha)
- Method chosen for the analysis.
23
Biomarker stratified design
24
0
0.05
0.1
0.15
0.2
0.25
0.3
0.35
BM- BM+ BM- BM+
control Product
Prognosis biomarker
control BM-
control BM+
Product BM-
Product BM+
Biomarker stratified design
25
0
0.05
0.1
0.15
0.2
0.25
0.3
0.35
0.4
0.45
control Product control Product
BM- BM+
Predictive biomarker
BM- control
BM- Product
BM+ control
BM+ Product
Biomarker stratified design
26
0
0.1
0.2
0.3
0.4
0.5
0.6
control Product control Product
BM- BM+
Prognosis and predictive biomarker
BM- control
BM- Product
BM+ control
BM+ Product
Example of a biomarker
H0: Null hypothesis for the overall population
H+: Null hypothesis for the subgroup
3 possibilities:
- Reject H0 and fail to reject H+: broad indication in
the entire population of the trial
- Reject H+ and fail to reject H0: restricted
indication in the subgroup of patients who express
the biomarker
- But … what happens if H0 and H+ are both
rejected?
27
Example of a biomarker
If H0 and H+ are both rejected …
Make sure that the effect in the overall population is
not driven by an effect in the subgroup (i.e. that the
product is effective in the BM- subgroup of patients)
and that the effect is different in the BM+/BM-
populations (otherwise he BM is pointless) …
If not:
“Enhanced” indication both in the overall population
and pre-specified subgroup of patients (who express
the biomarker).
28
Conclusions
Two types of subgroup analyses:
- Pre-planned (adequate when properly designed)
or post-hoc (are baaaad unless purely exploratory)
What is the role of the baseline covariate?
Is the trial designed to address the key question of
the analysis (design or the trial and conduct of the
analysis):
- Baseline covariate adjustment
- Stratified randomisation
- Subgroup analysis
Objective of the subgroup analysis (exploratory,
supportive or inferential) +++ MAKE IT PRE-
PLANNED. 29
Conclusions
Statistical issues might relate to:
- Power of the test,
- Relevance of the subgroup / biomarker,
- Relative effect and size of the subgroup,
- Adjustments for multiple comparisons.
30

More Related Content

What's hot (20)

PPTX
Student T - test
Afra Fathima
 
PPTX
Full Lecture Presentation on ANOVA
StevegellKololi
 
PPTX
Error, bias and confounding
Mitasha Singh
 
PPTX
Regression ppt
Shraddha Tiwari
 
PPTX
Null hypothesis
Regent University
 
PPTX
Student t-test
Steve Bishop
 
PPTX
Proportions and Confidence Intervals in Biostatistics
HelpWithAssignment.com
 
PPTX
Confidence interval & probability statements
DrZahid Khan
 
PPTX
Chi square test final
Har Jindal
 
PPTX
Non parametric test
dineshmeena53
 
PPTX
Methods of Randomization
Amy Mehaboob
 
PPTX
Regression Analysis.pptx
ShivankAggatwal
 
PDF
P value, Power, Type 1 and 2 errors
Rizwan S A
 
PPTX
Degree of freedom
StepUp Analytics
 
PPTX
Student's T test distributions & its Applications
vidit jain
 
PDF
Bayesian inference
CharthaGaglani
 
PPTX
4.3.1. controlling confounding matching
A M
 
PPT
oneway ANOVA.ppt
Neha Madan
 
PPSX
Experimental Studies
Tauseef Jawaid
 
Student T - test
Afra Fathima
 
Full Lecture Presentation on ANOVA
StevegellKololi
 
Error, bias and confounding
Mitasha Singh
 
Regression ppt
Shraddha Tiwari
 
Null hypothesis
Regent University
 
Student t-test
Steve Bishop
 
Proportions and Confidence Intervals in Biostatistics
HelpWithAssignment.com
 
Confidence interval & probability statements
DrZahid Khan
 
Chi square test final
Har Jindal
 
Non parametric test
dineshmeena53
 
Methods of Randomization
Amy Mehaboob
 
Regression Analysis.pptx
ShivankAggatwal
 
P value, Power, Type 1 and 2 errors
Rizwan S A
 
Degree of freedom
StepUp Analytics
 
Student's T test distributions & its Applications
vidit jain
 
Bayesian inference
CharthaGaglani
 
4.3.1. controlling confounding matching
A M
 
oneway ANOVA.ppt
Neha Madan
 
Experimental Studies
Tauseef Jawaid
 

Similar to Statistical issues in subgroup analyses (20)

PDF
PMED: APPM Workshop: Overview of Methods for Subgroup Identification in Clini...
The Statistical and Applied Mathematical Sciences Institute
 
PDF
2014-10-22 EUGM | WEI | Moving Beyond the Comfort Zone in Practicing Translat...
Cytel USA
 
PDF
2010 smg training_cardiff_day1_session4_harbord
rgveroniki
 
PDF
TW MN 16 IPA HE 01 20_Mission 3.1.1.3_Lecture 3.pdf
DanielaElenaPopa
 
PPT
Optimization in pharmaceutics & processing
Jamia Hamdard
 
PDF
optimization.pdf
GaneshSureshKumbhar
 
PPT
Prague 02.10.2008
Jonas Ranstam PhD
 
PPT
OPTIMIZATION IN PHARMACEUTICS,FORMULATION & PROCESSING
Jamia Hamdard
 
PPTX
bio equivalence studies
RamyaP53
 
PPT
Optimization in pharmaceutics & processing
Jamia Hamdard
 
PDF
Statistical methods for cardiovascular researchers
https://aiimsbhubaneswar.nic.in/
 
PDF
Complex Innovative Trial Designs
Francois MAIGNEN
 
PPT
Critical appraisal 2012 updated
sanghagirl
 
PPT
Overview Of Ich New E9
Jay1818mar
 
PPTX
Ich guidelines e9 to e12
Khushboo Bhatia
 
PPT
Quantitative Synthesis II
Effective Health Care Program
 
PDF
Introduction to meta analysis
Santam Chakraborty
 
PPT
Optimizationinpharmaceuticsprocessing SIDDANNA M BALAPGOL
Siddanna Balapgol
 
PPTX
Overview of GRADE approach_selected slides for Cochrane Public Health.pptx
akerdemoglu
 
PPT
Optimization techniques
Pradeep Chinnapaga
 
PMED: APPM Workshop: Overview of Methods for Subgroup Identification in Clini...
The Statistical and Applied Mathematical Sciences Institute
 
2014-10-22 EUGM | WEI | Moving Beyond the Comfort Zone in Practicing Translat...
Cytel USA
 
2010 smg training_cardiff_day1_session4_harbord
rgveroniki
 
TW MN 16 IPA HE 01 20_Mission 3.1.1.3_Lecture 3.pdf
DanielaElenaPopa
 
Optimization in pharmaceutics & processing
Jamia Hamdard
 
optimization.pdf
GaneshSureshKumbhar
 
Prague 02.10.2008
Jonas Ranstam PhD
 
OPTIMIZATION IN PHARMACEUTICS,FORMULATION & PROCESSING
Jamia Hamdard
 
bio equivalence studies
RamyaP53
 
Optimization in pharmaceutics & processing
Jamia Hamdard
 
Statistical methods for cardiovascular researchers
https://aiimsbhubaneswar.nic.in/
 
Complex Innovative Trial Designs
Francois MAIGNEN
 
Critical appraisal 2012 updated
sanghagirl
 
Overview Of Ich New E9
Jay1818mar
 
Ich guidelines e9 to e12
Khushboo Bhatia
 
Quantitative Synthesis II
Effective Health Care Program
 
Introduction to meta analysis
Santam Chakraborty
 
Optimizationinpharmaceuticsprocessing SIDDANNA M BALAPGOL
Siddanna Balapgol
 
Overview of GRADE approach_selected slides for Cochrane Public Health.pptx
akerdemoglu
 
Optimization techniques
Pradeep Chinnapaga
 
Ad

More from Francois MAIGNEN (19)

PPTX
RCT to causal inference.pptx
Francois MAIGNEN
 
PPTX
Homeopathy
Francois MAIGNEN
 
PPTX
The role of health technology assessment bodies in the value of cancer care i...
Francois MAIGNEN
 
PPTX
Clinical developments of medicines based on biomarkers
Francois MAIGNEN
 
PPTX
Statistical power
Francois MAIGNEN
 
PPT
ADAPTIVE PATHWAYS
Francois MAIGNEN
 
PDF
Marketing authorisations in the European Union
Francois MAIGNEN
 
PDF
NICE scientific advice between 2009 and 2015
Francois MAIGNEN
 
PPT
Quantitative methods of signal detection on spontaneous reporting system data...
Francois MAIGNEN
 
PPS
Quantitative methods of signal detection - Parametric modelling of the time t...
Francois MAIGNEN
 
PPT
Presentation CIOMS VIII
Francois MAIGNEN
 
PPT
Quantitative methods of Signal detection on spontaneous reporting systems - S...
Francois MAIGNEN
 
PPT
Signal prioritisation and serious medical events
Francois MAIGNEN
 
PPT
Quantitative methods of signal detection
Francois MAIGNEN
 
PPT
Quantitative methods of signal detection
Francois MAIGNEN
 
PPT
Non inferiority clinical trials
Francois MAIGNEN
 
PPT
The masking effect of measures of Disproportionality Analysis
Francois MAIGNEN
 
PPT
DSRU June 2011 1
Francois MAIGNEN
 
PDF
Parametric Modelling Time To Onset
Francois MAIGNEN
 
RCT to causal inference.pptx
Francois MAIGNEN
 
Homeopathy
Francois MAIGNEN
 
The role of health technology assessment bodies in the value of cancer care i...
Francois MAIGNEN
 
Clinical developments of medicines based on biomarkers
Francois MAIGNEN
 
Statistical power
Francois MAIGNEN
 
ADAPTIVE PATHWAYS
Francois MAIGNEN
 
Marketing authorisations in the European Union
Francois MAIGNEN
 
NICE scientific advice between 2009 and 2015
Francois MAIGNEN
 
Quantitative methods of signal detection on spontaneous reporting system data...
Francois MAIGNEN
 
Quantitative methods of signal detection - Parametric modelling of the time t...
Francois MAIGNEN
 
Presentation CIOMS VIII
Francois MAIGNEN
 
Quantitative methods of Signal detection on spontaneous reporting systems - S...
Francois MAIGNEN
 
Signal prioritisation and serious medical events
Francois MAIGNEN
 
Quantitative methods of signal detection
Francois MAIGNEN
 
Quantitative methods of signal detection
Francois MAIGNEN
 
Non inferiority clinical trials
Francois MAIGNEN
 
The masking effect of measures of Disproportionality Analysis
Francois MAIGNEN
 
DSRU June 2011 1
Francois MAIGNEN
 
Parametric Modelling Time To Onset
Francois MAIGNEN
 
Ad

Recently uploaded (20)

PPTX
KERATOCONUS- CLINICAL TOPIC PRESENTATION
DrSanjanaBhandari
 
PDF
MEDULLA OBLONGATA - Prof.Dr.N.Mugunthan. KMMC.pdf
Kanyakumari Medical Mission Research Center, Muttom
 
PPTX
Diabetes Mellitus - by Dr. Jessie Mlotha-Namarika, CHIEF DENTAL SURGEON, KAMU...
casumulupatrickcom
 
PDF
MSTG 6th Edition Updated October 2024 CC.pdf
casumulupatrickcom
 
PPTX
Use of Artificial Intelligence in the Management of Osteoporosis
DrOmLakhani1
 
PPTX
SURGICAL INSTRUMENTS for health care students .pptx
DrSuwarnaChaudhary
 
PPTX
Acute Transfusion Reaction in field of Transfusion Medicine. pptx
tasmerahmank
 
PPTX
Global Harmonization Task Force (GHTF) and International Medical Device Regul...
Arpan Das
 
PPTX
Containers, Closures for Pharmaceuticals.pptx
Unmesh Wankhade
 
PPTX
Dr Airica Steed Provides Expert Insights on Razor Blade Throat COVID Variant ...
airicasteed4
 
PDF
Clinical studies & observational trials in the age of AI
Paul Agapow
 
PPTX
INVESTIGATIONS FOR BREAST DISEASES.pptx
Padmaraju Dhanaraju
 
PPT
Hope on the Horizon in Gastric Cancer: Breakthroughs in Personalized Care Wit...
PVI, PeerView Institute for Medical Education
 
PPTX
Neuroimaging in Traumatic Brain Injury: Primary effects of CNS Trauma
Dr. Aryan (Anish Dhakal)
 
PPTX
Infection - classification , source & transmission .
Remya M S
 
PPTX
MASLD 2025 : A Case Based discisson by Dr. Om J Lakhani
DrOmLakhani1
 
PDF
2024 ESC GUIDELINES FOR MANAGEMENT OF ELEVATED BLOOD PRESSURE AND HYPERTENSIO...
BOBBIESARFOAKOSUA
 
PPT
Refining Treatment Models For Biliary Tract Cancer Aligning Practice With Rap...
PVI, PeerView Institute for Medical Education
 
PPTX
Roganutpadaniya Adhyaya by Dr Harish M H- Consultant and Assistant professor ...
Dr Harish M Hadapad
 
PPTX
Neuroblastoma & Ganglioneuroblastoma management.pptx
NEIGRIHMS, SHILLONG
 
KERATOCONUS- CLINICAL TOPIC PRESENTATION
DrSanjanaBhandari
 
MEDULLA OBLONGATA - Prof.Dr.N.Mugunthan. KMMC.pdf
Kanyakumari Medical Mission Research Center, Muttom
 
Diabetes Mellitus - by Dr. Jessie Mlotha-Namarika, CHIEF DENTAL SURGEON, KAMU...
casumulupatrickcom
 
MSTG 6th Edition Updated October 2024 CC.pdf
casumulupatrickcom
 
Use of Artificial Intelligence in the Management of Osteoporosis
DrOmLakhani1
 
SURGICAL INSTRUMENTS for health care students .pptx
DrSuwarnaChaudhary
 
Acute Transfusion Reaction in field of Transfusion Medicine. pptx
tasmerahmank
 
Global Harmonization Task Force (GHTF) and International Medical Device Regul...
Arpan Das
 
Containers, Closures for Pharmaceuticals.pptx
Unmesh Wankhade
 
Dr Airica Steed Provides Expert Insights on Razor Blade Throat COVID Variant ...
airicasteed4
 
Clinical studies & observational trials in the age of AI
Paul Agapow
 
INVESTIGATIONS FOR BREAST DISEASES.pptx
Padmaraju Dhanaraju
 
Hope on the Horizon in Gastric Cancer: Breakthroughs in Personalized Care Wit...
PVI, PeerView Institute for Medical Education
 
Neuroimaging in Traumatic Brain Injury: Primary effects of CNS Trauma
Dr. Aryan (Anish Dhakal)
 
Infection - classification , source & transmission .
Remya M S
 
MASLD 2025 : A Case Based discisson by Dr. Om J Lakhani
DrOmLakhani1
 
2024 ESC GUIDELINES FOR MANAGEMENT OF ELEVATED BLOOD PRESSURE AND HYPERTENSIO...
BOBBIESARFOAKOSUA
 
Refining Treatment Models For Biliary Tract Cancer Aligning Practice With Rap...
PVI, PeerView Institute for Medical Education
 
Roganutpadaniya Adhyaya by Dr Harish M H- Consultant and Assistant professor ...
Dr Harish M Hadapad
 
Neuroblastoma & Ganglioneuroblastoma management.pptx
NEIGRIHMS, SHILLONG
 

Statistical issues in subgroup analyses

  • 1. © NICE 2018. All rights reserved. Subject to notice of rights. Subgroup analyses F. Maignen
  • 2. Why subgroups? The importance of (some) covariates… Baseline covariate: qualitative factor or quantitative variable measured or observed before a subject starts taking the study medication (usually before randomisation) and expected to influence the primary variable to be analysed. Examples: Previous therapies Age Severity of disease Given phenotype of a gene (BRCA2 mutation) Ethnicity, etc. 2
  • 3. You can take into consideration the influence of a covariate in your analysis either … Stratification: performing a statistical procedure separately in groups (strata) with implied pooling across groups to reduce the effect of group factor. OR Subgrouping: estimate of the treatment effect in a subset of a clinical trial population. Patients excluded from a particular subgroup are described as the complement subgroup. 3
  • 4. Baseline covariate … analysis … 4 Subgrouping Unstratified (black line) Stratified (green line)
  • 5. Baseline covariate … what could go wrong? Assuming that a particular covariate plays an important role in the efficacy of a given product … what could go wrong during the conduct of your trial? 5
  • 6. What can you do to avoid this situation and achieve … 6 Stratified randomisation … include your covariate in the randomisation factors.
  • 7. Baseline covariates … You should: - Adjust your statistical analysis for your baseline covariate OR you can: - Perform a subgroup analysis AND/OR if this covariate is likely to greatly influence the efficacy of your new technology. - Perform a stratified randomisation (i.e. add your baseline covariate in your stratification factors) to avoid any imbalance (wrt this covariate) between the arms of your study. 7
  • 8. The risk of subgroup analyses … FALSE CLAIMS!!!!!!!!!!!!!!!!!!!! 8
  • 9. The risk of subgroup analyses … For a hypothesis test, I have (usually) a 5% risk of rejecting a null hypothesis which is actually true (risk alpha) … What would happen if I was performing simultaneous tests (say 6) in the same trial? 9
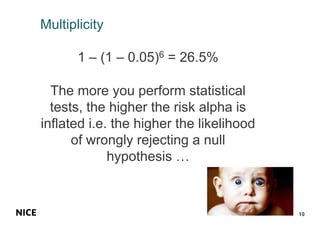
  • 10. Multiplicity 1 – (1 – 0.05)6 = 26.5% The more you perform statistical tests, the higher the risk alpha is inflated i.e. the higher the likelihood of wrongly rejecting a null hypothesis … 10
  • 11. Circumstances in which you will increase your alpha error rate … include: • Multiple endpoints (primary, then secondary) or comparisons (e.g. doses) • Interim analyses • Subgroup analyses … It is important to control the error rate i.e. to maintain the OVERALL error rate at 5% … 11
  • 12. Bonferroni correction Use alpha/n (n = number of hypotheses tested) i.e. use 0.05/6 (0.008) instead of 0.05 … BUT WHAT COULD BE THE CONSEQUENCE OF THIS CORRECTION ON YOUR HYPOTHESIS TESTING??? 12
  • 13. What we’ve seen so far … • Some baseline covariates can influence the efficacy of a product. • These covariates may or may not have been identified before the conduct of a trial. • You can stratify or adjust your clinical trial analysis according to this (these) covariate(s) = 1 estimate for the treatment effect. • You can perform a stratified randomisation according to a limited number of covariates (to avoid imbalances in your trial). • You probably want to make sure that the efficacy is homogeneous across different subgroups of patients in which the efficacy is NOT expected to differ (or may differ). • You may want to estimate the efficacy of your new product in a particular subgroup of patients. 13
  • 14. What we’ve seen so far … • Stratification can have different meanings (stratified analysis OR stratified randomisation). • Subgrouping and stratification mean different things. • Subgroup analyses are attached to additional (statistical and financial) costs (i.e. adjustment for multiple comparisons). • Post-hoc subgroup analyses are BAAAAAAAAAAAD. 14
  • 16. work (better or differently) … 1/ in men than in women? 2/ in adults and elderly (say people over 60)? 3/ in persons who own a female hamster (like I just found in a subgroup analysis)? 4/ only in patients carrying a specific mutation (e.g. patients carrying the BRAC2 mutation) compared to the general population of patients? WHAT ARE YOU LOOKING FOR IN EACH OF THESE SUBGROUPS?!?!?!? 16
  • 17. The different types of subgroup analyses - Exploratory analyses: differential responses from early trials or from clinical trials that failed to establish treatment efficacy in its intended population. Hypothesis generating at best. - Supportive analyses: consistency of treatment effect across subgroups that has established treatment efficacy in its intended overall population. - Inferential analyses: aimed at establishing treatment efficacy in a pre-defined targeted subgroup and/or overall population. 17
  • 18. Connect the dots … Covariate Men vs women Adults vs elderly Owns a pet hamster BRCA 2 mutation 18 Interpretation Homogeneity Heterogeneity Inferential Spurious / exploratory
  • 19. Connect the dots … Covariate Men vs women Adults vs elderly Hamster BRCA 2 mutation 19 Interpretation Homogeneity Heterog. (adjust.) or safety Inferential Spurious / exploratory
  • 20. Supportive subgroup analyses The statistical analysis will include an interaction term (interaction treatment*subgroup), the efficacy is assumed to be homogeneous across strata (subgroups) if the interaction term is not significant. Supportive subgroup analyses must be interpreted with caution: - Lack of statistical power to show differences - Differences can show up by complete chance - Multiple comparisons … - Credibility, replication and confirmation of the result +++ 20
  • 21. Inferential subgroup analyses Completely different objective: the result of the subgroup analysis will result in a specific efficacy claim in the population pre-defined by the subgroup. The trial and the analysis must be designed a priori to establish (greater) efficacy in this subgroup (compared to the rest of the population – the tested product may OR may not be efficacious in the complement subgroup). 21
  • 23. Inferential subgroup analyses The issues which will come up in SA might relate to: - Power of the test - Relative treatment effect and relative size of the subgroup - Adjustments for multiple comparisons (and allocation of alpha) - Method chosen for the analysis. 23
  • 24. Biomarker stratified design 24 0 0.05 0.1 0.15 0.2 0.25 0.3 0.35 BM- BM+ BM- BM+ control Product Prognosis biomarker control BM- control BM+ Product BM- Product BM+
  • 25. Biomarker stratified design 25 0 0.05 0.1 0.15 0.2 0.25 0.3 0.35 0.4 0.45 control Product control Product BM- BM+ Predictive biomarker BM- control BM- Product BM+ control BM+ Product
  • 26. Biomarker stratified design 26 0 0.1 0.2 0.3 0.4 0.5 0.6 control Product control Product BM- BM+ Prognosis and predictive biomarker BM- control BM- Product BM+ control BM+ Product
  • 27. Example of a biomarker H0: Null hypothesis for the overall population H+: Null hypothesis for the subgroup 3 possibilities: - Reject H0 and fail to reject H+: broad indication in the entire population of the trial - Reject H+ and fail to reject H0: restricted indication in the subgroup of patients who express the biomarker - But … what happens if H0 and H+ are both rejected? 27
  • 28. Example of a biomarker If H0 and H+ are both rejected … Make sure that the effect in the overall population is not driven by an effect in the subgroup (i.e. that the product is effective in the BM- subgroup of patients) and that the effect is different in the BM+/BM- populations (otherwise he BM is pointless) … If not: “Enhanced” indication both in the overall population and pre-specified subgroup of patients (who express the biomarker). 28
  • 29. Conclusions Two types of subgroup analyses: - Pre-planned (adequate when properly designed) or post-hoc (are baaaad unless purely exploratory) What is the role of the baseline covariate? Is the trial designed to address the key question of the analysis (design or the trial and conduct of the analysis): - Baseline covariate adjustment - Stratified randomisation - Subgroup analysis Objective of the subgroup analysis (exploratory, supportive or inferential) +++ MAKE IT PRE- PLANNED. 29
  • 30. Conclusions Statistical issues might relate to: - Power of the test, - Relevance of the subgroup / biomarker, - Relative effect and size of the subgroup, - Adjustments for multiple comparisons. 30