Stratebi_Emilio_Arias_PCM14
0 likes8,915 views

This document summarizes new tools that supplement Pentaho Open BI CE and improve usability of business intelligence solutions. It describes STPivot, an OLAP viewer with enhanced features like Ajax interface and new charts. STDashboard is an easy to use dashboard creator for end users to analyze and share dashboards. STCard allows creating and managing scorecards with indicators, perspectives and KPIs to monitor objectives. The tools are mobile compliant and their components can be embedded in applications.


Ad
More Related Content
What's hot (20)
Viewers also liked (10)


Ad
Similar to Stratebi_Emilio_Arias_PCM14 (20)


![baji[4_4]](https://cdn.slidesharecdn.com/ss_thumbnails/cc8358f5-675f-4abf-92a5-357360fad423-160330065126-thumbnail.jpg?width=560&fit=bounds)

Ad
More from Stratebi (20)


Recently uploaded (20)


Stratebi_Emilio_Arias_PCM14
- 2. Today, companies and organizations are looking to supplement their solution from Pentaho Open BI CE with new components and improve the usability of their BI solution Features Improving user experience when they are analyzing data. This new tools are been using by many companies
- 3. All the tools are mobile compliant Features
- 4. STPivot STPivot is an OLAP viewer with extra functionalities Main features included are: • Ajax interface, improve usability • New charts and introducing maps • MDX Editor enhanced • Calculator • New set of icons • Formula Editor • Min, Max, AVG, SUM • Drag & drop • What if wizard • Color Coding. Map heat • Send mails feature
- 5. STPivot New types of graphs including maps, treemap, sunburst… Maps Sunburst
- 6. STDashboard STDashboard is an end user Dashboard Creator (easy and powerful), Main features: • Easy to use for end users. • Very intuitive. They can use it in one minute!! • Managing data from your Mondrian cubes • You can analyze and show Dashboards with no IT suuport • Based on your own previous model defined. • Several types of charts, including gauges • You can filter data with selectors and zoom option • Can include external content like olap views, reports, web pages… • Save and share all your Dashboards with other users
- 7. STDashboard STDashboard is the perfect tool for end users
- 8. STDashboard A simple and easy wizard for Dashboard creation You can access all of your OLAP cubes Embed these components in your own application
- 9. STCard STCard is a tool for creating Scorecards, where you can create indicators, perspectives, objectives and KPIs and assign them to responsibles STCard, provides the flexibility to create different Scorecards either at organizational or departmental level. The indicators may be both quantitative and qualitative, and each will be set thresholds, values, goals, traffic light coding Scorecards in STCard are based in Norton and Kaplan Methodology, with the possibility to create as many scorecards, perspectives and indicators as needed
- 10. STCard STCard is the right tool for creating and managing Scorecards, to facilitate the monitoring of compliance with the objectives identified in their KPIs
- 11. STCard STCard is the right tool for creating and managing Scorecards, to facilitate the monitoring of compliance with the objectives identified in their KPIs
- 12. STCard Manage and create roles, permissions and reports
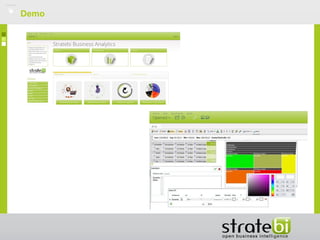
- 13. Demo
- 14. Demo
- 15. Thanks