Techniques to Effectively Monitor the Performance of Customers in the Cloud
Download as PPTX, PDF0 likes692 views

This document discusses techniques for effectively monitoring customer performance in the cloud. It recommends establishing a baseline for normal performance and monitoring metrics and thresholds to detect deviations. Key metrics to track include counts, medians, percentiles, and distributions over time. Dashboards should visualize these metrics and allow comparing performance across different time periods. An example dashboard monitors adoption, errors, and metrics over the last 30 days and compares to the same day last week. The presentation demonstrates an Einstein Analytics dashboard for interactive analysis across devices.


Ad
More Related Content
What's hot (20)
Similar to Techniques to Effectively Monitor the Performance of Customers in the Cloud (20)


Ad
More from Salesforce Engineering (20)


Ad
Recently uploaded (20)


Techniques to Effectively Monitor the Performance of Customers in the Cloud
- 1. Techniques to Effectively Monitor the Performance of Customers in the Cloud [email protected] Manish Kumar Anand Lead Performance Engineer
- 2. Agenda Welcome Audience: Performance engineers, product owners, customer support engineers and developers Level: Intermediate Introduction Effective Performance Monitoring Strategy Performance Metrics, Views & Dashboards Demo Salesforce Einstein Analytics Dashboard Summary Q&A
- 3. Forward-Looking Statements Statement under the Private Securities Litigation Reform Act of 1995: This presentation may contain forward-looking statements that involve risks, uncertainties, and assumptions. If any such uncertainties materialize or if any of the assumptions proves incorrect, the results of salesforce.com, inc. could differ materially from the results expressed or implied by the forward-looking statements we make. All statements other than statements of historical fact could be deemed forward-looking, including any projections of product or service availability, subscriber growth, earnings, revenues, or other financial items and any statements regarding strategies or plans of management for future operations, statements of belief, any statements concerning new, planned, or upgraded services or technology developments and customer contracts or use of our services. The risks and uncertainties referred to above include – but are not limited to – risks associated with developing and delivering new functionality for our service, new products and services, our new business model, our past operating losses, possible fluctuations in our operating results and rate of growth, interruptions or delays in our Web hosting, breach of our security measures, the outcome of any litigation, risks associated with completed and any possible mergers and acquisitions, the immature market in which we operate, our relatively limited operating history, our ability to expand, retain, and motivate our employees and manage our growth, new releases of our service and successful customer deployment, our limited history reselling non-salesforce.com products, and utilization and selling to larger enterprise customers. Further information on potential factors that could affect the financial results of salesforce.com, inc. is included in our annual report on Form 10-K for the most recent fiscal year and in our quarterly report on Form 10-Q for the most recent fiscal quarter. These documents and others containing important disclosures are available on the SEC Filings section of the Investor Information section of our Web site. Any unreleased services or features referenced in this or other presentations, press releases or public statements are not currently available and may not be delivered on time or at all. Customers who purchase our services should make the purchase decisions based upon features that are currently available. Salesforce.com, inc. assumes no obligation and does not intend to update these forward-looking statements.
- 4. Effective Performance Monitoring Strategy Making actionable insights from collected data Instrument to generate logs Retain raw data for sufficient time Support for massive scale Collect Baseline Report Analyze Establish baseline for normal performance Compare real-time with historical norms Monitor thresholds & deviations Summarize and visualize related data Combine metrics in one dashboard Share dashboards with team/executives Proactively analyze & troubleshoot Forecast capacity needs Derive actionable insights
- 5. Shared IT resources One data store per Point of Deployment (Pod) Many customers per Pod Many Pods All data segregated by customer Analogy Salesforce Multi-tenancy Advantages Multi-tenancy One cloud with many customers One app stack Staggered Releases Scalability across all sizes 3 major releases per year Automation Shared resources for water, power and building maintenance
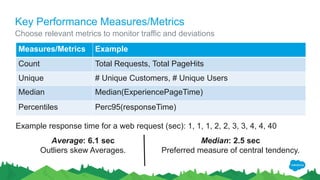
- 6. Key Performance Measures/Metrics Choose relevant metrics to monitor traffic and deviations Measures/Metrics Example Count Total Requests, Total PageHits Unique # Unique Customers, # Unique Users Median Median(ExperiencePageTime) Percentiles Perc95(responseTime) Example response time for a web request (sec): 1, 1, 1, 2, 2, 3, 3, 4, 4, 40 Average: 6.1 sec Outliers skew Averages. Median: 2.5 sec Preferred measure of central tendency.
- 7. Analyzing Data Across Different Timespan Shows hourly, daily, and weekly trends Helps in identifying any trends (increasing/deceasing) Helps in detecting anomalies Identify trends and anomalies Above are sample data.
- 8. Visualizing Performance Metrics Use appropriate chart to visualize performance data Above are sample data. 4.3 2.5 3.5 4.5 1.7 2.9 Bar Chart One Two Three Four Five Six 40% 30% 15% 10% 5% Pie Chart Region1 Region2 Region3 Region4 Region5 Comparing data across categories Showing proportions
- 9. Visualizing Performance Metrics Use appropriate chart to visualize performance data Understanding data distribution Viewing trends in data over time 10% 20% 25% 20% 25% 15% 30% 15% 20% 10% 25% 15% 10% 5% 20% 20% 10% 5% RELEASE1 RELASE2 RELEASE3 Distribution Chart "0-2" "2-4" "4-6" "6-8" "8-10" ">10" 0 1 2 3 4 5 6 7 8 Jan Feb Mar Apr May Jun Line Chart EntityA EntityB EntityC EntityD Above are sample data.
- 10. All Customers Top N Customers Individual Customers Dashboards to Monitor Customers Performance Different dashboards to monitor metrics at a glance Allow navigation to each of these dashboards by providing links. Monitor customers health Aggregate metrics by customers Compare with previous week day Inspect common errors Monitor traffic and metrics for top N customers Identify scalability bottlenecks Compare with previous week day Inspect common errors Filter metrics for any specific customer Focus on traffic and adoption metrics Analyze last 30 days trend Compare with previous week day Inspect errors
- 11. Comparative Metrics View Dashboard Allows to quickly monitor metric deviations for any two different timeline Shows similar metrics side-by-side Relatively simple query execution Dashboard rendering relatively faster Shows deviation values in the same row Complex query execution Dashboard rendering affected by objects Single row comparative view Side-by-side comparative view orgs metric1_t1 metric1_t2 Delta Delta % org1 40 10 30 -75% org2 20 40 20 100% org3 10 15 5 50% orgs metric1 org1 40 org2 20 org3 10 orgs metric1 org1 10 org2 40 org3 15 time: t1 time: t2 time: t1 time: t2 Above are sample data.
- 12. Example Performance Dashboard for a Customer Time: Today Adoption Metrics Metrics_X & Metrics_Y Errors Attributes Last 30 days Metrics (Graphs) Last 30 days Metrics (Tabular Format) Time: Same day a week ago Adoption Metrics Metrics_X & Metrics_Y Errors Attributes Last 30 days Metrics (Graphs) Last 30 days Metrics (Tabular Format) entity direction numUsers entityA S->X 1500 entityB X->S 2000 entity direction numUsers entityA S->X 1000 entityB X->S 1950 ORG_X Above are sample data.
- 13. Salesforce Einstein Analytics Dashboard Example Analytics solution for any business and on any device Support for Desktop and Mobile view Load data from multiple sources Drill down to raw data Einstein Analytics Dashboard Demo
- 14. Summary Choose relevant metrics and timespan to monitor traffic and deviations Use appropriate charts to visualize data Build separate dashboards to monitor metrics at various levels Use comparison view to quickly monitor deviations between two timeline Build dashboards to monitor performance trends Visualize data using Einstein Analytics Share with team members and executives What did we cover today? Build dashboard to monitor performance metrics at a glance Analyze performance metrics to make actionable insights
- 15. Resources Visit Salesforce Einstein Analytics Tutorial http://www.salesforce.com/analytics-cloud/overview/
Editor's Notes
- #4: Talk Track Before I begin, just a quick note that you should base your purchasing decisions on products and services that are currently available. Key Takeaway Salesforce is a publicly traded company. Customer should make buying decisions only on the products commercially available.