SlideShare a Scribd company logo
www.ExigenServices.com
The art of project estimation
Damir Tenishev
Ph.D., Project Manager
July 2013
2
Goals
• Understand the goals and scope of estimation
• Study estimation approaches
• Learn and compare some estimation techniques
• Understand applicability for specific techniques
• Review common estimation mistakes
• Study of the effects of large scale projects on estimates
• Share practical experience in estimation
Scope: classical estimation techniques
3
What is necessary to make estimations?
• Software requirements
• Time for estimation
• Team of software experts to make estimations
• Subject matter experts to clarify the requirements
• Knowledge base for implementation approaches and required effort
• Information about special conditions (team size, technologies, client-specific)
Start when you are ready
4
Expected result
• Scope to be implemented
• Total effort to be spent to implement the project
• Project budget
• Project schedule
– Project decomposition
– Project and key stages’ duration
• Staffing plan
• Risk management plan
• Assumptions
It is all about resources
5
Need to be clarified
• Product requirements
– Functional requirements
– Non-functional requirements (performance, stability, scalability, and etc.)
– Production, testing and etc. environments
• Project requirements
– Technologies
– Business trip policy
– Support policy
6
Effective estimations
• Define estimation subject. What you are going to estimate?
• Make decomposition and work breakdown structure (WBS)
– Divide until you have easy explainable tasks with obvious implementation
– Keep breakdown hierarchy
– Add dependencies
• Use historical data and gathered experience
• Use several experts
• Make tasks clustering and average estimates
• Take into account real productivity of your team
Divide and empire
7
Good questions
• Explain in one sentence what have to be done?
• How this will be used? Who are the end users?
• What is the value? Can we drop this?
• What is the similar feature we have implemented/estimated before?
• What is the effort for implementation and what is estimated duration?
• What can be done to make this two times faster, cheaper?
• What can be done to parallelize work on this task? What pros and cons will be?
• What is the easiest way to implement this feature?
• What dependencies do we have from and to other tasks?
• Who can do this work? What experience is necessary?
• What environment for this task is assumed?
• What are the risks? How they can be mitigated?
• What is permanent and what can vary in the feature?
Communicate!
8
Typical mistakes
• Differences in definition of done
• Incomplete requirements
• Lack of time for clarification and making more precise estimation
• Unawareness of time factor for large systems (they are grown, not built)
• Mistakes in decomposition
• Loosing significant details or parts of functionality
• Neglect of communication delays (with customer, experts, and etc.)
• Team size is not taken into account (internal communications and other aspects)
• Lack of specific knowledge (business area or technology)
• Misconception of required and estimated delivery
• Ignoring cost of support produced code and data
• Ignoring risks
• Cognitive biases
You have to care about many things
9
Cognitive biases
• We do not examine every possible option or every scrap of data before we make a
decision
• We adopt certain rules of thumb and take other shortcuts when we make choices
• In some cases, our cognitive limitations lead to poor estimations
• Cognitive biases
– Overconfidence
– Sunk-cost effect
– Availability bias (recency effect)
– Confirmation bias
– Anchoring bias
– Illusory correlation
– Hindsight bias
Praemonitus, praemunitus
10
Classification of project estimations
• By type of estimation
– Product metrics
– Effort estimation
– Duration estimation
• By goals
– Commercial offer
– Forecast and planning
• By techniques
– By historical model
– Expert methods
– Parametric
What is your goal?
11
Estimation techniques
• Historical model usage
• Expert methods
– Three point estimation
– Delphi
– Wideband Delphi
– Planning poker
• Parametric methods
– Proxy-based estimation (PROBE)
– Function point
– Use case point
– Weighted Micro Function Points
What is your approach?
12
Basic steps: summary
• Decomposition
• Discovering dependencies
• Identification of experts for every specific area
• Gathering and clarifying requirements
• Analysis for applicability of existing solutions and technologies
• Estimating by expert
• Tracking reasoning and assumptions for decisions
• Identifications of risks
• Getting summary estimation for task
• Comparison with other tasks’ estimations
• Making summary estimation
Always have a checklist
13
Three point estimation
• Task estimation based on three values
– Optimistic (O)
– Most likely or normal (M)
– Pessimistic (P)
• Double triangular distribution is used
S = 0.5 S = 0.5
MO P
14
Three point estimation: math
Expected time
Standard deviation
Project time
Project standard deviation
Assumption: All project’s tasks are consecutive.
15
Three point estimation: confidence level
Confidence level Standard deviation
68 % SD
90 % 1.645 x SD
95 % 2 x SD
99.7 % 3 x SD
Note: Information systems typically use the 90% confidence level for all project and task estimates.
16
Three point estimation: example
Tasks O M P E SD
Task 1 1 3 8
Task 2 2 5 20
Confidence
68 %
(E ± SD )
90 %
(E ± 1.645*SD)
95 %
(E ± 2 *SD)
99.7 %
(E ± 3*SD)
Task 1 3.5 ± 1.17=> 2.33 to 4.66 1.58 to 5.42 1.17 to 5.83
Task 2 7± 3 => 4 to 10 2.06 to 11.93 2 to 9
Project (consecutive tasks):
17
Delphi method: estimation matrix
Expert 1 Expert 2 Expert 3 Average
Task 1 Attempt 1
Attempt 2
Attempt 3
10
10
11
5
8
10
20
15
12
11.7
11
11
Task 2 Attempt 1
Attempt 2
Attempt 3
15
16
18
30
20
18
8
20
19
17.7
18.7
18.3
Task 3 Attempt 1
Attempt 2
Attempt 3
11
10
8
4
5
6
6
7
7
7
7.3
7
• Decomposition into tasks
• Anonymous estimation
• Announcement of average estimation as well as reasons for them
• Transition to next estimation iteration
18
Delphi method: features and applicability
• Strengths
– Works well for ambiguity
– Lead to joint agreement and corporate liability
– Easy to adopt to time restrictions
– Anonymous estimations eliminate authority influence
– Assumptions are documented, discussed and agreed
• Weaknesses
– There is no formal reasoning for estimation. As a result there is no formal reasoning
for customer
– Decomposition rules are not defined
– Some creative ideas can be lost since majority opinion is prevail
– It is possible that people will agree with other’s estimate without cogitation
– Need to have at least 4 experts
19
Wideband Delphi method
Involves greater interaction and more communication between participants
Execution steps
1. Coordinator presents each expert with a specification and an estimation form.
2. Coordinator calls a group meeting in which the experts discuss estimation issues
with the coordinator and each other.
3. Experts fill out forms anonymously.
4. Coordinator prepares and distributes a summary of the estimates
5. Coordinator calls a group meeting, specifically focusing on having the experts
discuss points where their estimates vary widely
6. Experts fill out forms, again anonymously, and steps 4 to 6 are iterated for as
many rounds as appropriate.
20
Planning poker (sprint planning meeting, planning game)
21
Planning poker: pros and cons
Pros:
• It is fun!
• Minimizes anchoring
• Team work which build up a team
• Corporate liability
• Expertized and reasoning sharing
Cons:
• Expensive
• Can take significant time for clarifications
• Difficult to implement in distributed projects
• Difficult to make “weight” to experts’ estimates
• Personalities can affect the estimates
22
Proxy-based estimation (PROBE) method
• Used mostly in feasibility studies (evaluating best process, economic feasibility of
the project)
• Divide requirements by classes
• Every class must be estimated by
– Complexity
– Size
• Class assigned to every specific task
23
Template for PROBE method
Requirement/task Class Effort
Retrieve image 1 3.5 hours
Print of screen 2 4.6 hours
Print on paper 2 4.6 hours
Class Size Complexity Effort
1: data retrieval 1 2 3.5 hours
2: image printing 2 2 4.6 hours
Small Medium Large
Simple 1.5 hours 2.3 hours 3.8 hours
Normal 3.5 hours 4.6 hours 5.9 hours
Complex 5.5 hours 6.7 hours 8.1 hours
24
PROBE: features and applicability
• Strengths
– Similar tasks estimates in the same way
– Simplifies staffing and resource assignment
• Weaknesses
– Need deep understanding of the technology
– Provides very rough estimations
25
Functional point analysis: terms
• Logical data types
– Internal logical file (ILF) – user visible internal data structure
– External interface file (EIF) – data, used by application, but exists outside of
application
• Processes
– External input (EI) – process of data transfer from user or EIF to ILF.
– External output (EO) – process of data transfer from one or many ILF to user or EIF
with mandatory data conversion (processing).
– External inquiries (EQ) – process of data transfer without conversion.
• Data elements
– Record Element Type (RET) - user recognizable sub group of data elements
– File Type Referenced (FTR) - file type referenced by a transaction
– Data Element Type (DET) - unique user recognizable, non-recursive field
26
FPA: sample
Application being measured
Another
application
ILF
EIF
math
User domain
EI EO
EO
EI
EQ
EQ
27
Functional point analysis: approach
• Assign specific weight to every data type, interface, and process
• Calculation of unadjusted function point (UFP) based on number of elements and
their weights.
• Calculate Value Adjustment Factor (VAF) based on technical and environmental
requirements (General System Characteristics (GSC) - by tables with weights for
every specific case).
• Calculation of adjusted function points (AFP) based on UFP and coefficient above.
28
FPA: features and applicability
• Strengths
– Indifferent to implementation process and technology
– Artifacts can be used for further architecture development
– Provide estimation in “common units” and shows project’s complexity independently
of supplier competency
– Can be made by one person or can be made in parallel to speed up
• Weaknesses
– Requires a lot of time to understand and apply in correct way.
– Difficult to adjust to specific company processes and experience.
– Doesn’t provide decomposition for production stages and operations.
29
Use Case Points
Used when Unified Modeling Language (UML) and Rational Unified Process (RUP)
methodologies are being used for software design and development.
• Unadjusted Use Case Weight (UUCW) – number and complexity of use cases
• Unadjusted Actor Weight (UAW) - number and complexity of actors
• Technical Complexity Factor (TCF) - technical aspects of development
• Environmental Complexity Factor (ECF) - environmental factors
30
Unadjusted Use Case Weight (UUCW)
• Based on the number and complexity of the use cases for the system
• To find the UUCW for a system, each of the use cases must be identified and
classified as Simple, Average or Complex based on the number of transactions the
use case contains
Use Case Classification No. of Transactions Weight
Simple 1 to 3 transactions 5
Average 4 to 7 transactions 10
Complex 8 or more transactions 15
31
Unadjusted Actor Weight (UAW)
• Calculated based on the number and complexity of the actors for the system
• Actors must be identified and classified as Simple, Average or Complex based the
type of actor
Actor Classification Type of Actor Weight
Simple
External system that must interact with the system using
a well-defined API
1
Average
External system that must interact with the system using
standard communication protocols (e.g. TCP/IP, FTP,
HTTP, database)
2
Complex Human actor using a GUI application interface 3
32
Technical Complexity Factor (TCF)
• Determined by assigning a score (perceived complexity factor) between 0 (factor
is irrelevant) and 5 (factor is essential) to each of the 13 technical factors listed in
the table
• This score is then multiplied by the defined weighted value for each factor.
Factor Description Weight
T1 Distributed system 2.0
T2 Response time/performance objectives 1.0
T3 End-user efficiency 1.0
T4 Internal processing complexity 1.0
… … …
33
Environmental Complexity Factor (ECF)
• It is determined by assigning a score between 0 (no experience) and 5 (expert) to
each of the 8 environmental factors listed in the table
• This score is then multiplied by the defined weighted value for each factor.
Factor Description Weight
E1 Familiarity with development process used 1.5
E2 Application experience 0.5
E3 Object-oriented experience of team 1.0
E4 Lead analyst capability 0.5
E5 Motivation of the team 1.0
… … …
34
Use Case Points (UCP)
Finally the UCP can be calculated once the unadjusted project size (UUCW and UAW),
technical factor (TCF) and environmental factor (ECF) have been determined. The
UCP is calculated based on the following formula:
UCP = (UUCW + UAW) * TCF * ECF
This estimation includes development only. It not consider testing, configuration
management, support, and etc.
35
Use case points: features and applicability
• Strengths
– Not necessary to involve the experts
– Technical expertize not needed
– Can be used for rough pre-sale estimation
– Can be made very fast
– Intuitive enough for the customer
• Weaknesses
– Estimates only requirements, but not tasks. They have to be estimated later.
– Strongly depends on requirements completeness
– Coefficients need to be adjusted for the company
36
Weighted Micro Function Points
• Produces more accurate results than traditional software sizing methodologies,
while requiring less configuration and knowledge from the end user, as most of
the estimation is based on automatic measurements of an existing source code.
• Uses a parser to understand the source code breaking it down into micro
functions and derive several code complexity and volume metrics, which are then
dynamically interpolated into a final effort score.
• As a result can be used only with analogy based cost predictions.
37
Project evaluation and review technique (PERT)
Statistical tool that is designed to analyze and represent the tasks involved in
completing a given project.
Commonly used in conjunction with the critical path method (CPM).
• A PERT chart is a tool that facilitates decision making. The first draft of a PERT
chart will number its events sequentially in 10s (10, 20, 30, etc.) to allow the later
insertion of additional events.
• Two consecutive events in a PERT chart are linked by activities, which are
conventionally represented as arrows.
• The events are presented in a logical sequence and no activity can commence
until its immediately preceding event is completed.
• The planner decides which milestones should be PERT events and also decides
their “proper” sequence.
• A PERT chart may have multiple pages with many sub-tasks.
38
PERT diagram
39
PERT: Advantages and disadvantages
• Strengths
– PERT chart explicitly defines and makes visible dependencies (precedence
relationships) between the work breakdown structure (commonly WBS) elements
– PERT facilitates identification of the critical path and makes this visible
– PERT facilitates identification of early start, late start, and slack for each activity
– PERT provides for potentially reduced project duration due to better understanding of
dependencies leading to improved overlapping of activities and tasks where feasible.
– The large amount of project data can be organized & presented in diagram for use in
decision making.
• Weaknesses
– There can be potentially hundreds or thousands of activities and individual
dependency relationships
– The lack of a timeframe on most PERT/CPM charts makes it harder to show status
40
Estimations for large scale projects
41
Why the project scale matters?
• Work can’t be perfectly partitioned
Team size
Duration
Team sizeDuration
Perfectly partitioned Not partitionable
42
Large scale project: How fast we can be?
43
Project size: communication overhead
Team size
Overhead,%
Establish
communication
processes
Dividing into
teams
44
Project size: Learning curve
Time
Overhead,%
Learning curve for
new developer
Effort spent
by buddy
Reference performance
45
Learning in large scale project
• Large amount of API, code, documents
• Many people share necessary knowledge
• Resources can be reassigned between domains or teams
• Requirements interference
Time
Overhead,%
Team size
Overhead,%
Project scale
Overhead,%
46
Brooks’ law
Team size
Projectduration
47
Brook law’s parameters
E0 – effort without communication overhead
TS – team size
RI – Requirements Interference, %
LO – Learning Overheads, %
CO – Communication Overheads, %
1+LO*RI*(TS-1)+CO*RI*TS*(TS-1)
TS
Duration = E0*
48
Brooks law with team granularity
For instance for 4 developers and 2 testers:
Team Granularity = (4+2)/4 = 1,5
Total number of people on a project
Maximum amount of people in specific activity
TG =
Team Granularity is a coefficient which shows number of possible parallel activities
on the project.
RI1 + LO *
TS
TG
– 1 + RI*
TS
TG
TS
TG
– 1*
D = E0*
TS
* CO*
49
To be continued…
• Planning
– Critical path method (CPM)
50
Are you awake?
No one knew what rabbit thought,
because he was very well-mannered.

More Related Content

What's hot (19)

PPTX
Daniel dumitrescu
Daniel Dumitrescu
 
PDF
Effort estimation for software development
Spyros Ktenas
 
PPT
Estimating Projects for Time and Cost
rickteplitz
 
PDF
Cost estimating
Glen Alleman
 
PPT
PM Estimation techniques
Chander Parkash
 
DOCX
Software Cost and Effort Esitmation
Muhammad Taqi
 
PDF
software-effort_estimation(updated)9 ch05
Shahid Riaz
 
PPTX
Андрій Татчин "Software Project Estimation: Theory and Reality"
Lviv Startup Club
 
PPT
Unit 2 spm
rrajeeapec
 
PPTX
Software Project Scheduling Diagrams
Saqib Raza
 
PDF
Bottom-up time estimations techiques
J. Scott Christianson
 
PDF
MG6088 SOFTWARE PROJECT MANAGEMENT
Kathirvel Ayyaswamy
 
PPTX
Software Test Estimation
Jatin Kochhar
 
PPTX
Project scheduling and tracking
Computer_ at_home
 
PPT
Wideband Delphi Estimation
Aniruddha Chakrabarti
 
PPTX
Spm unit iii-risk-intro
Kanchana Devi
 
PDF
Basis of Estimate Processes
Glen Alleman
 
PDF
Estimation guidelines and templates
Hoa PN Thaycacac
 
PPT
Project Estimation Presentation - Donte's 8th level of estimating level of ef...
Promet Source
 
Daniel dumitrescu
Daniel Dumitrescu
 
Effort estimation for software development
Spyros Ktenas
 
Estimating Projects for Time and Cost
rickteplitz
 
Cost estimating
Glen Alleman
 
PM Estimation techniques
Chander Parkash
 
Software Cost and Effort Esitmation
Muhammad Taqi
 
software-effort_estimation(updated)9 ch05
Shahid Riaz
 
Андрій Татчин "Software Project Estimation: Theory and Reality"
Lviv Startup Club
 
Unit 2 spm
rrajeeapec
 
Software Project Scheduling Diagrams
Saqib Raza
 
Bottom-up time estimations techiques
J. Scott Christianson
 
MG6088 SOFTWARE PROJECT MANAGEMENT
Kathirvel Ayyaswamy
 
Software Test Estimation
Jatin Kochhar
 
Project scheduling and tracking
Computer_ at_home
 
Wideband Delphi Estimation
Aniruddha Chakrabarti
 
Spm unit iii-risk-intro
Kanchana Devi
 
Basis of Estimate Processes
Glen Alleman
 
Estimation guidelines and templates
Hoa PN Thaycacac
 
Project Estimation Presentation - Donte's 8th level of estimating level of ef...
Promet Source
 

Viewers also liked (20)

PPTX
Large Scale Software Project
Return on Intelligence
 
PPT
Estimating Time & Costs
mairemic
 
PPTX
Stakeholder analysis
Stefan Csosz
 
PPTX
Profsoux2014 presentation by Pavelchuk
Return on Intelligence
 
PPTX
Introduction to python
Return on Intelligence
 
PPTX
Apache Maven 2 Part 2
Return on Intelligence
 
PDF
Apache Maven presentation from BitByte conference
Return on Intelligence
 
PPTX
How to develop your creativity
Return on Intelligence
 
PPT
Quality Principles
Return on Intelligence
 
PPT
English for E-mails
Return on Intelligence
 
PPTX
Windows Azure: Quick start
Return on Intelligence
 
PPTX
Time Management
Return on Intelligence
 
PPTX
Agile Project Grows
Return on Intelligence
 
PPT
Successful interview for a young IT specialist
Return on Intelligence
 
PPTX
Non Blocking Algorithms at Traffic Conditions
Return on Intelligence
 
PPT
Introduction to XML
Return on Intelligence
 
PPT
Jira as a test management tool
Return on Intelligence
 
PPTX
Service design principles and patterns
Return on Intelligence
 
PPTX
Risk Management
Return on Intelligence
 
PPTX
Principles of personal effectiveness
Return on Intelligence
 
Large Scale Software Project
Return on Intelligence
 
Estimating Time & Costs
mairemic
 
Stakeholder analysis
Stefan Csosz
 
Profsoux2014 presentation by Pavelchuk
Return on Intelligence
 
Introduction to python
Return on Intelligence
 
Apache Maven 2 Part 2
Return on Intelligence
 
Apache Maven presentation from BitByte conference
Return on Intelligence
 
How to develop your creativity
Return on Intelligence
 
Quality Principles
Return on Intelligence
 
English for E-mails
Return on Intelligence
 
Windows Azure: Quick start
Return on Intelligence
 
Time Management
Return on Intelligence
 
Agile Project Grows
Return on Intelligence
 
Successful interview for a young IT specialist
Return on Intelligence
 
Non Blocking Algorithms at Traffic Conditions
Return on Intelligence
 
Introduction to XML
Return on Intelligence
 
Jira as a test management tool
Return on Intelligence
 
Service design principles and patterns
Return on Intelligence
 
Risk Management
Return on Intelligence
 
Principles of personal effectiveness
Return on Intelligence
 
Ad

Similar to The art of project estimation (20)

PPTX
The Art of Project Estimation
Return on Intelligence
 
PPT
Unified process
Jean Pаoli
 
PPT
Software engineering -core topics
Amnah_Ch
 
PPTX
Interactive SDLC
Shahriar Iqbal Chowdhury
 
PPT
Proj Mgmt.ppt
NikhilDudka
 
PPT
Software Project management
sameer farooq
 
PPT
req engg (1).ppt
WaniHBisen
 
PPTX
How Microsoft ALM Tools Can Improve Your Bottom Line
Imaginet
 
PPT
Requirements Engineering
MuhammadTalha436
 
PPTX
unit 1 introudction of the file and sepm
rajaramvijayakumarma
 
PPT
Designing the expert system
asimnawaz54
 
PPTX
5_6134023428304274682.pptx
gamingpro22
 
PPT
Seminar on Project Management by Rj
Shree M.L.Kakadiya MCA mahila college, Amreli
 
PDF
PA2557_SQM_Lecture7 - Defect Prevention.pdf
hulk smash
 
PPTX
Agile Bureaucracy
Return on Intelligence
 
PPTX
BooK of EMC Introduction to Big data Analytics Module 2.pptx
mostafasameer858
 
PPT
requirements analysis and design
Preeti Mishra
 
PPT
lecture_Analysis Phase.ppt
AteeqaKokab1
 
PPT
lecture_5 (2).ppt hjhrrgjbgrmgrhbgrgghjd
AqeelAbbas94
 
PPTX
Introduction to Software Engineering_Need_SDLC_types of SDLC
DeepakUlape2
 
The Art of Project Estimation
Return on Intelligence
 
Unified process
Jean Pаoli
 
Software engineering -core topics
Amnah_Ch
 
Interactive SDLC
Shahriar Iqbal Chowdhury
 
Proj Mgmt.ppt
NikhilDudka
 
Software Project management
sameer farooq
 
req engg (1).ppt
WaniHBisen
 
How Microsoft ALM Tools Can Improve Your Bottom Line
Imaginet
 
Requirements Engineering
MuhammadTalha436
 
unit 1 introudction of the file and sepm
rajaramvijayakumarma
 
Designing the expert system
asimnawaz54
 
5_6134023428304274682.pptx
gamingpro22
 
Seminar on Project Management by Rj
Shree M.L.Kakadiya MCA mahila college, Amreli
 
PA2557_SQM_Lecture7 - Defect Prevention.pdf
hulk smash
 
Agile Bureaucracy
Return on Intelligence
 
BooK of EMC Introduction to Big data Analytics Module 2.pptx
mostafasameer858
 
requirements analysis and design
Preeti Mishra
 
lecture_Analysis Phase.ppt
AteeqaKokab1
 
lecture_5 (2).ppt hjhrrgjbgrmgrhbgrgghjd
AqeelAbbas94
 
Introduction to Software Engineering_Need_SDLC_types of SDLC
DeepakUlape2
 
Ad

More from Return on Intelligence (15)

PPTX
Types of testing and their classification
Return on Intelligence
 
PPTX
Differences between Testing in Waterfall and Agile
Return on Intelligence
 
PPTX
Windows azurequickstart
Return on Intelligence
 
PPT
Организация внутренней системы обучения
Return on Intelligence
 
PPTX
Shared position in a project: testing and analysis
Return on Intelligence
 
PPTX
Introduction to Business Etiquette
Return on Intelligence
 
PPTX
Agile Testing Process
Return on Intelligence
 
PPTX
Оценка задач выполняемых по итеративной разработке
Return on Intelligence
 
PPTX
Meetings arranging
Return on Intelligence
 
PPT
Resolving conflicts
Return on Intelligence
 
PPTX
Cross-cultural communication
Return on Intelligence
 
PPTX
Velocity как инструмент планирования и управления проектом
Return on Intelligence
 
PPTX
Testing your code
Return on Intelligence
 
PPTX
Reports Project
Return on Intelligence
 
PPTX
Business Analyst lecture
Return on Intelligence
 
Types of testing and their classification
Return on Intelligence
 
Differences between Testing in Waterfall and Agile
Return on Intelligence
 
Windows azurequickstart
Return on Intelligence
 
Организация внутренней системы обучения
Return on Intelligence
 
Shared position in a project: testing and analysis
Return on Intelligence
 
Introduction to Business Etiquette
Return on Intelligence
 
Agile Testing Process
Return on Intelligence
 
Оценка задач выполняемых по итеративной разработке
Return on Intelligence
 
Meetings arranging
Return on Intelligence
 
Resolving conflicts
Return on Intelligence
 
Cross-cultural communication
Return on Intelligence
 
Velocity как инструмент планирования и управления проектом
Return on Intelligence
 
Testing your code
Return on Intelligence
 
Reports Project
Return on Intelligence
 
Business Analyst lecture
Return on Intelligence
 

Recently uploaded (20)

PDF
Generative AI vs Predictive AI-The Ultimate Comparison Guide
Lily Clark
 
PPTX
OA presentation.pptx OA presentation.pptx
pateldhruv002338
 
PPTX
Agile Chennai 18-19 July 2025 Ideathon | AI Powered Microfinance Literacy Gui...
AgileNetwork
 
PPTX
Applied-Statistics-Mastering-Data-Driven-Decisions.pptx
parmaryashparmaryash
 
PDF
A Strategic Analysis of the MVNO Wave in Emerging Markets.pdf
IPLOOK Networks
 
PPTX
cloud computing vai.pptx for the project
vaibhavdobariyal79
 
PDF
TrustArc Webinar - Navigating Data Privacy in LATAM: Laws, Trends, and Compli...
TrustArc
 
PPTX
What-is-the-World-Wide-Web -- Introduction
tonifi9488
 
PDF
CIFDAQ's Market Wrap : Bears Back in Control?
CIFDAQ
 
PPTX
Introduction to Flutter by Ayush Desai.pptx
ayushdesai204
 
PDF
State-Dependent Conformal Perception Bounds for Neuro-Symbolic Verification
Ivan Ruchkin
 
PDF
Peak of Data & AI Encore - Real-Time Insights & Scalable Editing with ArcGIS
Safe Software
 
PDF
Structs to JSON: How Go Powers REST APIs
Emily Achieng
 
PDF
Research-Fundamentals-and-Topic-Development.pdf
ayesha butalia
 
PDF
Google I/O Extended 2025 Baku - all ppts
HusseinMalikMammadli
 
PDF
Build with AI and GDG Cloud Bydgoszcz- ADK .pdf
jaroslawgajewski1
 
PDF
Economic Impact of Data Centres to the Malaysian Economy
flintglobalapac
 
PPTX
AI and Robotics for Human Well-being.pptx
JAYMIN SUTHAR
 
PDF
Data_Analytics_vs_Data_Science_vs_BI_by_CA_Suvidha_Chaplot.pdf
CA Suvidha Chaplot
 
PDF
Responsible AI and AI Ethics - By Sylvester Ebhonu
Sylvester Ebhonu
 
Generative AI vs Predictive AI-The Ultimate Comparison Guide
Lily Clark
 
OA presentation.pptx OA presentation.pptx
pateldhruv002338
 
Agile Chennai 18-19 July 2025 Ideathon | AI Powered Microfinance Literacy Gui...
AgileNetwork
 
Applied-Statistics-Mastering-Data-Driven-Decisions.pptx
parmaryashparmaryash
 
A Strategic Analysis of the MVNO Wave in Emerging Markets.pdf
IPLOOK Networks
 
cloud computing vai.pptx for the project
vaibhavdobariyal79
 
TrustArc Webinar - Navigating Data Privacy in LATAM: Laws, Trends, and Compli...
TrustArc
 
What-is-the-World-Wide-Web -- Introduction
tonifi9488
 
CIFDAQ's Market Wrap : Bears Back in Control?
CIFDAQ
 
Introduction to Flutter by Ayush Desai.pptx
ayushdesai204
 
State-Dependent Conformal Perception Bounds for Neuro-Symbolic Verification
Ivan Ruchkin
 
Peak of Data & AI Encore - Real-Time Insights & Scalable Editing with ArcGIS
Safe Software
 
Structs to JSON: How Go Powers REST APIs
Emily Achieng
 
Research-Fundamentals-and-Topic-Development.pdf
ayesha butalia
 
Google I/O Extended 2025 Baku - all ppts
HusseinMalikMammadli
 
Build with AI and GDG Cloud Bydgoszcz- ADK .pdf
jaroslawgajewski1
 
Economic Impact of Data Centres to the Malaysian Economy
flintglobalapac
 
AI and Robotics for Human Well-being.pptx
JAYMIN SUTHAR
 
Data_Analytics_vs_Data_Science_vs_BI_by_CA_Suvidha_Chaplot.pdf
CA Suvidha Chaplot
 
Responsible AI and AI Ethics - By Sylvester Ebhonu
Sylvester Ebhonu
 

The art of project estimation

  • 1. www.ExigenServices.com The art of project estimation Damir Tenishev Ph.D., Project Manager July 2013
  • 2. 2 Goals • Understand the goals and scope of estimation • Study estimation approaches • Learn and compare some estimation techniques • Understand applicability for specific techniques • Review common estimation mistakes • Study of the effects of large scale projects on estimates • Share practical experience in estimation Scope: classical estimation techniques
  • 3. 3 What is necessary to make estimations? • Software requirements • Time for estimation • Team of software experts to make estimations • Subject matter experts to clarify the requirements • Knowledge base for implementation approaches and required effort • Information about special conditions (team size, technologies, client-specific) Start when you are ready
  • 4. 4 Expected result • Scope to be implemented • Total effort to be spent to implement the project • Project budget • Project schedule – Project decomposition – Project and key stages’ duration • Staffing plan • Risk management plan • Assumptions It is all about resources
  • 5. 5 Need to be clarified • Product requirements – Functional requirements – Non-functional requirements (performance, stability, scalability, and etc.) – Production, testing and etc. environments • Project requirements – Technologies – Business trip policy – Support policy
  • 6. 6 Effective estimations • Define estimation subject. What you are going to estimate? • Make decomposition and work breakdown structure (WBS) – Divide until you have easy explainable tasks with obvious implementation – Keep breakdown hierarchy – Add dependencies • Use historical data and gathered experience • Use several experts • Make tasks clustering and average estimates • Take into account real productivity of your team Divide and empire
  • 7. 7 Good questions • Explain in one sentence what have to be done? • How this will be used? Who are the end users? • What is the value? Can we drop this? • What is the similar feature we have implemented/estimated before? • What is the effort for implementation and what is estimated duration? • What can be done to make this two times faster, cheaper? • What can be done to parallelize work on this task? What pros and cons will be? • What is the easiest way to implement this feature? • What dependencies do we have from and to other tasks? • Who can do this work? What experience is necessary? • What environment for this task is assumed? • What are the risks? How they can be mitigated? • What is permanent and what can vary in the feature? Communicate!
  • 8. 8 Typical mistakes • Differences in definition of done • Incomplete requirements • Lack of time for clarification and making more precise estimation • Unawareness of time factor for large systems (they are grown, not built) • Mistakes in decomposition • Loosing significant details or parts of functionality • Neglect of communication delays (with customer, experts, and etc.) • Team size is not taken into account (internal communications and other aspects) • Lack of specific knowledge (business area or technology) • Misconception of required and estimated delivery • Ignoring cost of support produced code and data • Ignoring risks • Cognitive biases You have to care about many things
  • 9. 9 Cognitive biases • We do not examine every possible option or every scrap of data before we make a decision • We adopt certain rules of thumb and take other shortcuts when we make choices • In some cases, our cognitive limitations lead to poor estimations • Cognitive biases – Overconfidence – Sunk-cost effect – Availability bias (recency effect) – Confirmation bias – Anchoring bias – Illusory correlation – Hindsight bias Praemonitus, praemunitus
  • 10. 10 Classification of project estimations • By type of estimation – Product metrics – Effort estimation – Duration estimation • By goals – Commercial offer – Forecast and planning • By techniques – By historical model – Expert methods – Parametric What is your goal?
  • 11. 11 Estimation techniques • Historical model usage • Expert methods – Three point estimation – Delphi – Wideband Delphi – Planning poker • Parametric methods – Proxy-based estimation (PROBE) – Function point – Use case point – Weighted Micro Function Points What is your approach?
  • 12. 12 Basic steps: summary • Decomposition • Discovering dependencies • Identification of experts for every specific area • Gathering and clarifying requirements • Analysis for applicability of existing solutions and technologies • Estimating by expert • Tracking reasoning and assumptions for decisions • Identifications of risks • Getting summary estimation for task • Comparison with other tasks’ estimations • Making summary estimation Always have a checklist
  • 13. 13 Three point estimation • Task estimation based on three values – Optimistic (O) – Most likely or normal (M) – Pessimistic (P) • Double triangular distribution is used S = 0.5 S = 0.5 MO P
  • 14. 14 Three point estimation: math Expected time Standard deviation Project time Project standard deviation Assumption: All project’s tasks are consecutive.
  • 15. 15 Three point estimation: confidence level Confidence level Standard deviation 68 % SD 90 % 1.645 x SD 95 % 2 x SD 99.7 % 3 x SD Note: Information systems typically use the 90% confidence level for all project and task estimates.
  • 16. 16 Three point estimation: example Tasks O M P E SD Task 1 1 3 8 Task 2 2 5 20 Confidence 68 % (E ± SD ) 90 % (E ± 1.645*SD) 95 % (E ± 2 *SD) 99.7 % (E ± 3*SD) Task 1 3.5 ± 1.17=> 2.33 to 4.66 1.58 to 5.42 1.17 to 5.83 Task 2 7± 3 => 4 to 10 2.06 to 11.93 2 to 9 Project (consecutive tasks):
  • 17. 17 Delphi method: estimation matrix Expert 1 Expert 2 Expert 3 Average Task 1 Attempt 1 Attempt 2 Attempt 3 10 10 11 5 8 10 20 15 12 11.7 11 11 Task 2 Attempt 1 Attempt 2 Attempt 3 15 16 18 30 20 18 8 20 19 17.7 18.7 18.3 Task 3 Attempt 1 Attempt 2 Attempt 3 11 10 8 4 5 6 6 7 7 7 7.3 7 • Decomposition into tasks • Anonymous estimation • Announcement of average estimation as well as reasons for them • Transition to next estimation iteration
  • 18. 18 Delphi method: features and applicability • Strengths – Works well for ambiguity – Lead to joint agreement and corporate liability – Easy to adopt to time restrictions – Anonymous estimations eliminate authority influence – Assumptions are documented, discussed and agreed • Weaknesses – There is no formal reasoning for estimation. As a result there is no formal reasoning for customer – Decomposition rules are not defined – Some creative ideas can be lost since majority opinion is prevail – It is possible that people will agree with other’s estimate without cogitation – Need to have at least 4 experts
  • 19. 19 Wideband Delphi method Involves greater interaction and more communication between participants Execution steps 1. Coordinator presents each expert with a specification and an estimation form. 2. Coordinator calls a group meeting in which the experts discuss estimation issues with the coordinator and each other. 3. Experts fill out forms anonymously. 4. Coordinator prepares and distributes a summary of the estimates 5. Coordinator calls a group meeting, specifically focusing on having the experts discuss points where their estimates vary widely 6. Experts fill out forms, again anonymously, and steps 4 to 6 are iterated for as many rounds as appropriate.
  • 20. 20 Planning poker (sprint planning meeting, planning game)
  • 21. 21 Planning poker: pros and cons Pros: • It is fun! • Minimizes anchoring • Team work which build up a team • Corporate liability • Expertized and reasoning sharing Cons: • Expensive • Can take significant time for clarifications • Difficult to implement in distributed projects • Difficult to make “weight” to experts’ estimates • Personalities can affect the estimates
  • 22. 22 Proxy-based estimation (PROBE) method • Used mostly in feasibility studies (evaluating best process, economic feasibility of the project) • Divide requirements by classes • Every class must be estimated by – Complexity – Size • Class assigned to every specific task
  • 23. 23 Template for PROBE method Requirement/task Class Effort Retrieve image 1 3.5 hours Print of screen 2 4.6 hours Print on paper 2 4.6 hours Class Size Complexity Effort 1: data retrieval 1 2 3.5 hours 2: image printing 2 2 4.6 hours Small Medium Large Simple 1.5 hours 2.3 hours 3.8 hours Normal 3.5 hours 4.6 hours 5.9 hours Complex 5.5 hours 6.7 hours 8.1 hours
  • 24. 24 PROBE: features and applicability • Strengths – Similar tasks estimates in the same way – Simplifies staffing and resource assignment • Weaknesses – Need deep understanding of the technology – Provides very rough estimations
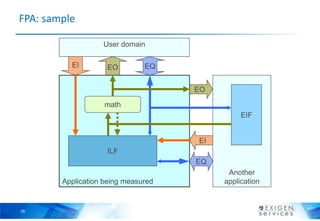
  • 25. 25 Functional point analysis: terms • Logical data types – Internal logical file (ILF) – user visible internal data structure – External interface file (EIF) – data, used by application, but exists outside of application • Processes – External input (EI) – process of data transfer from user or EIF to ILF. – External output (EO) – process of data transfer from one or many ILF to user or EIF with mandatory data conversion (processing). – External inquiries (EQ) – process of data transfer without conversion. • Data elements – Record Element Type (RET) - user recognizable sub group of data elements – File Type Referenced (FTR) - file type referenced by a transaction – Data Element Type (DET) - unique user recognizable, non-recursive field
  • 26. 26 FPA: sample Application being measured Another application ILF EIF math User domain EI EO EO EI EQ EQ
  • 27. 27 Functional point analysis: approach • Assign specific weight to every data type, interface, and process • Calculation of unadjusted function point (UFP) based on number of elements and their weights. • Calculate Value Adjustment Factor (VAF) based on technical and environmental requirements (General System Characteristics (GSC) - by tables with weights for every specific case). • Calculation of adjusted function points (AFP) based on UFP and coefficient above.
  • 28. 28 FPA: features and applicability • Strengths – Indifferent to implementation process and technology – Artifacts can be used for further architecture development – Provide estimation in “common units” and shows project’s complexity independently of supplier competency – Can be made by one person or can be made in parallel to speed up • Weaknesses – Requires a lot of time to understand and apply in correct way. – Difficult to adjust to specific company processes and experience. – Doesn’t provide decomposition for production stages and operations.
  • 29. 29 Use Case Points Used when Unified Modeling Language (UML) and Rational Unified Process (RUP) methodologies are being used for software design and development. • Unadjusted Use Case Weight (UUCW) – number and complexity of use cases • Unadjusted Actor Weight (UAW) - number and complexity of actors • Technical Complexity Factor (TCF) - technical aspects of development • Environmental Complexity Factor (ECF) - environmental factors
  • 30. 30 Unadjusted Use Case Weight (UUCW) • Based on the number and complexity of the use cases for the system • To find the UUCW for a system, each of the use cases must be identified and classified as Simple, Average or Complex based on the number of transactions the use case contains Use Case Classification No. of Transactions Weight Simple 1 to 3 transactions 5 Average 4 to 7 transactions 10 Complex 8 or more transactions 15
  • 31. 31 Unadjusted Actor Weight (UAW) • Calculated based on the number and complexity of the actors for the system • Actors must be identified and classified as Simple, Average or Complex based the type of actor Actor Classification Type of Actor Weight Simple External system that must interact with the system using a well-defined API 1 Average External system that must interact with the system using standard communication protocols (e.g. TCP/IP, FTP, HTTP, database) 2 Complex Human actor using a GUI application interface 3
  • 32. 32 Technical Complexity Factor (TCF) • Determined by assigning a score (perceived complexity factor) between 0 (factor is irrelevant) and 5 (factor is essential) to each of the 13 technical factors listed in the table • This score is then multiplied by the defined weighted value for each factor. Factor Description Weight T1 Distributed system 2.0 T2 Response time/performance objectives 1.0 T3 End-user efficiency 1.0 T4 Internal processing complexity 1.0 … … …
  • 33. 33 Environmental Complexity Factor (ECF) • It is determined by assigning a score between 0 (no experience) and 5 (expert) to each of the 8 environmental factors listed in the table • This score is then multiplied by the defined weighted value for each factor. Factor Description Weight E1 Familiarity with development process used 1.5 E2 Application experience 0.5 E3 Object-oriented experience of team 1.0 E4 Lead analyst capability 0.5 E5 Motivation of the team 1.0 … … …
  • 34. 34 Use Case Points (UCP) Finally the UCP can be calculated once the unadjusted project size (UUCW and UAW), technical factor (TCF) and environmental factor (ECF) have been determined. The UCP is calculated based on the following formula: UCP = (UUCW + UAW) * TCF * ECF This estimation includes development only. It not consider testing, configuration management, support, and etc.
  • 35. 35 Use case points: features and applicability • Strengths – Not necessary to involve the experts – Technical expertize not needed – Can be used for rough pre-sale estimation – Can be made very fast – Intuitive enough for the customer • Weaknesses – Estimates only requirements, but not tasks. They have to be estimated later. – Strongly depends on requirements completeness – Coefficients need to be adjusted for the company
  • 36. 36 Weighted Micro Function Points • Produces more accurate results than traditional software sizing methodologies, while requiring less configuration and knowledge from the end user, as most of the estimation is based on automatic measurements of an existing source code. • Uses a parser to understand the source code breaking it down into micro functions and derive several code complexity and volume metrics, which are then dynamically interpolated into a final effort score. • As a result can be used only with analogy based cost predictions.
  • 37. 37 Project evaluation and review technique (PERT) Statistical tool that is designed to analyze and represent the tasks involved in completing a given project. Commonly used in conjunction with the critical path method (CPM). • A PERT chart is a tool that facilitates decision making. The first draft of a PERT chart will number its events sequentially in 10s (10, 20, 30, etc.) to allow the later insertion of additional events. • Two consecutive events in a PERT chart are linked by activities, which are conventionally represented as arrows. • The events are presented in a logical sequence and no activity can commence until its immediately preceding event is completed. • The planner decides which milestones should be PERT events and also decides their “proper” sequence. • A PERT chart may have multiple pages with many sub-tasks.
  • 39. 39 PERT: Advantages and disadvantages • Strengths – PERT chart explicitly defines and makes visible dependencies (precedence relationships) between the work breakdown structure (commonly WBS) elements – PERT facilitates identification of the critical path and makes this visible – PERT facilitates identification of early start, late start, and slack for each activity – PERT provides for potentially reduced project duration due to better understanding of dependencies leading to improved overlapping of activities and tasks where feasible. – The large amount of project data can be organized & presented in diagram for use in decision making. • Weaknesses – There can be potentially hundreds or thousands of activities and individual dependency relationships – The lack of a timeframe on most PERT/CPM charts makes it harder to show status
  • 40. 40 Estimations for large scale projects
  • 41. 41 Why the project scale matters? • Work can’t be perfectly partitioned Team size Duration Team sizeDuration Perfectly partitioned Not partitionable
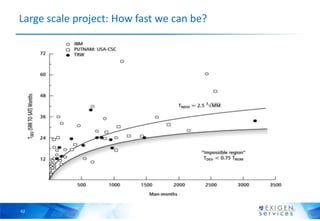
  • 42. 42 Large scale project: How fast we can be?
  • 43. 43 Project size: communication overhead Team size Overhead,% Establish communication processes Dividing into teams
  • 44. 44 Project size: Learning curve Time Overhead,% Learning curve for new developer Effort spent by buddy Reference performance
  • 45. 45 Learning in large scale project • Large amount of API, code, documents • Many people share necessary knowledge • Resources can be reassigned between domains or teams • Requirements interference Time Overhead,% Team size Overhead,% Project scale Overhead,%
  • 47. 47 Brook law’s parameters E0 – effort without communication overhead TS – team size RI – Requirements Interference, % LO – Learning Overheads, % CO – Communication Overheads, % 1+LO*RI*(TS-1)+CO*RI*TS*(TS-1) TS Duration = E0*
  • 48. 48 Brooks law with team granularity For instance for 4 developers and 2 testers: Team Granularity = (4+2)/4 = 1,5 Total number of people on a project Maximum amount of people in specific activity TG = Team Granularity is a coefficient which shows number of possible parallel activities on the project. RI1 + LO * TS TG – 1 + RI* TS TG TS TG – 1* D = E0* TS * CO*
  • 49. 49 To be continued… • Planning – Critical path method (CPM)
  • 50. 50 Are you awake? No one knew what rabbit thought, because he was very well-mannered.

Editor's Notes

  • #10: Overconfidence Psychologists have shown that human beings are systematically overconfident in our judgmentsThe sunk-cost effect refers to the tendency for people to escalate commitment to a course of action in which theyhave made substantial prior investments of time, money, or other resources. The recency effect is actually one particular form of what is called the availability bias – the last is most confidence.Confirmation bias refers to our tendency to gather and rely on information that confirms our existing views andto avoid or downplay information that disconfirms our preexisting hypotheses.Anchoring bias refers to the notion that we sometimes allow an initial reference point to distort our estimates.Illusory correlation - explains why stereotypes often form and persist.Hindsight bias - refers to the fact that we look back at past events and judge them as easily predictable when theyclearly were not as easily foreseen.