The Other HPC: High Productivity Computing in Polystore Environments
Download as PPTX, PDF1 like436 views

Talk at Teradata June 2017 on polystore systems and optimization, emphasizing productivity in heterogeneous data analysis environments.


![34
k1 k2
[0]
v1
[‘’]
v2
a 37 7 ‘dan’
a 20 0 ‘’
b 25 0 ‘dylan'
b 20 2 ‘bill’
⋈⊗
⋈
extf⨁
Join Union Extension
Objects:
Associative Tables
Operators:
Join and Union adapted from:
M. Spight and V. Tropashko.
First steps in relational lattice. 2006.
Ext is a restricted form
of monadic bind
Total functions from keys
to values with finite support
Default Values
ValuesKeys
Attributes
“horizontal
concat”
“vertical
concat”
“flatmap”
UDFs: ⊗, ⨁, f
Think “Semiring”
⊗⋈⊕
Support](https://image.slidesharecdn.com/howeteradatajune2017-170807213145/85/The-Other-HPC-High-Productivity-Computing-in-Polystore-Environments-34-320.jpg)
![Join: Horizontal
Concat
35
a c
[0]
x
[0]
z
a1 c1 11 1
a1 c2 12 2
a2 c1 13 3
a3 c3 14 4
c b
[0']
z
[0']
y
c1 b1 5 15
c2 b1 6 16
c2 b2 7 17
c4 b1 8 18
⋈⊗ = a c b
[0 ⊗ 0']
z
a1 c1 b1 1 ⊗ 5
a1 c2 b1 3 ⊗ 5
a1 c2 b2 2 ⊗ 6
(a3 c3 b1 4 ⊗ 0
= 0 ⊗ 0')
Requires:
vA ⊗ 0' = 0 ⊗ vB = 0 ⊗ 0'](https://image.slidesharecdn.com/howeteradatajune2017-170807213145/85/The-Other-HPC-High-Productivity-Computing-in-Polystore-Environments-35-320.jpg)
![Union:
Vertical Concat
36
= c
[0]
x
[0 ⨁ 0 = 0]
z
[0]
y
c1 11 ⨁ 13 1 ⨁ 3 ⨁ 5 15
c2 12 2 ⨁ 6 ⨁ 7 16 ⨁ 17
c3 14 14 0
c4 0 8 18
⋈
⨁
a c
[0]
x
[0]
z
a1 c1 11 1
a1 c2 12 2
a2 c1 13 3
a3 c3 14 4
c b
[0]
z
[0]
y
c1 b1 5 15
c2 b1 6 16
c2 b2 7 17
c4 b1 8 18
Requires:
v ⨁ 0 = 0 ⨁ v = v](https://image.slidesharecdn.com/howeteradatajune2017-170807213145/85/The-Other-HPC-High-Productivity-Computing-in-Polystore-Environments-36-320.jpg)
![Ext:
Flatmap
37
a c
[0]
x
[0]
z
a1 c1 11 1
a1 c2 12 2
a2 c1 13 3
=
a c k'
[0 – 0 = 0]
v'
a1 c1 a1c1 11 – 5
a1 c1 c1a1 5 – 11
a1 c2 a1c2 12 – 2
a1 c2 c2a1 2 – 12
a2 c1 a2c1 13 – 3
a2 c1 c1a2 3 – 13
extf
k' v'
ac x – z
ca z – x
f(a, c, x, z) =
Requires:](https://image.slidesharecdn.com/howeteradatajune2017-170807213145/85/The-Other-HPC-High-Productivity-Computing-in-Polystore-Environments-37-320.jpg)


![Query compilation for distributed processing
pipeline
as
parallel
code
parallel compiler
machine
code
[Myers ’14]
pipeline
fragment
code
pipeline
fragment
code
sequential
compiler
machine
code
[Crotty ’14, Li ’14, Seo ’14, Murray ‘11]
sequential
compiler](https://image.slidesharecdn.com/howeteradatajune2017-170807213145/85/The-Other-HPC-High-Productivity-Computing-in-Polystore-Environments-41-320.jpg)


![Fairness
Accountability
Transparency
Privacy
Reproducibility
Fides: A platform for responsible data science
joint with Stoyanovich [US], Abiteboul [FR], Miklau [US], Sahuguet [US], Weikum [DE]
Data Curation
novel features to support:
So what do we do about it?](https://image.slidesharecdn.com/howeteradatajune2017-170807213145/85/The-Other-HPC-High-Productivity-Computing-in-Polystore-Environments-78-320.jpg)


![09 searching[1]](https://cdn.slidesharecdn.com/ss_thumbnails/09searching1-151214231012-thumbnail.jpg?width=560&fit=bounds)


![[系列活動] 資料探勘速遊](https://cdn.slidesharecdn.com/ss_thumbnails/0114ycchendmquicktour-170110050658-thumbnail.jpg?width=560&fit=bounds)


Ad
More Related Content
What's hot (20)
Similar to The Other HPC: High Productivity Computing in Polystore Environments (20)


Ad
More from University of Washington (20)


Ad
Recently uploaded (20)


The Other HPC: High Productivity Computing in Polystore Environments
- 1. The Other HPC: High Productivity Computing in Polystore Environments Bill Howe, Ph.D. Associate Professor, Information School Adjunct Associate Professor, Computer Science & Engineering Associate Director, eScience Institute Director, Urbanalytics Group 8/7/2017 Bill Howe, UW 1
- 2. Time Amountofdataintheworld Time Processingpower What is the rate-limiting step in data understanding? Processing power: Moore’s Law Amount of data in the world
- 3. Processingpower Time What is the rate-limiting step in data understanding? Processing power: Moore’s Law Human cognitive capacity Idea adapted from “Less is More” by Bill Buxton (2001) Amount of data in the world slide src: Cecilia Aragon, UW HCDE
- 4. Productivity How long I have to wait for results monthsweeksdayshoursminutessecondsmilliseconds HPC Systems Databases feasibility threshold interactivity threshold Claim: Only these two performance thresholds are generally important; other performance requirements are application-specific
- 5. 8/7/2017 Bill Howe, UW 5 priority is machine efficiency HPC DB/ Dataflow priority is developer efficiency data manipulation considered pre-processing batch analysis considered post- processing batch and interactive
- 6. Observations • Every interesting application has both a data manipulation component and an analytics component • Different people like to express things different ways • Different systems offer better performance at different things • …but in between people and systems, there is no real difference in expressiveness between linear and relational algebra • So we want full “anything anywhere” rewrites8/7/2017 Bill Howe, UW 6
- 7. Observations • Every interesting application has both a data manipulation component and an analytics component • Different people like to express things different ways • Different systems offer better performance at different things • …but in between people and systems, there is no real difference in expressiveness between linear and relational algebra • So we want full “anything anywhere” rewrites8/7/2017 Bill Howe, UW 7
- 8. Matrix Multiply select A.i, B.k, sum(A.val*B.val) from A, B where A.j = B.j group by A.i, B.k Matrix multiply in RA Sparse means: |non-zero elements| < |rows|~1.2 Naïve sparse algorithm: |non-zero elements|*|rows| Best-known dense algorithm: |rows|2.38 Matrix multiply
- 9. sparsity exponent r where m=nr Complexity exponent n2.38 mn m0.7n1.2+n2 slide adapted from ZwickR. Yuster and U. Zwick, Fast Sparse Matrix Multiplication n = number of rows m = number of non-zerosComplexity of matrix multiply naïve sparse algorithm best known sparse algorithm best known dense algorithmlots of room here
- 10. Single-Server Experiment Top-shelf SQL (Hyper) vs. Top-shelf Dense Library (MKL BLAS) vs. Top-shelf Sparse Library (MKL SpBLAS) Who wins? By how much?
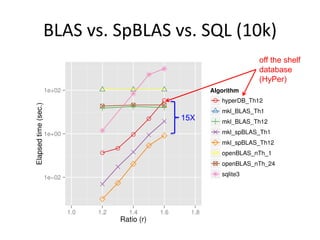
- 11. BLAS vs. SpBLAS vs. SQL (10k) off the shelf database (HyPer) 15X
- 12. Single Node Sparse Matrix Multiply: BLAS vs. SpBLAS vs. HyperDB (N=20k) 1. Dense is not competitive 2. 50X-100X gap between DB and library
- 13. Single Node Sparse Matrix Multiply: BLAS vs. SpBLAS vs. SQL (N=50k) 1. Dense is not competitive 2. 10X-50X gap between DB and library
- 14. Single Node Sparse Matrix Multiply: Relative Speedup of SpBLAS vs. HyperDB 100X on small data “Only” 5X on big data
- 15. Single Node Sparse Matrix Multiply: SpBLAS vs. SQL (Real Data) About 5X on Real Data
- 16. Distributed Experiment MyriaX vs. CombBLAS Who wins? By how much?
- 17. CombBLAS vs. MyriaX (N=50k) on star 8X to 45X
- 18. CombBLAS vs. MyriaX (Real Data) • CombBLAS 10X faster on one dataset • MyriaX 1.5X faster on another!
- 19. A x B x C select AB.i, C.m, sum(AB.val*C.val) from (select A.i, B.k, sum(A.val*B.val) from A, B where A.j = B.j group by A.i, B.k ) AB, C where AB.k = C.k group by AB.i, C.m select A.i, C.m, sum(A.val*B.val*C.val) from A, B, C where A.j = B.j and B.k = C.k group by A.i, C.m group . join . join group . join . group . join
- 20. Observations • Every interesting application has both a data manipulation component and an analytics component • Different people like to express things different ways • Different systems offer better performance at different things • …but in between people and systems, there is no real difference in expressiveness between linear and relational algebra • So we want full “anything anywhere” rewrites 8/7/2017 Bill Howe, UW 20
- 21. 8/7/2017 Bill Howe, UW 21
- 22. 8/7/2017 Bill Howe, UW 22 Linear Algebra Relational Algebra
- 24. 8/7/2017 Bill Howe, UW 24
- 25. 8/7/2017 Bill Howe, UW 25
- 26. Example: Combine measurements from sensors, compute means & covariances 26 Preprocessing (easier to express in RA) Analysis (easier to express in LA) Dylan Hutchison
- 27. Example: Sensor Difference Mean & Covariance 27 https://arrayofthings.github.io/ t c v 466 temp 55.2 466 hum 40.1 492 temp 56.3 492 hum 35.0 528 temp 56.5 Filter, bin onto common time buckets Filter, bin onto common time buckets Subtract Compute Mean Compute Covariance Preprocessing (easier to express in RA) Analysis (easier to express in LA) Array of Things Sensor Data Collected in CSV files Dylan Hutchison
- 28. Bin query: easy in RA, harder in LA 28 t c v 466 temp 55.2 466 hum 40.1 492 temp 56.3 492 hum 35.0 528 temp 56.5 𝑡𝑒𝑚𝑝 ℎ𝑢𝑚 466 492 528 55.2 40.1 𝟓𝟔.𝟑 35.0 𝟓𝟔.𝟓 t’ c v 460 temp 55.2 460 hum 40.1 520 temp 56.4 520 hum 35.0 𝑡𝑒𝑚𝑝 ℎ𝑢𝑚 460 520 55.2 40.1 𝟓𝟔.𝟒 35.0 bin 𝑡 = 𝑡 − 𝑡 % 60 + 60 𝑡 % 60 60 + .5 LA Multiply: using avg on added elements 466 492 528 460 520 1 1 1 RA SELECT bin(t) AS t', c, avg(v) AS v GROUP BY t', c * = Dylan Hutchison
- 29. Covariance query: easy in LA, harder in RA 29 𝑋 is an 𝑛 ⨉ 𝑑 matrix 𝑀 = 1 𝑛 1 𝑇 𝑋 is a 1 ⨉ 𝑑 matrix 𝐶 = 1 𝑛 𝑋 𝑇 𝑋 − 𝑀 𝑇 𝑀 is a 𝑑 ⨉ 𝑑 matrix LA N = size(X, 1); M = mean(X, 1); C = X'*X / N – M'*M; Carlos Ordonez. Building Statistical Models and Scoring with UDFs. SIGMOD 2007. 𝑥11 𝑥12 𝑥21 𝑥22 𝑥31 𝑥32 d attributes n points RA (Generated SQL statements for each entry) T = SELECT FROM X sum(1.0) AS N, sum(X1) AS M1, sum(X2) AS M2, …, sum(Xd) AS Md, sum(X1*X1) AS Q11, sum(X1*X2) AS Q12, …, sum(Xd-1*Xd) AS Q(d-1)d, sum(Xd*Xd) AS Qdd C = SELECT FROM T (1 AS i, 1 AS j, Q11/N – M1*M1 AS v) UNION (1 AS i, 2 AS j, Q12/N – M1*M2 AS v) UNION … Dylan Hutchison
- 30. LARA: COMPREHENSIVE UNIFIED LINEAR AND RELATIONAL ALGEBRA 30
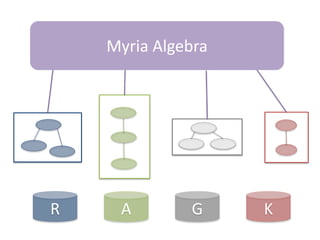
- 31. R A G K Myria Algebra
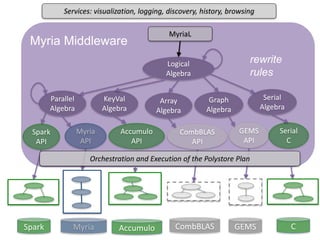
- 32. Spark Myria CombBLAS GEMS Parallel Algebra Logical Algebra Myria Middleware CombBLAS API Spark API Myria API GEMS API rewrite rules Array Algebra MyriaL Services: visualization, logging, discovery, history, browsing Orchestration and Execution of the Polystore Plan Graph Algebra Accumulo KeyVal Algebra Accumulo API Serial C Serial Algebra C
- 33. Spark Myria CombBLAS GEMS Parallel Algebra Logical Algebra Myria Middleware CombBLAS API Spark API Myria API GEMS API rewrite rules Array Algebra MyriaL Services: visualization, logging, discovery, history, browsing Orchestration and Execution of the Polystore Plan Graph Algebra Accumulo KeyVal Algebra Accumulo API Serial C Serial Algebra C LARA Algebra LARA API LARA Physical Plans LaraDB (Accumulo)
- 34. 34 k1 k2 [0] v1 [‘’] v2 a 37 7 ‘dan’ a 20 0 ‘’ b 25 0 ‘dylan' b 20 2 ‘bill’ ⋈⊗ ⋈ extf⨁ Join Union Extension Objects: Associative Tables Operators: Join and Union adapted from: M. Spight and V. Tropashko. First steps in relational lattice. 2006. Ext is a restricted form of monadic bind Total functions from keys to values with finite support Default Values ValuesKeys Attributes “horizontal concat” “vertical concat” “flatmap” UDFs: ⊗, ⨁, f Think “Semiring” ⊗⋈⊕ Support
- 35. Join: Horizontal Concat 35 a c [0] x [0] z a1 c1 11 1 a1 c2 12 2 a2 c1 13 3 a3 c3 14 4 c b [0'] z [0'] y c1 b1 5 15 c2 b1 6 16 c2 b2 7 17 c4 b1 8 18 ⋈⊗ = a c b [0 ⊗ 0'] z a1 c1 b1 1 ⊗ 5 a1 c2 b1 3 ⊗ 5 a1 c2 b2 2 ⊗ 6 (a3 c3 b1 4 ⊗ 0 = 0 ⊗ 0') Requires: vA ⊗ 0' = 0 ⊗ vB = 0 ⊗ 0'
- 36. Union: Vertical Concat 36 = c [0] x [0 ⨁ 0 = 0] z [0] y c1 11 ⨁ 13 1 ⨁ 3 ⨁ 5 15 c2 12 2 ⨁ 6 ⨁ 7 16 ⨁ 17 c3 14 14 0 c4 0 8 18 ⋈ ⨁ a c [0] x [0] z a1 c1 11 1 a1 c2 12 2 a2 c1 13 3 a3 c3 14 4 c b [0] z [0] y c1 b1 5 15 c2 b1 6 16 c2 b2 7 17 c4 b1 8 18 Requires: v ⨁ 0 = 0 ⨁ v = v
- 37. Ext: Flatmap 37 a c [0] x [0] z a1 c1 11 1 a1 c2 12 2 a2 c1 13 3 = a c k' [0 – 0 = 0] v' a1 c1 a1c1 11 – 5 a1 c1 c1a1 5 – 11 a1 c2 a1c2 12 – 2 a1 c2 c2a1 2 – 12 a2 c1 a2c1 13 – 3 a2 c1 c1a2 3 – 13 extf k' v' ac x – z ca z – x f(a, c, x, z) = Requires:
- 38. Summary: Union, Join, Ext 38 Key Types Value Types Support Union ( 𝑨 ⊕ 𝑩 ) = 𝐾 𝐴 ∩ 𝐾 𝐵 = 𝑉 𝐴 ∪ 𝑉 𝐵 ⊆ 𝑆 𝐴 ∪ 𝑆 𝐵 Join ( 𝑨 ⋈⊗ 𝑩 ) = 𝐾 𝐴 ∪ 𝐾 𝐵 = 𝑉 𝐴 ∩ 𝑉 𝐵 ⊆ 𝑆𝐴 ∩ 𝑆 𝐵 Ext ( extf A ) extended by f set by f ⊆ 𝑆𝐴 × 𝑆𝑓 ⋈ For Support, ‘⊆’ becomes ‘=’ if ⊕ is zero-sum-free or ⊗ has zero-product-property Duality
- 39. > If ⨁ or ⊗ is associative, commutative, or idempotent, then so is Union or Join > (Push Aggregation into Join) If ⊗ distributes over ⨁, > (Distribute Join over Union) If , then LARA Properties 39 = sum(AB ⊗ CT)
- 40. RADISH: COMPILING QUERIES TO HPC ARCHITECTURES
- 41. Query compilation for distributed processing pipeline as parallel code parallel compiler machine code [Myers ’14] pipeline fragment code pipeline fragment code sequential compiler machine code [Crotty ’14, Li ’14, Seo ’14, Murray ‘11] sequential compiler
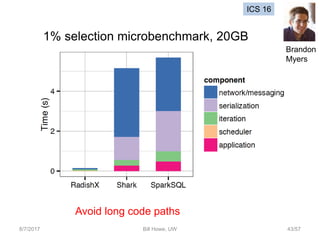
- 43. 8/7/2017 Bill Howe, UW 43/57 1% selection microbenchmark, 20GB Avoid long code paths ICS 16 Brandon Myers
- 44. 8/7/2017 Bill Howe, UW 44/57 Q2 SP2Bench, 100M triples, multiple self-joins Communication optimization ICS 16 Brandon Myers
- 45. Graph Patterns 45 • SP2Bench, 100 million triples • Queries compiled to a PGAS C++ language layer, then compiled again by a low-level PGAS compiler • One of Myria’s supported back ends • Comparison with Shark/Spark, which itself has been shown to be 100X faster than Hadoop-based systems • …plus PageRank, Naïve Bayes, and more RADISH ICS 16 Brandon Myers
- 46. 8/7/2017 Bill Howe, UW 46 ICS 15 RADISH ICS 16 Brandon Myers
- 47. Recap • Productivity is the new performance • …but this doesn’t mean give up on orders of magnitude performance difference by doing everything on one system • Everything interesting is LA + RA • There is no difference except syntax and systems • We want to comprehensively optimize across them, generate code anywhere
- 48. Other Productivity Work • Workload Analytics for SQL Data Lakes – Shrainik Jain • AI for Scientific Data Curation – Maxim Grechkin, Hoing Poon (MSR) • Visualization Recommendation – Kanit “Ham” Wongsuphasawat, Dom Moritz, Jeff Heer • Information Extraction from Scientific Figures – Poshen Lee, Sean Yang • Scalable Approximate Community Detection – Seung-Hee Bae (Western Michigan)
- 49. The SQLShare Corpus: A multi-year log of hand-written SQL queries Queries 24275 Views 4535 Tables 3891 Users 591 SIGMOD 2016 Shrainik Jain https://uwescience.github.io/sqlshare Workload Analytics for Data Lakes
- 50. lifetime = days between first and last access of table SIGMOD 2016 Shrainik Jain http://uwescience.github.io/sqlshare/ Data “Grazing”: Short dataset lifetimes
- 52. Key idea: Embed queries as vectors • Learn query embeddings; use them for all workload analytics tasks: – Query recommendation – Workload summarization / index selection – User behavior modeling – Predicting heavy hitters – Forensics • Get rid of specialized feature engineering
- 53. Doc2Vec on SQL Can we recover known patterns in the workload? TPC-H queries, generated with different parameters
- 54. Can we recover known patterns in the workload? TPC-H queries, generated with different parameters Doc2Vec on Templatized Query Plans
- 55. Workload Summarization and Index Selection
- 56. DEEP CURATION FOR SCIENTIFIC DATA LAKES
- 58. 8/7/2017 Bill Howe, UW 58 Microarray samples submitted to the Gene Expression Omnibus Curation is fast becoming the bottleneck to data sharing Maxim Gretchkin Hoifung Poon
- 59. Maxim Gretchkin Hoifung Poon No growth in number of datasets used per paper!
- 60. Maxim Gretchkin Hoifung Poon Majority of samples are one-time-use only!
- 61. color = labels supplied as metadata clusters = 1st two PCA dimensions on the gene expression data itself Can we use curate algorithmically? Maxim Gretchkin Hoifung Poon The expression data and the text labels appear to disagree
- 62. Maxim Gretchkin Hoifung Poon Better Tissue Type Labels Domain knowledge (Ontology) Expression data Free-text Metadata 2 Deep Networks text expr SVM NIPS 18 (review)
- 63. Deep Curation Maxim Gretchkin Hoifung Poon Distant supervision and co-learning between text- based classified and expression-based classifier: Both models improve by training on each others’ results. Free-text classifier Expression classifier NIPS 18 (review)
- 64. Deep Curation: Our stuff wins, with ZERO training data Maxim Gretchkin Hoifung Poon state of the art our reimplementation of the state of the art our dueling pianos NN amount of training data used NIPS 18 (review)
- 65. Viziometrics: Analysis of Visualization in the Scientific Literature Proportion of non-quantitative figures in paper Paper impact, grouped into 5% percentiles Poshen Lee
- 66. Voyager 8/7/2017 Bill Howe, UW 66 Kanit “Ham” Wongsuphasawat Dominik Moritz InfoVis 15
- 67. Seung-Hee BaeScalable Graph Clustering Version 1 Parallelize Best-known Serial Algorithm ICDM 2013 Version 2 Free 30% improvement for any algorithm TKDD 2014 SC 2015 Version 3 Distributed approx. algorithm, 1.5B edges
- 68. RESPONSIBLE DATA SCIENCE 8/7/2017 Bill Howe, UW 68
- 70. 70 The Special Committee on Criminal Justice Reform's hearing of reducing the pre-trial jail population. Technical.ly, September 2016 Philadelphia is grappling with the prospect of a racist computer algorithm Any background signal in the data of institutional racism is amplified by the algorithm operationalized by the algorithm legitimized by the algorithm “Should I be afraid of risk assessment tools?” “No, you gotta tell me a lot more about yourself. At what age were you first arrested? What is the date of your most recent crime?” “And what’s the culture of policing in the neighborhood in which I grew up in?”
- 71. 8/7/2017 Bill Howe, UW 71 Amazon Prime Now Delivery Area: Atlanta Bloomberg, 2016
- 72. 8/7/2017 Bill Howe, UW 72 Amazon Prime Now Delivery Area: Boston Bloomberg, 2016
- 73. 8/7/2017 Bill Howe, UW 73 Amazon Prime Now Delivery Area: Chicago Bloomberg, 2016
- 74. First decade of Data Science research and practice: What can we do with massive, noisy, heterogeneous datasets? Next decade of Data Science research and practice: What should we do with massive, noisy, heterogeneous datasets? The way I think about this…..(1)
- 75. The way I think about this…. (2) Decisions are based on two sources of information: 1. Past examples e.g., “prior arrests tend to increase likelihood of future arrests” 2. Societal constraints e.g., “we must avoid racial discrimination” 8/7/2017 Data, Responsibly / SciTech NW 75 We’ve become very good at automating the use of past examples We’ve only just started to think about incorporating societal constraints
- 76. The way I think about this… (3) How do we apply societal constraints to algorithmic decision-making? Option 1: Rely on human oversight Ex: EU General Data Protection Regulation requires that a human be involved in legally binding algorithmic decision-making Ex: Wisconsin Supreme Court says a human must review algorithmic decisions made by recidivism models Issues with scalability, prejudice Option 2: Build systems to help enforce these constraints This is the approach we are exploring 8/7/2017 Data, Responsibly / SciTech NW 76
- 77. The way I think about this…(4) On transparency vs. accountability: • For human decision-making, sometimes explanations are required, improving transparency – Supreme court decisions – Employee reprimands/termination • But when transparency is difficult, accountability takes over – medical emergencies, business decisions • As we shift decisions to algorithms, we lose both transparency AND accountability • “The buck stops where?” 8/7/2017 Data, Responsibly / SciTech NW 77
- 78. Fairness Accountability Transparency Privacy Reproducibility Fides: A platform for responsible data science joint with Stoyanovich [US], Abiteboul [FR], Miklau [US], Sahuguet [US], Weikum [DE] Data Curation novel features to support: So what do we do about it?
Editor's Notes
- #3: And processing power, either as raw processor speed or via novel multi-core and many-core architectures, is also continuing to increase exponentially…
- #4: … but human cognitive capacity is remaining constant. How can computing technologies help scientists make sense out of these vast and complex data sets?
- #10: This is the complexity of three matrix multiply algorithms plotted against the sparsi – a naïve sparse
- #14: BLAS: fail to assign memory!! spBLAS: # of outputs > 2B with r1.6 data. overflow issues based on 32 bit integers long ints may work hyperDB: thrashing with r1.6.
- #15: speedup = T_HyperDB / T_SpBLAS benchmark datasets with r is 1.2 and the real data cases (the three largest datasets: 1.17 < r < 1.20) on star (nTh = 12), on dragon (nTh = 60) As n increases, the relative speedup of SpBLAS over HyperDB is reduced. soc-Pokec: the relative speedup is only around 5 times. on star, hyperDB stuck on thrashing with soc-Pokec data.
- #27: Bridging the gap: towards optimization across linear and relational
- #28: Array of Things sensor data from Argonne National Labs. First started as a project with the city of Chicago. Suppose we have two such sensors and we wish to study the differences in their measurements. We would like to know what the mean differences are and how the measurement types covary. For example, when the first sensor records a higher temperature than the second, does that correlate with a larger humidity measurement as well? Calibration, compare newly manufactured sensor to the golden standard
- #29: We know how to optimize SQL – AGG ---- YOU KNOW THIS Problems: Matrix needs indexing set; LA doesn’t typically have methods to transform indices like this. LA operators works well when transforming the values. Matrix is infinite in general Assoc(bin(Row(A)), Row(A), 1) *_avg A
- #30: This approach stores each column of the matrix X as a separate attribute. Another approach is (I, j, v). We could use Lara to write the equations for this. To prove that the MATLAB implements the LA, use: 1/n * (X – 1M)T(X – 1M) = 1/n * XTX – MTM Use n/(n-1) for bias correction. U = X - repmat(M, N, 1); C = U.' * U ./ (N - 1); Bessel’s Correction for sample variance: N/(N – 1)
- #32: So our approach is to model this overlap in capabilities as its own language. We start
- #33: Roadmap
- #34: Roadmap
- #35: These operators are not totally novel; they are inspired by the following work. Two syntaxes: COBOL/SQL-style for writing scripts, algebraic/combinatory-style for proofs. INSPIRED BY INTERESTING GENERALIZATION OF UNION. Flatmap is monotonic in key type.
- #36: Multiply matching values by UDF ⊗s, one for each value attribute Each ⊗ has default value as annihilator: vA ⊗ 0' = 0 ⊗ vB = 0 ⊗ 0' Keys: = 𝐾 𝐴 ∪ 𝐾 𝐵 Values: = 𝑉 𝐴 ∩ 𝑉 𝐵 Support: ⊆ 𝑆 𝐴 ∩ 𝑆 𝐵 (on common keys), with equality when ⊗ has zero product property
- #37: Sum colliding values by UDF ⨁s, one for each value attribute Default values must match Each ⨁ has default value as identity: v ⨁ 0 = 0 ⨁ v = v Agg: special case when one table is empty example: aggregates down to key i Keys: = 𝐾𝐴 ∩ 𝐾𝐵 Values: = 𝑉𝐴 ∪ 𝑉𝐵 Support: ⊆ 𝑆𝐴 ∪ 𝑆𝐵 (on common keys), with equality when ⨁ is zero-sum-free
- #38: Run f on each row independently, replaces values Appends new keys (never deletes) Monotonic in key type; no collisions No free variables Use Join/Union to interface with external tables Requirement for finite support: Map: special case when k' = () Rename: map that changes attribute names RA: CROSS APPLY LA: EXPLODE
- #40: tr(XY) = sum(X ⊗ YT)
- #42: NOTES: Optimizations enable? with better semantics on a hash table join with UDFs, can do redundant computation elimination, code motion from UDF
- #50: We want to not just build the system, we want to understand how people are using it
- #51: Why do we care about lifetime? Table usage predictions for caching and partitioning. Move from reactive to proactive physical design services. Query idioms are consistent, while the data is fleeting. Not exact queries as in a streaming system, but the “methods” are reused over and over. Extracting and optimizing these idioms across tenants is our goal.
- #59: Google knowledge graph Specialized Ontologies
- #60: Google knowledge graph Specialized Ontologies
- #61: Google knowledge graph Specialized Ontologies
- #62: "HeLa", "K562", "MCF-7" and "brain tumor” PCA on expression values
- #63: Google knowledge graph – common knowledge, high redundancy, possibly crowdsourcing (visual: question answering via Google) Text features: presence of ontology terms sibling of ontology term Expression features
- #71: LSI-R model 25 states use it Most for targeted programs Idaho and Colorado use this for sentencing “As a Black male,” Cobb asked Penn statistician and resident expert Richard Berk, “should I be afraid of risk assessment tools?” “No,” Berk said, without skipping a beat. “You gotta tell me a lot more about yourself. … At what age were you first arrested? What is the date of your most recent crime? What are you charged with?” Cobb interjected: “And what’s the culture of policing in the neighborhood in which I grew up in?” (emphasis mine) That's exactly the point (and to Michael -- this is what I was arguing about with the guy from Comcast): a little bit of institutional racism has a triple effect: a) institutional racism is amplified by the algorithm (a small signal can now dominate the model) b) institutional racism is operationalized by the algorithm (it's far easier now to make impactful decisions based on bad data) c) institutional racism is legitimized by the algorithm (so that everyone thinks "it's just data" and actively defends the algorithm's assumed objectivity, even when the racist results are staring you right in the face. This vigorous defense doesn't happen when a human is shown to be correlating their decisions perfectly with race.)
- #75: On which projects should we engage? How can we ensure fairness, accountability, and transparency for algorithmic decision-making? How do we ensure privacy? How do we avoid junk science?