New Relic Infrastructure Intro: Increasing Mean Time Between Loss of Sleep [F...New Relic
New Relic Infrastructure Intro:
Increasing Mean Time Between Loss of Sleep
Speaker: Jim Stoneham, GM & SVP, SMB Business, New Relic & Mikhail Panchechenko, Director, Engineering, New Relic
Featuring: Al Kemner, Principle Engineer – Platform as a Service, Gannett
"Containers, DevOps, Microservices and Kafka: Tools used by our Monolith wrec...New Relic
"Containers, DevOps, Microservices and Kafka: Tools used by our Monolith wrecking crew."
Speakers: Jonathan Owens, Senior Site Reliability Engineer and Jose Fernandez, Lead Software Engineer, New Relic
How New Relic Develops Language Agents [FutureStack16]New Relic
This document discusses how New Relic builds language agents for new programming languages and frameworks. It outlines 10 lessons learned from building agents for future stacks: 1) Pay attention to what developers are talking about. 2) Use constraints to inspire innovation. 3) Encourage experimentation, including failures. 4) Rapidly mature by reducing cycle time. 5) It's okay to ask for help. 6) Accept that some bets will be lost. 7) Time with customers is worth 10x coding time. 8) Use data to know where to focus development efforts. 9) Curate every new stack experience. 10) Always have new technologies simmering that could be the next big thing.
Make Browsers Cry: How to Make a Modern Web App Painfully Slow [FutureStack16]New Relic
The document discusses various ways to intentionally make a web application painfully slow, including choices that can confuse the browser, unoptimize the network, and make bad infrastructure decisions. It demonstrates how each of these areas (browser, network, infrastructure) can be manipulated individually and together to drastically increase page load times. The goal is to show that web performance is impacted by many interconnected factors and there is no "magic sauce" - front-end developers must consider the entire client/server model from browser to backend systems.
Track Welcome: New Relic 101 [FutureStack16]New Relic
This document provides an introduction to New Relic 101. It discusses New Relic's founding vision of making developers' lives easier and enabling web applications to scale. It outlines New Relic's evolution from focusing on Ruby on Rails developers to its current unified digital intelligence platform. The platform maps to New Relic's specific products and focuses on analytics, the cloud, and people. The document encourages focusing on collaboration, eliminating silos, and taking advantage of full stack visibility and analytics. It suggests ways to get the most out of New Relic training and resources.
Are you ready to migrate to the cloud? How will you prove success? This presentation covers how to baseline before and after your cloud migration to prove success.
The document announces FutureStack16, New Relic's user conference with events in London, New York City, and San Francisco. It introduces the president and other speakers at the event. It also provides a brief summary of New Relic's product evolution over 9 years and previews upcoming innovations to provide greater visibility into applications, infrastructure, and non-SQL databases.
This document provides information about New Relic, Inc. and disclaims any commitment or obligation on their part. Any information provided is proprietary and may not be shared without permission. The document also contains forward-looking statements that actual results could differ materially from. Existing and prospective investors, customers, and partners are advised not to rely solely on these statements. Success depends on many factors outside of New Relic's control.
Thinking About the Full Stack to Create Great Mobile Experiences, New Relic [...New Relic
Thinking About the Full Stack to Create Great Mobile Experiences
Speaker: Devin Cheevers, Product Marketing Manager and Susie Dirks, Product Manager, Mobile, New Relic
Monitoring is important not just for production but also for pre-production environments. This allows developers to detect issues early, reduce the number of incidents that occur in production, and standardize response processes. New Relic enables monitoring throughout the development lifecycle by allowing custom metrics and attributes to be collected from development and included in alerts across all environments. Scripting alerts and maintaining them as code helps ensure a consistent monitoring configuration.
New Relic Infrastructure in the Real World: AWSNew Relic
The document discusses New Relic's cloud monitoring capabilities. It provides visibility into full software stacks from hardware to applications. It allows linking of multiple AWS accounts for consolidated monitoring across teams. Settings and automation tools allow for efficient monitoring by customizing dashboards, frequencies, and regions to monitor. The API also allows for automation to reduce monitoring costs.
The document discusses the challenges of implementing DevOps without proper measurement. It argues that digital teams often lack aligned measures of success and that application changes are difficult to assess across dynamic architectures without instrumentation. The document then presents New Relic's software measurement framework for aligning DevOps teams around key performance indicators for business success, customer experience, and application/infrastructure performance. It provides examples of how to measure service quality, customer experience, engineering velocity, and business value.
This document discusses the importance of planning for failures when building highly available, scalable applications. It uses the analogy of "flying two mistakes high" when piloting radio controlled planes to emphasize that systems should be designed to handle at least two failures without crashing. The document provides examples of how extra capacity is needed to maintain availability during failures like node outages, rolling upgrades, and unknown dependencies between infrastructure components. It stresses the need to thoroughly analyze all potential failure modes and ensure recovery plans are robust enough to handle compounding issues.
Velocity - cloudy with a chance of scalingLee Atchison
The document discusses techniques for achieving high availability in cloud applications. It provides an overview of key concepts like maintaining redundancy, handling failures, and ensuring recovery plans are robust. Examples are given to illustrate the importance of anticipating different failure modes and dependencies to "stay two mistakes high." The space shuttle software system is presented as an example of a highly redundant and recoverable system through its use of multiple independent computing units and deadlock handling.
The document discusses how New Relic launched its Metric Explorer initiative in 3 months by adopting an agile approach focused on failing better. It emphasizes incremental development, feature flagging, dark launches, data-driven scoping, and empowering self-reliant teams with shared goals and real-time visibility into product usage and deployments provided by New Relic tools. This allowed for rapid iteration, integration of feedback, and reliability improvements to achieve a successful launch.
The document discusses Site Reliability Engineering (SRE) practices at New Relic. It summarizes that New Relic has transitioned from a monolithic architecture run by siloed teams to over 200 microservices run by many engineering teams with embedded SREs. SREs aim to continuously improve reliability by reducing toil, encouraging best practices, automating operations, and supporting engineering teams. SREs focus on stability, reliability engineering, and reducing operations toil. The document provides a template for other companies to establish SRE roles, focus areas, and details in the SRE book.
What are the challenges to use Docker? Find out what we learned at New Relic software. Presented at Velocity 2016 Santa Clara (at the New Relic booth).
If It Touches Production, It Is ProductionNew Relic
In Site Engineering at New Relic we treat operations like software. Operationalizing development teams to build, maintain and scale a unified polyglot environment. By following the mantra of "automate everything" we treat all tasks, tools and processes the same way we do our products, with a well defined lifecycle. In this session you will learn how to integrate your DevOPs team with your product development teams and discuss best practices we have learned that will successfully take your infrastructure platform into the future.
Cloud Expo (Keynote) - Static vs DynamicLee Atchison
The document discusses how cloud computing provides a "better data center" that allows for faster provisioning of resources and improved application availability through redundancy. It also describes how the cloud can function as a "dynamic tool" that allows applications to dynamically allocate and deallocate resources as needed. Effective monitoring of cloud applications requires solutions like New Relic that can monitor application performance in addition to lower-level infrastructure metrics provided by AWS CloudWatch. Together these solutions provide full-stack visibility of dynamic cloud environments.
How to Lower or Justify your Cloud SpendKevin Downs
Are you responsible for keeping your cloud spend down? Or, are you looking for a way to justify your current spend - maybe even prove you need to expand your cloud budget? This presentation shows you how you can using cloud service metrics and KPIs to optimize your cloud spend.
This document outlines strategies for improving code reviews at New Relic. It discusses establishing ground rules for reviews, different types of feedback (objective vs. subjective comments), and tagging comments as blocking or non-blocking. Guidelines are proposed for giving constructive criticism without being patronizing. The impact of implementing these strategies was more respectful discussions, less resentment between reviewers and authors, and a more efficient review process.
Engineering and Autonomy in the Age of Microservices - Nic Benders, New RelicAmbassador Labs
Nic Benders, New Relic's Chief Architect discusses how New Relic re-organized their engineering teams around microservices in order to achieve greater scale and efficiency
You’re ready to migrate, but how will you prove success?New Relic
The document discusses acceptance testing for migrating applications to the cloud. It recommends instrumenting applications both on-premises and in the cloud to establish performance baselines for each environment. A comparison dashboard can then prove whether the cloud migration was successful by comparing the key performance indicators between the two baselines.
Monitor all your Kubernetes and EKS stack with New Relic New Relic
This document discusses New Relic's capabilities for monitoring Kubernetes and EKS stacks. It begins with safe harbor statements and an overview of how applications have evolved from monoliths to orchestrated containers. Kubernetes allows for faster development, cost efficiency and portability but requires new monitoring approaches. New Relic's solution provides immediate insights into EKS clusters, allows alerting on any Kubernetes metric, and offers a deep stack view from applications to infrastructure through easy installation and extensibility via APIs. A demo then illustrates New Relic's EKS monitoring capabilities.
Kafka Summit SF 2017 - From Scaling Nightmare to Stream Dream : Real-time Str...confluent
This document discusses New Relic's use of Kafka for real-time stream processing at scale. It describes how New Relic processes large volumes of event data using Kafka, including handling over 15 million messages per second across hundreds of topics. It also outlines how New Relic stitched together microservices using Kafka to independently scale processing steps, implemented various partitioning strategies, and used Kafka as a durable cache. The document concludes by looking ahead to future upgrades and emphasizing lessons learned around partitioning to balance load, reducing dependencies and complexity, and modularity to scale independently.
Increasing MTBLS with New Relic [FutureStack16 NYC]New Relic
This document discusses New Relic's Infrastructure product which provides monitoring for dynamic cloud and containerized environments. It allows users to monitor configuration changes, system health metrics, and incidents across their infrastructure. The product provides visibility into inventory, events, and metrics across an organization's resources. It integrates with New Relic's data platform to allow for detailed analysis and is designed for environments with frequent deployments and resource changes.
The document discusses the need to rethink cloud migration strategies. It summarizes a presentation by New Relic on moving applications to the cloud. The presentation introduces the concept of "re:thinking" as the 7th "R" in cloud migration strategies. It argues that to successfully migrate applications, teams need to rethink monitoring, tagging policies, auto-scaling, cost management, legacy system integration, and continuous refactoring and rearchitecting of applications for the cloud.
Kubernetes in the Wild: Best Practices for MonitoringNew Relic
The document discusses the need to rethink cloud migration strategies. It summarizes a presentation by New Relic on moving applications to the cloud. The presentation introduces the concept of "re:thinking" as the 7th "R" in cloud migration strategies. It argues that to successfully migrate applications, teams need to rethink monitoring, tagging policies, auto-scaling, cost management, legacy system integration, and continuous refactoring through a lens of cloud-native practices.
Changing The Laws Of Engineering With Github Pull RequestsNew Relic
This document discusses using GitHub pull requests to change an engineering culture. It advocates embedding processes in culture through pull requests to make processes transparent, inclusive, discoverable, and easily updated. It suggests writing culture as code by documenting processes in Markdown files on GitHub Pages for anyone to contribute to. This empowers autonomy and bias for action while still allowing editorial control. The presentation provides examples of how the company used pull requests to improve title standards, review vestigial processes, and define why changes were made rather than just what changed.
How to Lower or Justify your Cloud Spend New Relic
The document discusses optimizing cloud spending and justifying cloud costs. It introduces New Relic's cloud optimization solutions, including integrating AWS budgets with New Relic billing, using tags to track application environments, dashboards to monitor performance and costs, NRQL to query metrics, data apps to analyze usage, and baseline alerts to detect anomalies. It also discusses right-sizing instances, scaling workloads in/out as needed, and New Relic's cloud adoption solution guide to plan, migrate, and optimize applications on cloud services.
Implementing Docker in Production at ScaleKarl Matthias
New Relic implemented Docker containers in production at a large scale. They started with a minimal viable platform (MVP) that focused on solving deployment challenges simply. This initial approach worked well and allowed them to gain experience while supporting over 250 production containers across 15 teams. After 1.5 years, they learned lessons that informed a new, more robust platform utilizing Mesos, Marathon, and other tools for improved resource management, service discovery, load balancing and monitoring at scale. The simple initial approach provided time to learn and iterate before building a more sophisticated solution.
SaaS Security Programs: Build What You SeekNew Relic
Maybe you are evaluating the security of SaaS offerings or building out the security capabilities of your own service. In this session, Shaun Gordon, New Relic’s CISO will discuss how New Relic’s security program operates and what we look for when evaluating services for use by our business.
Host for the Most: Cloud Cost OptimizationNew Relic
The document discusses the need for workload aware spend optimization when moving workloads to the cloud. It outlines a methodology for defining, refining, and optimizing cloud initiatives by baselining workloads, establishing organization and migration tracking, implementing feedback loops, and achieving business agility. The methodology aims to optimize both cloud spending and end user experience using New Relic's monitoring capabilities.
Storms Ahead - How Your Monitoring Can Keep Pace in the Dynamic Cloud {Future...New Relic
1) The document discusses how Docker and cloud computing allow applications to be more dynamic by bringing resources online and offline as needed. This dynamic environment requires monitoring the lifecycle of cloud components as they are created and destroyed.
2) Monitoring both the cloud infrastructure and applications is important to understand performance and issues. AWS services monitor the infrastructure components while New Relic provides application monitoring across dynamic infrastructure changes.
3) Both operations and development teams are impacted by dynamic cloud architectures where applications scale resources themselves and components like containers can be short-lived, requiring new monitoring approaches.
Everything Blockchain builds platforms of trust for the modern enterprise and is on a mission to ensure every organization has access to the tools and platforms that enable them to manage, store, and protect data without the cost and complexity that holds them back today. The Company’s patented advances in engineering deliver the essential elements needed for real-world business use: speed, security, and efficiency. Everything Blockchain’s current business lines include: EB Advise, Build DB and EB Control.
Everything Blockchain is a key player in building the future where every transaction is trusted and blockchain is used to meet ESG goals, support cities of the future, build and control the transparency of supply chains and ensure the rights of data ownership sustain forever. The Company’s patent-pending advances in blockchain engineering deliver the essential elements needed for real-world business use: speed, security, and energy efficiency.
All the cool kids are doing it, but is it possible to have too much of a good thing? I'll present some thoughts about things you can actually measure to decide if you've gone off the deep end with microservices.
Ground Rules for Code Reviews: Improving development velocity and team commun...New Relic
This document discusses establishing ground rules for code reviews to improve team communication and development velocity. It recommends distinguishing between subjective and objective feedback, tagging comments as blocking or non-blocking, and sponsoring a coding standard to provide consistency while allowing team autonomy. These practices helped make review feedback more constructive and reduced friction between authors and reviewers.
7 Tips & Tricks to Having Happy Customers at ScaleNew Relic
Customer expectations are at an all-time high, making it more and more difficult for companies to please them. Companies who understand their customers well are the ones who rise to the top over their competitors. New Relic, provider of real-time insights for software-driven businesses has this formula figured out. Roger Scott, New Relic's EVP and Chief Customer Officer shares his 7 tips and tricks for keeping your customers happy— and how to do so at a large scale.
FutureStack Tokyo 19 -[New Relic テクニカル講演]モニタリングと可視化がデジタルトランスフォーメーションを救う! - サ...New Relic
New Relicの目指していることの一つが、DevOpsを推進することを手助けし、デジタルトランスフォーメーションを成功させることです。DevOpsにとってなぜモニタリングと可視化が重要なのか、またどのようなデータを管理する必要があるのかを考察した上で、New Relicで実現できる例をデモを交え、技術からビジネスまで幅広い観点でご紹介します。
New Relic 株式会社
ソリューション コンサルタント
佐々木 千枝
FutureStack Tokyo 19_インサイトとデータを組織の力にする_株式会社ドワンゴ 池田 明啓 氏New Relic
サービス、プロダクトを”いつまでも”継続する為には、インサイトとデータを組織の力とする必要があります。
私達が開発、運用するドワンゴジェイピーは、間もなく二十周年を迎えます。決して順風満帆ではなかったシステムの遍歴と New Relic の導入方法を交え、継続できた理由の一つ、インサイトとデータを組織の力へ変換する方法をご紹介します。
Three Monitoring Mistakes and How to Avoid ThemNew Relic
The days of parsing log files and building out homebrewed monitoring tools are (thankfully) coming to an end. Yet as those outdated techniques begin to fade, a whole new set of challenges have arisen around employing and running modern monitoring solutions.
Discover how New Relic can help turn monitoring blunders into intelligent problem solving, including how to avoid making common mistakes like:
- Not monitoring the whole system
- Monitoring arbitrary things in your system
- Making your monitoring part of the problem
Intro to Multidimensional Kubernetes MonitoringNew Relic
As a Kubernetes environment grows and becomes more complex, it gets harder to answer some very basic—but very important—questions. Questions like: What is the health of my cluster? What is the hierarchy and the health of the elements (nodes, pods, containers, and applications) within my cluster? In order to effectively manage the health and performance of your Kubernetes environments—at any scale and any level of complexity—it’s essential you have immediate, useful answers to these questions.
Our Kubernetes cluster explorer was designed to give you a multi-dimensional representation of your clusters—giving you the ability to drill down into Kubernetes data and metadata in a high-fidelity, curated UI.
This document discusses New Relic, Inc., a company that provides application performance monitoring and management products. It notes that the document contains forward-looking statements and actual results may differ. It also states that New Relic assumes no obligation to update any forward-looking statements except as required by law.
This document discusses site reliability engineering (SRE) practices at New Relic. It describes New Relic's transition from a monolithic architecture to microservices, and the establishment of an SRE team with both embedded and dedicated roles. The SRE team aims to continuously improve the reliability of New Relic's platform. Key aspects of SRE success outlined include reliability as a feature, shared understanding, clear guidelines, and community building.
10 Things You Can Do With New Relic - Number 9 Will Shock YouNew Relic
This document discusses 10 things that can be done with New Relic, a performance monitoring and analytics tool. It begins by noting that many people may not be correctly measuring performance and outlines how to measure perceived performance through key elements like load times and interactions. It then discusses learning more about New Relic usage through daily usage events and audit events that track account changes. The document concludes by stating that following best practices with New Relic's toolkits can provide proven ways to solve business challenges through tutorials, artifacts, and help options.
Understanding Microservice Latency for DevOps Teams: An Introduction to New R...New Relic
Distributed tracing is designed to give DevOps teams an easy way to capture, visualize, and analyze traces through complex architectures—including architectures that use both monoliths and microservices. And, by leveraging New Relic Applied Intelligence capabilities, you can easily highlight anomalies within a trace for more faster resolution.
Best Practices for Measuring your Code PipelineNew Relic
The document discusses best practices for measuring a code pipeline, which automates the continuous integration and delivery process. It recommends sending events from source code management systems to capture metadata on commits and pushes. Pipeline state changes and test results should also be recorded to analyze patterns and correlate metrics. Builds should be tagged to relate runtime performance to code revisions. Measuring the pipeline allows teams to move faster, identify failures, and ensure deployments don't degrade quality.
Top Three Mistakes People Make with MonitoringNew Relic
The document discusses three common mistakes companies make with application monitoring: 1) Not monitoring the entire system leading to blind spots, 2) Monitoring arbitrary metrics that don't provide useful information, and 3) Viewing monitoring as someone else's problem rather than prioritizing it themselves. The author is from New Relic and seeks to educate on best practices for effective monitoring.
Our Evolution to GraphQL: Unifying our API StrategyNew Relic
New Relic adopted GraphQL to address issues from rapid growth including an unwieldy code base, difficulty managing changes, and engineering stress. GraphQL provided a common API language and extensible layer to divide code into microservices and containers while simplifying authorization and allowing client-driven querying and updating across multiple services.
Kick Ass Data Exploration through DashboardsNew Relic
This document discusses how to create effective dashboards using New Relic data. It introduces Mark Weitzel who will demonstrate some dashboards. The document promises to show examples of dashboards that provide insights into performance data collected by New Relic.
The document discusses how modern applications require modern monitoring, infrastructure, and processes to keep them running effectively. It emphasizes that managing risk, instrumenting all aspects of an application, using dynamic cloud infrastructure, and embracing a DevOps culture are necessary to maintain high-performing modern applications. Removing risk entirely is impossible, so risk management through understanding and mitigation is key.
Ann Naser Nabil- Data Scientist Portfolio.pdfআন্ নাসের নাবিল
I am a data scientist with a strong foundation in economics and a deep passion for AI-driven problem-solving. My academic journey includes a B.Sc. in Economics from Jahangirnagar University and a year of Physics study at Shahjalal University of Science and Technology, providing me with a solid interdisciplinary background and a sharp analytical mindset.
I have practical experience in developing and deploying machine learning and deep learning models across a range of real-world applications. Key projects include:
AI-Powered Disease Prediction & Drug Recommendation System – Deployed on Render, delivering real-time health insights through predictive analytics.
Mood-Based Movie Recommendation Engine – Uses genre preferences, sentiment, and user behavior to generate personalized film suggestions.
Medical Image Segmentation with GANs (Ongoing) – Developing generative adversarial models for cancer and tumor detection in radiology.
In addition, I have developed three Python packages focused on:
Data Visualization
Preprocessing Pipelines
Automated Benchmarking of Machine Learning Models
My technical toolkit includes Python, NumPy, Pandas, Scikit-learn, TensorFlow, Keras, Matplotlib, and Seaborn. I am also proficient in feature engineering, model optimization, and storytelling with data.
Beyond data science, my background as a freelance writer for Earki and Prothom Alo has refined my ability to communicate complex technical ideas to diverse audiences.
The fifth talk at Process Mining Camp was given by Olga Gazina and Daniel Cathala from Euroclear. As a data analyst at the internal audit department Olga helped Daniel, IT Manager, to make his life at the end of the year a bit easier by using process mining to identify key risks.
She applied process mining to the process from development to release at the Component and Data Management IT division. It looks like a simple process at first, but Daniel explains that it becomes increasingly complex when considering that multiple configurations and versions are developed, tested and released. It becomes even more complex as the projects affecting these releases are running in parallel. And on top of that, each project often impacts multiple versions and releases.
After Olga obtained the data for this process, she quickly realized that she had many candidates for the caseID, timestamp and activity. She had to find a perspective of the process that was on the right level, so that it could be recognized by the process owners. In her talk she takes us through her journey step by step and shows the challenges she encountered in each iteration. In the end, she was able to find the visualization that was hidden in the minds of the business experts.
快速办理新西兰成绩单奥克兰理工大学毕业证【q微1954292140】办理奥克兰理工大学毕业证(AUT毕业证书)diploma学位认证【q微1954292140】新西兰文凭购买,新西兰文凭定制,新西兰文凭补办。专业在线定制新西兰大学文凭,定做新西兰本科文凭,【q微1954292140】复制新西兰Auckland University of Technology completion letter。在线快速补办新西兰本科毕业证、硕士文凭证书,购买新西兰学位证、奥克兰理工大学Offer,新西兰大学文凭在线购买。
主营项目:
1、真实教育部国外学历学位认证《新西兰毕业文凭证书快速办理奥克兰理工大学毕业证的方法是什么?》【q微1954292140】《论文没过奥克兰理工大学正式成绩单》,教育部存档,教育部留服网站100%可查.
2、办理AUT毕业证,改成绩单《AUT毕业证明办理奥克兰理工大学展示成绩单模板》【Q/WeChat:1954292140】Buy Auckland University of Technology Certificates《正式成绩单论文没过》,奥克兰理工大学Offer、在读证明、学生卡、信封、证明信等全套材料,从防伪到印刷,从水印到钢印烫金,高精仿度跟学校原版100%相同.
3、真实使馆认证(即留学人员回国证明),使馆存档可通过大使馆查询确认.
4、留信网认证,国家专业人才认证中心颁发入库证书,留信网存档可查.
《奥克兰理工大学毕业证定制新西兰毕业证书办理AUT在线制作本科文凭》【q微1954292140】学位证1:1完美还原海外各大学毕业材料上的工艺:水印,阴影底纹,钢印LOGO烫金烫银,LOGO烫金烫银复合重叠。文字图案浮雕、激光镭射、紫外荧光、温感、复印防伪等防伪工艺。
高仿真还原新西兰文凭证书和外壳,定制新西兰奥克兰理工大学成绩单和信封。专业定制国外毕业证书AUT毕业证【q微1954292140】办理新西兰奥克兰理工大学毕业证(AUT毕业证书)【q微1954292140】学历认证复核奥克兰理工大学offer/学位证成绩单定制、留信官方学历认证(永久存档真实可查)采用学校原版纸张、特殊工艺完全按照原版一比一制作。帮你解决奥克兰理工大学学历学位认证难题。
新西兰文凭奥克兰理工大学成绩单,AUT毕业证【q微1954292140】办理新西兰奥克兰理工大学毕业证(AUT毕业证书)【q微1954292140】学位认证要多久奥克兰理工大学offer/学位证在线制作硕士成绩单、留信官方学历认证(永久存档真实可查)采用学校原版纸张、特殊工艺完全按照原版一比一制作。帮你解决奥克兰理工大学学历学位认证难题。
奥克兰理工大学offer/学位证、留信官方学历认证(永久存档真实可查)采用学校原版纸张、特殊工艺完全按照原版一比一制作【q微1954292140】Buy Auckland University of Technology Diploma购买美国毕业证,购买英国毕业证,购买澳洲毕业证,购买加拿大毕业证,以及德国毕业证,购买法国毕业证(q微1954292140)购买荷兰毕业证、购买瑞士毕业证、购买日本毕业证、购买韩国毕业证、购买新西兰毕业证、购买新加坡毕业证、购买西班牙毕业证、购买马来西亚毕业证等。包括了本科毕业证,硕士毕业证。
特殊原因导致无法毕业,也可以联系我们帮您办理相关材料:
1:在奥克兰理工大学挂科了,不想读了,成绩不理想怎么办???
2:打算回国了,找工作的时候,需要提供认证《AUT成绩单购买办理奥克兰理工大学毕业证书范本》【Q/WeChat:1954292140】Buy Auckland University of Technology Diploma《正式成绩单论文没过》有文凭却得不到认证。又该怎么办???新西兰毕业证购买,新西兰文凭购买,
【q微1954292140】帮您解决在新西兰奥克兰理工大学未毕业难题(Auckland University of Technology)文凭购买、毕业证购买、大学文凭购买、大学毕业证购买、买文凭、日韩文凭、英国大学文凭、美国大学文凭、澳洲大学文凭、加拿大大学文凭(q微1954292140)新加坡大学文凭、新西兰大学文凭、爱尔兰文凭、西班牙文凭、德国文凭、教育部认证,买毕业证,毕业证购买,买大学文凭,购买日韩毕业证、英国大学毕业证、美国大学毕业证、澳洲大学毕业证、加拿大大学毕业证(q微1954292140)新加坡大学毕业证、新西兰大学毕业证、爱尔兰毕业证、西班牙毕业证、德国毕业证,回国证明,留信网认证,留信认证办理,学历认证。从而完成就业。奥克兰理工大学毕业证办理,奥克兰理工大学文凭办理,奥克兰理工大学成绩单办理和真实留信认证、留服认证、奥克兰理工大学学历认证。学院文凭定制,奥克兰理工大学原版文凭补办,扫描件文凭定做,100%文凭复刻。
Johan Lammers from Statistics Netherlands has been a business analyst and statistical researcher for almost 30 years. In their business, processes have two faces: You can produce statistics about processes and processes are needed to produce statistics. As a government-funded office, the efficiency and the effectiveness of their processes is important to spend that public money well.
Johan takes us on a journey of how official statistics are made. One way to study dynamics in statistics is to take snapshots of data over time. A special way is the panel survey, where a group of cases is followed over time. He shows how process mining could test certain hypotheses much faster compared to statistical tools like SPSS.
保密服务圣地亚哥州立大学英文毕业证书影本美国成绩单圣地亚哥州立大学文凭【q微1954292140】办理圣地亚哥州立大学学位证(SDSU毕业证书)毕业证书购买【q微1954292140】帮您解决在美国圣地亚哥州立大学未毕业难题(San Diego State University)文凭购买、毕业证购买、大学文凭购买、大学毕业证购买、买文凭、日韩文凭、英国大学文凭、美国大学文凭、澳洲大学文凭、加拿大大学文凭(q微1954292140)新加坡大学文凭、新西兰大学文凭、爱尔兰文凭、西班牙文凭、德国文凭、教育部认证,买毕业证,毕业证购买,买大学文凭,购买日韩毕业证、英国大学毕业证、美国大学毕业证、澳洲大学毕业证、加拿大大学毕业证(q微1954292140)新加坡大学毕业证、新西兰大学毕业证、爱尔兰毕业证、西班牙毕业证、德国毕业证,回国证明,留信网认证,留信认证办理,学历认证。从而完成就业。圣地亚哥州立大学毕业证办理,圣地亚哥州立大学文凭办理,圣地亚哥州立大学成绩单办理和真实留信认证、留服认证、圣地亚哥州立大学学历认证。学院文凭定制,圣地亚哥州立大学原版文凭补办,扫描件文凭定做,100%文凭复刻。
特殊原因导致无法毕业,也可以联系我们帮您办理相关材料:
1:在圣地亚哥州立大学挂科了,不想读了,成绩不理想怎么办???
2:打算回国了,找工作的时候,需要提供认证《SDSU成绩单购买办理圣地亚哥州立大学毕业证书范本》【Q/WeChat:1954292140】Buy San Diego State University Diploma《正式成绩单论文没过》有文凭却得不到认证。又该怎么办???美国毕业证购买,美国文凭购买,【q微1954292140】美国文凭购买,美国文凭定制,美国文凭补办。专业在线定制美国大学文凭,定做美国本科文凭,【q微1954292140】复制美国San Diego State University completion letter。在线快速补办美国本科毕业证、硕士文凭证书,购买美国学位证、圣地亚哥州立大学Offer,美国大学文凭在线购买。
美国文凭圣地亚哥州立大学成绩单,SDSU毕业证【q微1954292140】办理美国圣地亚哥州立大学毕业证(SDSU毕业证书)【q微1954292140】录取通知书offer在线制作圣地亚哥州立大学offer/学位证毕业证书样本、留信官方学历认证(永久存档真实可查)采用学校原版纸张、特殊工艺完全按照原版一比一制作。帮你解决圣地亚哥州立大学学历学位认证难题。
主营项目:
1、真实教育部国外学历学位认证《美国毕业文凭证书快速办理圣地亚哥州立大学办留服认证》【q微1954292140】《论文没过圣地亚哥州立大学正式成绩单》,教育部存档,教育部留服网站100%可查.
2、办理SDSU毕业证,改成绩单《SDSU毕业证明办理圣地亚哥州立大学成绩单购买》【Q/WeChat:1954292140】Buy San Diego State University Certificates《正式成绩单论文没过》,圣地亚哥州立大学Offer、在读证明、学生卡、信封、证明信等全套材料,从防伪到印刷,从水印到钢印烫金,高精仿度跟学校原版100%相同.
3、真实使馆认证(即留学人员回国证明),使馆存档可通过大使馆查询确认.
4、留信网认证,国家专业人才认证中心颁发入库证书,留信网存档可查.
《圣地亚哥州立大学学位证书的英文美国毕业证书办理SDSU办理学历认证书》【q微1954292140】学位证1:1完美还原海外各大学毕业材料上的工艺:水印,阴影底纹,钢印LOGO烫金烫银,LOGO烫金烫银复合重叠。文字图案浮雕、激光镭射、紫外荧光、温感、复印防伪等防伪工艺。
高仿真还原美国文凭证书和外壳,定制美国圣地亚哥州立大学成绩单和信封。毕业证网上可查学历信息SDSU毕业证【q微1954292140】办理美国圣地亚哥州立大学毕业证(SDSU毕业证书)【q微1954292140】学历认证生成授权声明圣地亚哥州立大学offer/学位证文凭购买、留信官方学历认证(永久存档真实可查)采用学校原版纸张、特殊工艺完全按照原版一比一制作。帮你解决圣地亚哥州立大学学历学位认证难题。
圣地亚哥州立大学offer/学位证、留信官方学历认证(永久存档真实可查)采用学校原版纸张、特殊工艺完全按照原版一比一制作【q微1954292140】Buy San Diego State University Diploma购买美国毕业证,购买英国毕业证,购买澳洲毕业证,购买加拿大毕业证,以及德国毕业证,购买法国毕业证(q微1954292140)购买荷兰毕业证、购买瑞士毕业证、购买日本毕业证、购买韩国毕业证、购买新西兰毕业证、购买新加坡毕业证、购买西班牙毕业证、购买马来西亚毕业证等。包括了本科毕业证,硕士毕业证。
How to regulate and control your it-outsourcing provider with process miningProcess mining Evangelist
Oliver Wildenstein is an IT process manager at MLP. As in many other IT departments, he works together with external companies who perform supporting IT processes for his organization. With process mining he found a way to monitor these outsourcing providers.
Rather than having to believe the self-reports from the provider, process mining gives him a controlling mechanism for the outsourced process. Because such analyses are usually not foreseen in the initial outsourcing contract, companies often have to pay extra to get access to the data for their own process.
AI ------------------------------ W1L2.pptxAyeshaJalil6
This lecture provides a foundational understanding of Artificial Intelligence (AI), exploring its history, core concepts, and real-world applications. Students will learn about intelligent agents, machine learning, neural networks, natural language processing, and robotics. The lecture also covers ethical concerns and the future impact of AI on various industries. Designed for beginners, it uses simple language, engaging examples, and interactive discussions to make AI concepts accessible and exciting.
By the end of this lecture, students will have a clear understanding of what AI is, how it works, and where it's headed.
Giancarlo Lepore works at Zimmer Biomet, Switzerland. Zimmer Biomet produces orthopedic products (for example, hip replacements) and one of the challenges is that each of the products has many variations that require customizations in the production process.
Giancarlo is a business analyst in Zimmer Biomet’s operational intelligence team. He has introduced process mining to analyze the material flow in their production process.
He explains why it is difficult to analyze the production process with traditional lean six sigma tools, such as spaghetti diagrams and value stream mapping. He compares process mining to these traditional process analysis methods and also shows how they were able to resolve data quality problems in their master data management in the ERP system.
Multi-tenant Data Pipeline OrchestrationRomi Kuntsman
Multi-Tenant Data Pipeline Orchestration — Romi Kuntsman @ DataTLV 2025
In this talk, I unpack what it really means to orchestrate multi-tenant data pipelines at scale — not in theory, but in practice. Whether you're dealing with scientific research, AI/ML workflows, or SaaS infrastructure, you’ve likely encountered the same pitfalls: duplicated logic, growing complexity, and poor observability. This session connects those experiences to principled solutions.
Using a playful but insightful "Chips Factory" case study, I show how common data processing needs spiral into orchestration challenges, and how thoughtful design patterns can make the difference. Topics include:
Modeling data growth and pipeline scalability
Designing parameterized pipelines vs. duplicating logic
Understanding temporal and categorical partitioning
Building flexible storage hierarchies to reflect logical structure
Triggering, monitoring, automating, and backfilling on a per-slice level
Real-world tips from pipelines running in research, industry, and production environments
This framework-agnostic talk draws from my 15+ years in the field, including work with Airflow, Dagster, Prefect, and more, supporting research and production teams at GSK, Amazon, and beyond. The key takeaway? Engineering excellence isn’t about the tool you use — it’s about how well you structure and observe your system at every level.
2. This document and the information herein (including any information that may be incorporated by reference) is provided for
informational purposes only and should not be construed as an offer, commitment, promise or obligation on behalf of New Relic,
Inc. (“New Relic”) to sell securities or deliver any product, material, code, functionality, or other feature. Any information provided
hereby is proprietary to New Relic and may not be replicated or disclosed without New Relic’s express written permission.
Such information may contain forward-looking statements within the meaning of federal securities laws. Any statement that is not
a historical fact or refers to expectations, projections, future plans, objectives, estimates, goals, or other characterizations of future
events is a forward-looking statement. These forward-looking statements can often be identified as such because the context of
the statement will include words such as “believes,” “anticipates,”, “expects” or words of similar import.
Actual results may differ materially from those expressed in these forward-looking statements, which speak only as of the date
hereof, and are subject to change at any time without notice. Existing and prospective investors, customers and other third parties
transacting business with New Relic are cautioned not to place undue reliance on this forward-looking information. The
achievement or success of the matters covered by such forward-looking statements are based on New Relic’s current
assumptions, expectations, and beliefs and are subject to substantial risks, uncertainties, assumptions, and changes in
circumstances that may cause the actual results, performance, or achievements to differ materially from those expressed or
implied in any forward-looking statement. Further information on factors that could affect such forward-looking statements is
included in the filings New Relic makes with the SEC from time to time. Copies of these documents may be obtained by visiting
New Relic’s Investor Relations website at ir.newrelic.com or the SEC’s website at www.sec.gov.
New Relic assumes no obligation and does not intend to update these forward-looking statements, except as required by law.
New Relic makes no warranties, expressed or implied, in this document or otherwise, with respect to the information provided.
8. • HW issues
• OS upgrades
• Disk space
• CPU usage
• HW issues
• OS upgrades
• Disk space
• CPU usage
• Network issues
• Noisy neighbors
• OS upgrades
• Disk space
• CPU usage
• Network issues
• SOA complexity
• HW issues
• Noisy neighbors
• OS upgrades
• Disk space
• CPU usage
• Network issues
• SOA complexity
• Container issues
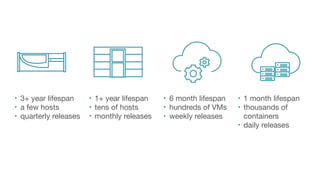
9. • 3+ year lifespan
• a few hosts
• quarterly releases
• 1+ year lifespan
• tens of hosts
• monthly releases
• 6 month lifespan
• hundreds of VMs
• weekly releases
• 1 month lifespan
• thousands of
containers
• daily releases
11. “oh sh*t, scale, complexity, and
volatility are eating us alive!”
“Our architecture needs to be built
for scale and volatility, while
reducing complexity.”
Dynamic
Infrastructure
dynamic
infrastructure