Three tricks how to understand what's happening inside of .NET Core app running on Linux: perf, lttng and lldb. As unrelated bonus, last slides have a brief intro into Google Cloud Platform
Yevhen Tatarynov "My .NET Application Allocates too Much Memory. What Can I Do?"LogeekNightUkraine
The document discusses optimizing a .NET application that was allocating too much memory. The author used various profiling tools to measure the application's memory usage and identify issues. Through 15 iterations of code changes and memory snapshots, they were able to reduce the peak memory load by 30%, total memory usage by 97%, and execution time by 57%. The optimizations included avoiding boxing, reusing objects, using StringBuilder instead of strings, and not allocating memory for unused data.
Yevhen Tatarynov "From POC to High-Performance .NET applications"LogeekNightUkraine
The document discusses optimizing the performance of .NET applications that process large amounts of data. It begins with describing the challenge of applications that take a long time to process files over 1GB in size. It then discusses measuring the application performance, identifying potential issues through profiling tools, and making improvements to reduce execution time and memory usage. Specific optimizations discussed include avoiding redundant Linq operations, optimizing bit manipulation methods to use integer operations instead of floating point, and sorting file names using a more efficient algorithm. Through these changes, execution time was reduced by over 88% and memory usage was reduced by nearly 69%.
Global Interpreter Lock: Episode III - cat < /dev/zero > GIL;Tzung-Bi Shih
This document summarizes a presentation given at PyCon TW 2017 about removing the Global Interpreter Lock (GIL) in Python to allow multi-threaded Python programs to take advantage of multi-processor systems. It begins with examples showing how the GIL currently prevents parallel execution across threads. It then explores approaches like using the dynamic linker and dlmopen() function to load separate copies of the Python shared library for each thread, thereby removing the shared GIL. While an ideal solution, challenges remain in fully implementing this approach.
Make Your Own Developement Board @ 2014.4.21 JuluOSDevJian-Hong Pan
This document discusses building a development board for an ATMega8 microcontroller that functions as a simple oscilloscope. It outlines meeting specifications, minimizing costs, and completing the project in the shortest time as the core engineering values. It provides the specifications for the oscilloscope, discusses using AVR microcontroller features to implement it, and lists the tools needed including an AVR compiler and programmer. Circuits for a function generator and integrating the oscilloscope with a Python console are presented. The document emphasizes applying knowledge from school to implementation and building your own tools.
Oleksandr Kutsan "Using katai struct to describe the process of working with ...LogeekNightUkraine
Kaitai Struct is an open-source tool that allows parsing binary file formats through a declarative file format. It supports generating parsing code for multiple languages from a single declarative file, avoiding the need to implement parsers separately for each language. The file format describes elements like sequences and enums, and can define custom types. Predefined formats are available, and the tool includes utilities for debugging and visualization. While beneficial for its cross-language support and tools, it has some drawbacks like being implemented in Scala and having version stability issues.
The Simple Scheduler in Embedded System @ OSDC.TW 2014Jian-Hong Pan
The document describes a simple scheduler module implemented in C for embedded systems. It breaks processes into small jobs represented by functions that are scheduled in a first-in, first-out queue without preemption. This allows embedding an operating system concept into simple systems using only functions and a ready queue. Interrupts can add jobs to the queue. The scheduler and example oscilloscope application demonstrate scheduling without process state using only callbacks.
PyCon Poland 2016: Maintaining a high load Python project: typical mistakesViach Kakovskyi
The talk is about typical mistakes which a Python developer without much experience in high load systems can make. Possible issues and preventive actions will be discussed. Expected audience: developers who are new to an existing highly loaded service or folks who develop a system from scratch. All the stuff based on own production experience.
This document summarizes the testing approach and strategies used for an application built with Django and Django Rest Framework. It discusses the use of both unit and integration tests, along with different testing frameworks like Django's built-in test tools, pytest, and libraries like pytest-django and pytest-xdist. It also covers strategies like database fixtures, parameterized testing, and mocking HTTP requests. The document concludes by discussing plans to improve testing in the future such as enabling parallel test runs and adding performance regression testing.
Shenandoah GC: Java Without The Garbage Collection Hiccups (Christine Flood)Red Hat Developers
Just like a spoon full of sugar will cure your hiccups, running your JVM with -XX:+UseShenandoahGC will cure your Java garbage collection hiccups. Shenandoah GC is a new garbage collector algorithm developed for OpenJDK at Red Hat, which will produce much better pause times than the currently-available algorithms without a significant decrease in throughput. In this session, we'll explain how Shenandoah works and compare it to the currently-available OpenJDK garbage collectors.
The document provides an overview of installing and using the Network Simulator 2 (NS2). It discusses downloading and extracting NS2, setting up the Linux environment, understanding the basic NS2 architecture and directory structure. It also covers the differences between OTCL and C++ in NS2, and provides examples of creating a simple agent module in C++ and interfacing it with OTCL. The document includes a case study of building a multimedia application over UDP using NS2 that implements five different encoding and transmission rates.
The document discusses Go's concurrency features including goroutines, channels, and synchronization tools. It explains that goroutines are lightweight threads managed by Go, and channels provide a means of communication between goroutines. The document also covers potential concurrency issues like deadlocks and provides best practices to avoid anti-patterns when using goroutines and channels.
Austin Python Meetup 2017: What's New in Pythons 3.5 and 3.6?Viach Kakovskyi
In the talk, the changes introduced in Python 3.5 and Python 3.6 are covered. Primary based on standard documentation, but only my favourite ones are included:
* https://docs.python.org/3/whatsnew/3.3.html
* https://docs.python.org/3/whatsnew/3.6.html
PyCon TW 2017 - PyPy's approach to construct domain-specific language runtime...Tsundere Chen
PyCon TW 2017 - PyPy's approach to construct domain-specific language runtime -Part 2
This is the slide for PyCon TW 2017 Day 3 PyPy's approach to construct domain-specific language runtime's Slide, and this is part 2, Part 1 is jserv's work, refer to his slide
PyCon Ukraine 2016: Maintaining a high load Python project for newcomersViach Kakovskyi
The talk is about typical mistakes which a Python developer with no experience in high load systems can make.
Possible issues and preventive actions will be discussed.
Expected audience: developers who are new to an existing high load service or folks who develop a system from scratch.
All the stuff based on own production experience.
The document discusses Ruochun Tzeng's midterm presentation on OpenMP. It covers OpenMP's shared memory model and fork-join execution model. It provides examples of using OpenMP for data and task parallelism. It also discusses using OpenMP for irregular problems and the task construct. Finally, it summarizes Ruochun's attempts to parallelize four algorithms using OpenMP and the performance results.
Ceph Day SF 2015 - Big Data Applications and Tuning in Ceph Ceph Community
This document summarizes a presentation about running Big Data applications like Hadoop on the Ceph distributed storage platform. The presenter introduces themselves and their background with Ceph and Big Data. They discuss how Hadoop and Ceph can be combined to provide a consolidated storage platform for multiple applications. Benefits include cost savings from consolidation and the ability to run a wide variety of Big Data frameworks on Ceph. The presenter covers how Hadoop integrates with Ceph via a translation layer, shows performance results, and discusses ongoing work to improve stability and features. They also discuss using tracing tools like LTTng to debug Ceph and provide examples of trace output. Finally, the presenter discusses the ability to write plugins for C
This talk presents a number of conceptual and technical challenges that we discovered while building JRebel. At first, the JVM wasn't designed for live updates, so we will talk about the engine that mitigates the problem. Secondly, the diversity of Java ecosystem, created by the variety of application servers, the frameworks and tools, makes it challenging in creating a generic solution that would fit the majority of developers. We will see, how Java platform itself allows us to develop a solution by applying bytecode instrumentation mechanism.
JRebel does live code reloading to ensure that the developer can keep instantly alternating between the developing environment and the web browser, to save wasted time and increase the productivity flow.
The document discusses concepts related to event loops and concurrency in programming. It includes code snippets in Java showing the use of NIO selectors and channels for non-blocking I/O. Diagrams are shown illustrating reactor patterns and Vert.x modules deployed across multiple CPUs. The summary provides an overview of the main topics and techniques discussed in the technical document.
Kernel-Level Programming: Entering Ring NaughtDavid Evans
University of Virginia
cs4414: Operating Systems
http://rust-class.org
Leslie Lamport wins the Turing Award!
Hardware-Based Memory Isolation
Software-Based Memory Isolation
Kernel-Level Programming
Which came first, programming languages or operating systems?
Programming without other programs
Kernel development
IronKernel
For embedded notes, see:
http://rust-class.org/class-14-entering-ring-naught.html
University of Virginia
cs4414: Operating Systems
http://rust-class.org
For embedded notes, see:
http://rust-class.org/class-19-synchronization.html
Node Interactive Debugging Node.js In ProductionYunong Xiao
Learn about the tools and methodologies we use in production at Netflix to diagnose and fix performance issues, bugs and memory leaks -- all without having to restart or change our Node application. Find out about profiling and post mortem tools such as perf events and mdb, visualizations like flame graphs and latency distributions, and how they help us keep our Node stack efficient.
Streams are a fundamental programming primitive for representing the flow of data through your system. It's time we brought this powerful tool to the web. What if we could stream data from a HTTP request, through a web worker that transforms it, and then into a <video> tag? Over the last year, I've been working on the WHATWG streams specification, which builds upon the lessons learned in Node.js, to provide a suitable abstraction for needs of the extensible web.
I'll discuss briefly why streams are important, what they enable, and the role we envision them playing in the future of the web platform. Mostly, though, I want to help you understand streams, at a deep level. In the course of writing this specification, I've learned a lot about streams, and I want to share that knowledge with you. At the core, they are a very simple and beautiful abstraction. I think we've done a good job capturing that abstraction, and producing an API the web can be proud of. I'd love to tell you all about it.
University of Virginia
cs4414: Operating Systems
http://rust-class.org
Explicit vs. Automatic Memory Management
Garbage Collection, Reference Counting
Rust ownership types
For embedded notes, see: http://rust-class.org/class9-pointers-in-rust.html
The document discusses Groovy and Grails. Groovy is a dynamic language for the JVM that is inspired by languages like Python and Ruby. It allows seamless integration with Java classes and libraries. Grails is a web framework for Groovy that is inspired by Ruby on Rails. It uses Spring MVC, Hibernate, and other technologies to provide features like auto-generation of code and integration with databases. The document provides examples of using closures, dynamic methods, lists, and maps in Groovy and generating applications using Grails.
[Sitcon2018] Analysis and Improvement of IOTA PoW ImplementationZhen Wei
This document discusses analysis and improvements made to the Proof of Work (PoW) implementation used in IOTA. It begins with introductions of the authors and provides background on IOTA and how transactions work. It then analyzes the performance of different PoW implementations in the gIOTA library and identifies issues with the OpenCL version. A new library called dcurl is created to optimize PoW performance by enabling multi-threaded execution and leveraging different hardware. dcurl is integrated into IRI and shown to provide significant performance improvements over the existing PoW implementation when attached to the Tangle. Future work areas are also discussed.
Is your profiler speaking the same language as you? -- Docklands JUGSimon Maple
Profilers are absolute beasts. And profilers might prove useful to pinpoint the performance issues in your Java applications.
By using profilers, developers are fortunate to find the root cause of an issue at hand. However, it requires effort to actually comprehend the data collected by the profiler. Due to the inherent complexity of the data, one has to understand how this data is collected. And thus understand how the profiler actually works.
During this talk we will go through the classic profiler features. What is a hotspot? What is the difference between sampling and instrumentation from the profiler point of view? What are the problems with either of those methods? What is the time budget of the application? And more!
I will also showcase a new kid on the block among the profiling tools: XRebel. This tool provides insight into application behaviour and permits the developers to discover application level issues.
This document summarizes a workshop on .NET debugging techniques. The workshop covers debugging production issues, analyzing system and application performance, and automating debugging processes. It discusses tools like Procdump, DebugDiag, and Windows debugging tools. It also covers debugging techniques like generating dump files, using Event Tracing for Windows (ETW) to collect traces, and analyzing traces with tools like PerfView. The goal is to help integrate automatic error analysis and triage into development processes.
Presentation by Dmitriy Podrezov, a Software Developer at EastBanc Technologies | 01/17/17
As showcased in the Microsoft Connect 2016 conference, .NET Core is all over the place. Right now, we've got servers, containers, IoT devices, and even TVs that are shipped with compact Core distributions enabling all sorts of scenarios we could only imagine in the past. It is time to catch the wave and prepare ourselves for the wide ecosystem of .NET Core enabled platforms that will be on the market very soon.
To understand what's in the newest Microsoft framework, we need to understand the introduced .NET Standard. During this meetup, Dmitry Podrezov will guide us behind the curtain of .NET Core platform and solutions using the latest development tools and typical samples.
From this presentation you learn:
• .NET Core Platform motivation and principles
• Its main components
• Common tasks and tools
• Ways to contribute.
This document discusses techniques for debugging .NET applications using memory dumps. It describes how to generate memory dumps using Task Manager, ProcDump, and Debug Diagnostics. It then explains how to analyze dumps using WinDbg, Debug Diagnostics, and Visual Studio. Specific issues covered include crashes, performance problems, and memory leaks. Automated analysis of dumps is demonstrated using CLRMD.
This document discusses debugging techniques for production environments. It covers using debuggers and symbol files to debug running processes, remote debugging to debug processes on other machines, analyzing core dumps to debug crashed processes postmortem, and snapshot debugging using Application Insights to capture the state of an application during errors. It also introduces the OzCode production debugging platform, which aims to provide a unified experience for debugging applications running in cloud, on-premise, and other complex environments.
Production Debugging at Code Camp PhillyBrian Lyttle
This document provides an introduction to production debugging techniques. It discusses monitoring tools like Task Manager and Performance Monitor, debugging fundamentals like stack traces and crash dumps, protocol analysis, and remote debugging. The goal is to help developers effectively debug problems in production environments using tools that don't require a development workstation.
- The document discusses debugging Node.js applications in production environments at Netflix, which has strict uptime requirements. It describes techniques used such as collecting stack traces from running processes using perf and visualizing them in flame graphs to identify performance bottlenecks. It also covers configuring Node.js to dump core files on errors to enable post-mortem debugging without affecting uptime. The techniques help Netflix reduce latency, increase throughput, and fix runtime crashes and memory leaks in production Node.js applications.
Key Steps in Developing .NET Core ApplicationsDamir Dobric
This document is an agenda for a .NET Core conference on September 29, 2016 at the Hotel Antunović in Zagreb. It discusses the framework for cross-platform development with .NET Core, including the types of applications that can be created and how to build, deploy, and run them. It also covers topics like libraries, dependencies, and testing.
Tamir Dresher - Demystifying the Core of .NET CoreTamir Dresher
.NET Core has revolutionized the way we build applications. Today, you can write .NET code once and run it anywhere using the tools, practices, and techniques that .NET community known and loved for years. In this session, you'll learn about architecture of .NET Core and .NET Standard which allows it to run on any platform like Linux, OSX and windows. And you will explore how to integrate the different utilities, libraries and concepts to maximize your .NET skills in the new world of cross-platform .NET.
This document introduces .NET Core and its advantages over the .NET Framework. It discusses how .NET Core is cross-platform, uses the .NET Standard library, and can create self-contained applications. It also highlights how .NET Core applications are smaller, faster, and container-friendly. The document demonstrates how to use the dotnet CLI and publish .NET Core applications to reduce their deployment size. Overall, it promotes adopting .NET Core for its performance, portability, and familiar .NET APIs.
Troubleshooting .NET Applications on Cloud FoundryAltoros
These slides overview how logs can be employed to troubleshoot .NET app on Cloud Foundry, as well as how to use metrics to enable preventive maintenance.
The .NET Garbage Collector (GC) is really cool. It helps providing our applications with virtually unlimited memory, so we can focus on writing code instead of manually freeing up memory. But how does .NET manage that memory? What are hidden allocations? Are strings evil? It still matters to understand when and where memory is allocated. In this talk, we’ll go over the base concepts of .NET memory management and explore how .NET helps us and how we can help .NET – making our apps better. Expect profiling, Intermediate Language (IL), ClrMD and more!
.NET Core Blimey! Windows Platform User Group, Manchestercitizenmatt
This document discusses .NET Core, a new open source, cross-platform version of .NET. It is not a new version of the .NET Framework, but rather a fork intended to be modular and optimized for cloud deployments. Key aspects include using NuGet for distribution, targeting multiple platforms like Linux and Mac, and using .NET Standard to define a common set of APIs across platforms. It aims to improve on Portable Class Libraries and make .NET more cross-platform.
Debugging is an important part of the software development process that helps developers write more reliable code. There are several tools available for debugging .NET applications, including Visual Studio and Debugging Tools for Windows. Some basic debugging tasks involve setting breakpoints, stepping through code, examining variables and call stacks, and understanding memory usage and threads. Postmortem debugging techniques like dump file analysis can help debug problems that occur in production environments where live debugging is not possible.
The document discusses various .NET debugging techniques, including:
1. The importance of debugging and the tools available for debugging .NET applications, such as Visual Studio and Debugging Tools for Windows.
2. Basic debugging tasks like setting breakpoints, stepping through code, and examining variables and call stacks.
3. Advanced techniques like debugging managed code, threads, and memory issues.
The .NET Garbage Collector (GC) is really cool. It helps providing our applications with virtually unlimited memory, so we can focus on writing code instead of manually freeing up memory. But how does .NET manage that memory? What are hidden allocations? Are strings evil? It still matters to understand when and where memory is allocated. In this talk, we’ll go over the base concepts of .NET memory management and explore how .NET helps us and how we can help .NET – making our apps better. Expect profiling, Intermediate Language (IL), ClrMD and more!
The document outlines various case studies and techniques for debugging web applications, including using tools like Performance Monitor, Process Explorer, and Message Analyzer to troubleshoot issues with high memory usage, unexplained exceptions, and failures in SSL/TLS communication. It provides examples of debugging slow or hanging services, tracking down errors only seen under heavy loads, and identifying memory leaks in .NET applications.
.NET Core Blimey! (Shropshire Devs Mar 2016)citizenmatt
This document discusses .NET Core, a new open source, cross-platform version of .NET. It is not a new version of the .NET Framework, but rather a fork that is being merged back. .NET Core includes CoreCLR (the runtime), CoreFX (the base class library), and tools like the .NET CLI. It uses NuGet for distribution and targets the new .NET Standard platform for cross-platform compatibility. Key goals are running on Linux and Mac as well as Windows, and being optimized for cloud-based applications.
.NET Core Blimey! (dotnetsheff Jan 2016)citizenmatt
.NET Core is a new open source, cross-platform version of .NET that is optimized for cloud-based development scenarios. It consists of a modular runtime (CoreCLR), class libraries (CoreFX), and tools (CLI). .NET Core is not a new version of the .NET Framework, but rather a fork that is being merged back. It aims to provide a consistent development experience across platforms via NuGet packages and the .NET Standard platform specification.
Functional programming techniques in regular JavaScriptPavel Klimiankou
How to apply some functional programming ideas in regular JavaScript.
1. Immutability
2. Simple functions
3. Not that simple functions
4. Combining OOP and FP
5. Functors
6. Monads
Приёмы функционального программирования в обычном JavaScriptPavel Klimiankou
Что можно привнести в объектно-ориентированный JavaScript из функционального программирования, не переходя в секту свидетелей монад. В программе:
1. Immutability
2. Просто функции
3. Непросто функции
4. Комбинация ООП/ФП
5. Функторы
6. Ок, монады
Browser APIs for data exchange: types and applicationPavel Klimiankou
What browser APIs can we use for data exchange. XMLHttpRequest, fetch(), Server-Sent Events, WebSocket, WebRTC. What's the difference. Use cases for each of those.
Чем можно обмениваться данными: XMLHttpRequest, fetch(), Server-Sent Events, WebSocket, WebRTC. В чем отличия. Какие недостатки. Примеры задач, под которые они заточены.
Docker allows you to package applications with their dependencies into standardized units called containers that can run on any Linux server. Containers are more portable and efficient than virtual machines, starting in milliseconds and using less disk space. Docker makes it easy to deploy and run applications without having to rebuild environments and guarantees that an application will run the same regardless of the infrastructure it is running on.
Зачем нужен и что такое докер. Чем он отличается от виртуальных машин. Как создать, сохранить и запустить свой докер-контейнер.
Обновленная презентация с шестого 4front митапа в Минске.
How to create basic physic effects in JavaScript game: gravity, collisions, friction, restitution, impulse, compound objects and their destruction.
Examples: http://pavel-klimiankou.github.io/physics-talk/
Sources: http://github.com/pavel-klimiankou/physics-talk
Как сделать базовые физические штуки в JavaScript игре: гравитация, столкновения, трение, упругость, импульс, создание и разрушение сложных объектов. И.. машинки!
Примеры: http://pavel-klimiankou.github.io/physics-talk/
Код: http://github.com/pavel-klimiankou/physics-talk
Alt-lenders are scaling fast, but manual loan reconciliation is cracking under pressure. See how automation solves revenue leakage and compliance chaos.
https://www.taxilla.com/loan-repayment-reconciliation
Build enterprise-ready applications using skills you already have!PhilMeredith3
Process Tempo is a rapid application development (RAD) environment that empowers data teams to create enterprise-ready applications using skills they already have.
With Process Tempo, data teams can craft beautiful, pixel-perfect applications the business will love.
Process Tempo combines features found in business intelligence tools, graphic design tools and workflow solutions - all in a single platform.
Process Tempo works with all major databases such as Databricks, Snowflake, Postgres and MySQL. It also works with leading graph database technologies such as Neo4j, Puppy Graph and Memgraph.
It is the perfect platform to accelerate the delivery of data-driven solutions.
For more information, you can find us at www.processtempo.com
War Story: Removing Offensive Language from Percona ToolkitSveta Smirnova
Slides for the online stream at https://www.youtube.com/live/JOEpIQL7cXM for Percona (https://percona.community/events/2025-03-sveta-toolkit/) MySQL 8.4 GA was released with dropped offensive replication statements, such as START/STOP SLAVE. As a maintainer of the Percona Toolkit: a set of tools, originally written in the early days of MySQL when nobody was even thinking that these statements would change, - I had to rewrite all tools and libraries that use replication statements. This ended up with a huge changeset for 511 files in the toolkit. This stream covers the resolved and not yet resolved challenges that I have met when renewing legacy code.
Custom Software Development: Types, Applications and Benefits.pdfDigital Aptech
Discover the different types of custom software, their real-world applications across industries, and the key benefits they offer. Learn how tailored solutions improve efficiency, scalability, and business performance in this comprehensive overview.
Boost Student Engagement with Smart Attendance Software for SchoolsVisitu
Boosting student engagement is crucial for educational success, and smart attendance software is a powerful tool in achieving that goal. Read the doc to know more.
The rise of e-commerce has redefined how retailers operate—and reconciliation...Prachi Desai
As payment flows grow more fragmented, the complexity of reconciliation and revenue recognition increases. The result? Mounting operational costs, silent revenue leakages, and avoidable financial risk.
Spot the inefficiencies. Automate what’s slowing you down.
https://www.taxilla.com/ecommerce-reconciliation
Online Queue Management System for Public Service Offices [Focused on Municip...Rishab Acharya
This report documents the design and development of an Online Queue Management System tailored specifically for municipal offices in Nepal. Municipal offices, as critical providers of essential public services, face challenges including overcrowded queues, long waiting times, and inefficient service delivery, causing inconvenience to citizens and pressure on municipal staff. The proposed digital platform allows citizens to book queue tokens online for various physical services, facilitating efficient queue management and real-time wait time updates. Beyond queue management, the system includes modules to oversee non-physical developmental programs, such as educational and social welfare initiatives, enabling better participation and progress monitoring. Furthermore, it incorporates a module for monitoring infrastructure development projects, promoting transparency and allowing citizens to report issues and track progress. The system development follows established software engineering methodologies, including requirement analysis, UML-based system design, and iterative testing. Emphasis has been placed on user-friendliness, security, and scalability to meet the diverse needs of municipal offices across Nepal. Implementation of this integrated digital platform will enhance service efficiency, increase transparency, and improve citizen satisfaction, thereby supporting the modernization and digital transformation of public service delivery in Nepal.
How AI Can Improve Media Quality Testing Across Platforms (1).pptxkalichargn70th171
Media platforms, from video streaming to OTT and Smart TV apps, face unprecedented pressure to deliver seamless, high-quality experiences across diverse devices and networks. Ensuring top-notch Quality of Experience (QoE) is critical for user satisfaction and retention.
UberEats clone app Development TechBuilderTechBuilder
Our food delivery app development solutions are designed to cater to varied business models, whether you are a startup aiming to scale, an enterprise-class business, or a niche player. With scalability, easy-to-use interfaces, and powerful AI capabilities, our solutions scale with your vision.
For more Please Visit Here : https://techbuilder.ai/food-delivery-app-development/
AI-ASSISTED METAMORPHIC TESTING FOR DOMAIN-SPECIFIC MODELLING AND SIMULATIONmiso_uam
AI-ASSISTED METAMORPHIC TESTING FOR DOMAIN-SPECIFIC MODELLING AND SIMULATION (plenary talk at ANNSIM'2025)
Testing is essential to improve the correctness of software systems. Metamorphic testing (MT) is an approach especially suited when the system under test lacks oracles, or they are expensive to compute. However, building an MT environment for a particular domain (e.g., cloud simulation, automated driving simulation, production system simulation, etc) requires substantial effort.
To alleviate this problem, we propose a model-driven engineering approach to automate the construction of MT environments, which is especially useful to test domain-specific modelling and simulation systems. Starting from a meta-model capturing the domain concepts, and a description of the domain execution environment, our approach produces an MT environment featuring comprehensive support for the MT process. This includes the definition of domain-specific metamorphic relations, their evaluation, detailed reporting of the testing results, and the automated search-based generation of follow-up test cases.
In this talk, I presented the approach, along with ongoing work and perspectives for integrating intelligence assistance based on large language models in the MT process. The work is a joint collaboration with Pablo Gómez-Abajo, Pablo C. Cañizares and Esther Guerra from the miso research group and Alberto Núñez from UCM.
How John started to like TDD (instead of hating it) (ViennaJUG, June'25)Nacho Cougil
Let me share a story about how John (a developer like any other) started to understand (and enjoy) writing Tests before the Production code.
We've all felt an inevitable "tedium" when writing tests, haven't we? If it's boring, if it's complicated or unnecessary? Isn't it? John thought so too, and, as much as he had heard about writing tests before production code, he had never managed to put it into practice, and even when he had tried, John had become even more frustrated at not understanding how to put it into practice outside of a few examples katas 🤷♂️
Listen to this story in which I will explain how John went from not understanding Test Driven Development (TDD) to being passionate about it... so much that now he doesn't want to work any other way 😅 ! He must have found some benefits in practising it, right? He says he has more advantages than working in any other way (e.g., you'll find defects earlier, you'll have a faster feedback loop or your code will be easier to refactor), but I'd better explain it to you in the session, right?
PS: Think of John as a random person, as if he was even the speaker of this talk 😉 !
---
Presentation shared at ViennaJUG, June'25
Feedback form:
https://bit.ly/john-like-tdd-feedback
Content Mate Web App Triples Content Managers‘ ProductivityAlex Vladimirovich
Content Mate is a web application that consolidates dozens of fragmented operations into a single interface. The input is a list of product SKUs, and the output is an archive containing processed images, PDF documents, and spreadsheets with product names, descriptions, attributes, and key features—ready for bulk upload.
Shortcomings of EHS Software – And How to Overcome ThemTECH EHS Solution
Shortcomings of EHS Software—and What Overcomes Them
What you'll learn in just 8 slides:
- 🔍 Why most EHS software implementations struggle initially
- 🚧 3 common pitfalls: adoption, workflow disruption, and delayed ROI
- 🛠️ Practical solutions that deliver long-term value
- 🔐 Key features: centralization, security, affordability
- 📈 Why the pros outweigh the cons
Perfect for HSE heads, plant managers, and compliance leads!
#EHS #TECHEHS #WorkplaceSafety #EHSCompliance #EHSManagement #ehssoftware #safetysoftware
30. Solution: use lttng and listen to runtime events
1) lttng create my-session
2) lttng enable-event --userspace --tracepoint
DotNETRuntime:Exception*
3) # start user application
4) lttng start
5) lttng stop
6) lttng destroy
31. Runtime events should be enabled first
export COMPlus_EnableEventLog=1
or
COMPlus_EnableEventLog=1 dotnet run
32. How to view results
babeltrace ~/lttng-traces/my-session*
33. Where do I find the list of all events?
View perfcollect source. To name a few:
● DotNETRuntime:GCStart
● DotNETRuntime:GCEnd
● DotNETRuntime:WorkerThreadCreate
● DotNETRuntime:WorkerThreadTerminate
● DotNETRuntime:ExceptionThrown
● DotNETRuntime:Contention
● DotNETRuntime:EventSource
● DotNETRuntime:AssemblyLoad
34. Core dumps
● A backstory
● Troubleshooting
○ Sampling
○ Tracing
○ Core dumps
● A little bit of Cloud
35. Problem: where did application memory go?
or Why did the process crashed?
or What’s happening right now?
36. Solution: get a core dump or attach to process
Core dump
Live process
or + lldb + libsosplugin
Target Debugger .NET Extension
37. Solution: get a core dump or attach to process
Core dump
Live process
or + lldb + libsosplugin
Target Debugger .NET Extension
38. How to get a core dump?
1) Manually: use gcore
2) Automatically: when process crashes
Core dump
40. Automatically: when process crashes
1) Set core dumps size limit: 0 by default
a) ulimit -c unlimited
b) /etc/security/limits.conf (permanently)
2) Set the path: useless by default
a) echo "core.%e.%p" > /proc/sys/kernel/core_pattern
b) /etc/sysctl.conf (permanently)
Core dump
41. How to get lldb?
1) apt-get install lldb-3.9 # for .NET Core SDK = 2.1
2) apt-get install lldb-3.6 # for .NET Core SDK < 2.1
3) Compile .NET Core SDK against any other lldb
lldb
42. How to get libsosplugin?
Easy. Comes along with SDK
libsosplugin
50. lldb also can
1) Show threads
2) Stacks
3) Types and Assemblies
4) Set breakpoints
51. Links
● Profile .NET Core process
○ https://codeblog.dotsandbrackets.com/profiling-net-core-app-linux/
● Analyze process memory
○ https://codeblog.dotsandbrackets.com/net-core-memory-linux/
● Debug from command line
○ https://codeblog.dotsandbrackets.com/command-line-debugging-core-linux/
● Debugging session example
○ https://codeblog.dotsandbrackets.com/debug-adapter-process-has-terminated/
53. A cloud.
Google Cloud.
● A backstory
● Debugging
○ Sampling
○ Tracing
○ Core dumps
● A little bit of Cloud
54. What’s Google Cloud Platform is for
Minimum
Hosting your application in their data centers (IaaS)
Maximum
Building your application over their platform and services (PaaS)
55. What’s Google Cloud Platform is for
Application
Data
Compute Power
Storage
Network
Self hosting
OS/Middleware
Application
Data
Compute Power
Storage
Network
IaaS
OS/Middleware
Application
Data
Compute Power
Storage
Network
PaaS
OS/Middleware
56. Infrastructure as a Service: Google edition
Take a
1) Compute power (Compute Engine),
2) Storage (Persistent Disk) and
3) Network (just exists)
and tell everybody it’s a Cloud.
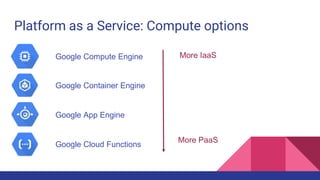
57. Platform as a Service: Compute options
Google Compute Engine
Google Container Engine
Google App Engine
Google Cloud Functions
More IaaS
More PaaS
60. How we use Google Cloud for CI/CD
Compute Engine
GitLab VM
Build Server 0 Build Server N
...
VM 0
Permanent
~1 month
~30 minutes VM 1
VM 4 VM 5
VM 8 VM 9
VM 0 VM 1
VM 4 VM 5
VM 8 VM 9
VM 1
VM 5
VM 9
Build artifacts
Test results