SlideShare a Scribd company logo
UML, ER and DIMENSIONAL MODELS
S t e f a n o D a l l a P a l m a
A model is an abstraction
that describe a system
Software size grows up rapidly
UML, ER and Dimensional Modelling
Unified Modelling Language
UML is way of visualizing a software program using
diagrams
Class
Diagram
Object
Diagram
Package
Diagram
Component
Diagram
Deployment
Diagram
Composite
Structure
Diagram
Sequence
Diagram
Activity
Diagram
Use case
Diagram
Collaborative
Diagram
Statechart
Diagram
Structural diagrams Behavioural diagrams
UML is way of visualizing a software program using
diagrams
Class
Diagram
Object
Diagram
Package
Diagram
Component
Diagram
Deployment
Diagram
Composite
Structure
Diagram
Structural diagrams Behavioural diagrams
Activity
Diagram
Use case
Diagram
Collaborative
Diagram
Statechart
Diagram
Sequence
Diagram
Why do we use UML?
A complex enterprise application with many
collaborators will require a solid foundation of
planning and clear, concise communication among
team members as the project advance. Visualizing
user interactions, processes, and the structure of the
system you're trying to build will help save time down
the line and make sure everyone on the team is on the
same page.
Use Case diagram
ActorName
Actor
Actors are roles, external entities (users, systems, environment)
that interact with the system
UseCaseName
A use case is a class of functionalities provided by the
system as events flow. It consists of an unique name,
participating actors, entry conditions, event flows, exit
conditions, special requirements
Use Case
JADS
Student
<<Use>>
RegisterGrades
JADS
Professor
NotifyPostponedExam
System
Notifier
AddExam
BookExam
<<User>>
<<User>>
<<System>>
Include
UC2
<<include>>
UC1
Include is used to extract use case fragments that
are duplicated in multiple use cases for the purpose of
reuse
ATMUser
DepositCash WithdrawCash TransferFunds
Authenticate
<<include>> <<include>>
<<include>>
Extend
UC2
<<extend>>
UC1
Extend models exceptional or rare cases
It is used when a use case adds steps to another first-
class use case
ATMUser
DepositCash WithdrawCash TransferFunds
Cancel
<<extend>> <<extend>><<extend>>
CardNotSupported
Inheritance
Inheritance models the hierarchy between actors and
use cases. It is used to specialize a more general use
case adding more details
UC2UC1
ATMUser
DepositCash WithdrawCash TransferFunds
Authenticate
<<include>> <<include>>
<<include>>
AuthenticateWithPin AuthenticateWithFingerprint
Class diagram
Class
Access modifier
All classes have different access levels – visibility – depending on the access modifier
Visibility markers signify who can access the information
contained within a class
UML, ER and Dimensional Modelling
Inheritance
Inheritance (or generalization) is a
relationship between two classes
where one class is a specialized
version of another
UML, ER and Dimensional Modelling
Associations
Associations model static relationships between classes
Unidirectional association
Bidirectional association
In a unidirectional association one class is aware of the
other and interact with it
It is modelled with a straight connecting line that points an open
arrowhead from knowing class to the known class
In a bidirectional association both classes are aware of
each other and their relationships with the other
Association name* 0…1
Multiplicity
Role Role
Reading direction
Unary association
wife
husband
0…1
0…1
marriedTo
Unary association
wife
husband
0…1
0…1
marriedTo
marriedTo
wifehusband
Unary association
wife
husband
0...1
0...1
marriedTo
marriedTo
wifehusband
marriedTo
wifehusband
husband
wife
Unary association
wife
husband
0...1
0…1
marriedTo
marriedTo
wifehusband
marriedTo
wifehusband
husband
wife
Binary association
hasCapital
1 1
administers
1 *
attends
* *
1-to-1 association
1-to-many association
many-to-many association
n-ary association: more than two classes are
involved in the relationship
*
*
0…1 examiner
Grade
Ternary association
class
Association class is necessary when modeling many-to-many
associations. It is possible, but not necessary, when modeling 1-
to-1 or 1-to-many associations
*
Association class
*
*1
*
Association class
*
*1
Association class is necessary when modeling many-to-many
associations. It is possible, but not necessary, when modeling 1-
to-1 or 1-to-many associations
Dependency
A dependency is a relationship between two elements in
which a change to an independent element can have
repercussions on a dependent element
Class A depends on class B, which means that changing
the structure or the behaviour of B could affect the
structure or the behaviour of A
Independent classDependent class
Aggregation
Aggregation is a special association that denotes a “consist of”
hierarchy between a class A, the aggregate, and a class B, its part. It
is used to express that a class is part of another class. Aggregation
is a weak ownership between two classes, meaning that parts can
exist independently of the whole
4,4 2,5
0,1*
* 1,*
Student is part of a lab class
Course is part of a study program
A car consist of an engine, a battery, four wheel and at least two doors
and maximum five doors
Composition
Composition is a special type of aggregation that denotes a strong
ownership between class A, the whole, and class B, its part. There exists a
dependency between the two classes. If the composite object (the whole) is
deleted, also its parts are deleted. Furthermore, one part can only be
contained in at most one composite object at one specific point in time
1
Lecture hall is part of the building. If the building is
deleted, the lecture hall is also deleted
City is part of the Country and the Country is part of the
World. If the Country is deleted, the City is also deleted. If
the World is deleted…
1
11
*
* *
Apocalypse
Sequence
diagram
describe interactions among classes, or
among actors and the system, in terms of
an exchange of messages over time
Sequence diagrams
Participant
Participant (or class role) describe the way an object will
behave in context. Use the UML object symbols to
illustrate roles, but don’t list object attributes
Lifeline
Lifelines are vertical dashed lines that indicate the
object's presence over time. Theyrepresent either roles
or object instances that participate in the sequence
being modelled
Execution
Occurrence
Activation boxes represent the time an object needs to
complete a task. When an object is busy executing a
process or waiting for a reply message, use a thin
rectangle placed vertically on its lifeline
Messages
Messages are arrows that represent communication
between objects
The message (or method) name is placed above the arrowed line. The message that is
being sent to the receiving object represents an operation (or method) that the
receiving object's class implements.
Synchronous
message
A synchronous message requires a response before the
interaction can continue. It's usually drawn using a line
with a solid arrowhead pointing from one object to
another
Asynchronous
message
An asynchronous message doesn’t need a reply for
interaction to continue. Like synchronous messages,
they are drawn with an arrow connecting two lifelines;
however, the arrowhead is usually opened and there is
no return message depicted
Reply message
A reply message is drawn with a dotted line and an open
arrowhead pointing back to the original lifeline
Self message
A self message is a message an object sends to itself,
usually shown as a U shaped arrow pointing back to
itself
Create message
A create message creates an new object. Similar to a
return message, it’s depicted with a dashed line and an
open arrowhead that points to the rectangle
representing the object created
Destroy message
A destroy message destroys an object. It can be shown
by an arrow with an X at the end
UML, ER and Dimensional Modelling
Sequence diagrams represent the dynamic behaviour of the system
in term of interactions between objects and actors
They are complementary to class diagrams. That is, with class
diagrams one knowns the static structure of a systems and
relationships between classes, but not how classes interact each
other over time
They require a lot of time, but it’s worth it!
The reason the sequence diagram is so useful is because it shows
the interaction logic between the objects in the system in the time
order that the interactions take place
Activity diagram
illustrate dynamic nature of the system by modelling the
flow of control from activity to activity. An activity is an
operation on some class in the system that results in a
change in the state of the system. Typically, activity
diagrams are used to model workflow or business
process and internal operations
Activity diagrams
Initial state
Initial state (or start point) is shown by a small filled
circle followed by an arrow and represents the initial
action or the start point for any activity diagram
Activity
An activity (or action state) represents an ongoing
execution of a step in a workflow (such as an operation
or a transaction) that results in a change of the system
state
Activity
Action flow
Action flows, also called edges and paths, illustrate
transitions from one activity state to another
Branching
A diamond represents a decision (or branch) with
alternate paths
When an activity requires a decision prior to moving on the next
activity, add a diamond between the two activities. The outgoing
alternatives should be labelled with a condition or guard
expression. Guards are statements that must be true before moving
to the next activity
Guards
[“Condition” is true]
[“Condition” is false]
UML, ER and Dimensional Modelling
Synchronization
A fork node is used to split a single incoming flow into multiple
concurrent flows. A join node joins multiple concurrent flows back
into a single outgoing flow. A fork and join node used together are
often referred to as synchronization
Fork node
Join node
Final state
A final state is shown by a small filled circle nested
inside another empty circle and represents the final
action state for any activity diagram
UML, ER and Dimensional Modelling
Entity-Relationship
modelling
What is a database?
A database is a collection of correlated data organized in a
systematic way. With “data” we mean known facts that can be
stored. For example the name, surname and birthdate of a
person. A database must represent the aspects of the real world
under consideration, called miniworld. It must contain
correlated data. Indeed, a random collection of data cannot be
considered a database. Finally, it must be designed for a
specific use. A database can have any size and complexity.
A phonebook is a
small database
What about Facebook and
Google databases?
4.000.000.000.000.000
bytes of data are stored by Facebook every day
The equivalent of
14 billions high
quality 3 minutes
songs
UML, ER and Dimensional Modelling
Example: University
We want to realize a database for the University to manage students,
courses (with prerequisites) and passed exams. We can organize it in 4
entities:
1. STUDENT: contains data associated to each student
2. COURSE: contains data associated to each course
3. PREREQUISITES: contains the prerequisites for attending each course.
4. GRADE: contains data about the grades for each student and each
exam.
To define the database, we need to specify the structure of each
entity. That is, we have to specify attributes (data element) of each
record and the type of each data element.
UML, ER and Dimensional Modelling
A data model is a set of concepts that can be used to describe the
structure of a database, that is, (1) the types of data, (2)
relationships between data and (3) semantic constraints on data
Data Model
Data models are classified depending on the concepts used to describe the structure
of the database
High level data models (or conceptual data model): provide concepts that are near to
the way the user perceive the data.
Representational data models (or implementational data models): provide concepts
comprehensible by the final users, but that are not so distant from the way they are
physically organized.
Low-lever data models (or physical data models): provide concepts that describe
details on how data are stored on the machine.
High level data models use concepts such as entities, attributes and
relationships
STUDENT
Name Student Number Year
COURSE
Name Semester Lecturer
PREREQUISITES
Course Propaedeucity Lecturer
GRADE
Student Course Grade
Entity
An entity is a class of specific objects (facts, persons,
vehicles or otherwise) which have common properties
and are represented in the database
It can be either a physical object or abstract
Attribute
Attributes are properties that describe an entity
The entity Employee has the attributes Name, Surname,
Salary, Birthdate and Address
Separable More values Calculable
There exist several types of attribute
Multi-valued
Attribute
A multivalued attribute is an attribute that can have
multiple value
Key attribute
A key attribute is an attribute that has a unique value
for the entity. More attributes together can form a key
attribute. In such a case those attributes can be
grouped in a composite attribute that becomes a “key
attribute”
UML, ER and Dimensional Modelling
Hi, sure. Tell me more about it.
Hi dude! I need a database for my Company. Can you
help me?
Mmm… got it. What about employees?
The company is organized in departments and each
department has a name, a number that identifies it
and an employee the manage it (a manager). We need
to keep track of the manager’s start date. Each
department manages several projects. Each project
has a name, a number and a single location. A
department, instead, can have multiple location.
The Company database example
For each employee we need to keep track of its name,
SSN, address, salary, sex and birthdate. Each
employee works for a department and can work on
more projects. We also want to memorize the total
weekly hours that an employee has spent on a project
and the supervisor of each employee. Finally, each
employee has a list of dependents for which we store
name, sex, birthdate and relationship with the
employee.
Ok bro! I will work on it and I’ll let you
know. See ya!
The company is organized in departments and
each department has a name, a number that identifies
it and an employee that manage it (a manager). We
need to keep track of the manager’s start date. Each
department manages several projects. Each project
has a name, a number and a single location. A
department, instead, can have multiple location.
Let’s find the entities!
UML, ER and Dimensional Modelling
For each employee we need to keep track of its
name, SSN, address, salary, sex and birthdate. Each
employee works for a department and can work on
more projects. We also want to memorize the total
weekly hours that an employee has spent on a project
and the supervisor of each employee. Finally,
each employee has a list of dependents for which
we store name, sex, birthdate and relationship with
the employee.
Let’s find the entities!
UML, ER and Dimensional Modelling
The initial design is typically not complete. Some aspects in
the requirements will be represented as relationships.
Indeed, now we have to represent the fact that an employee
can work on multiple projects and the total weekly hours of
an employee on each project. We also need to represent
the fact that an employee manage a department and when
she start doing it and the fact that each employee has a
supervisor
Relationship
A relationship relates two or more entities with a specific
meaning
A diamond-shaped box is used to display a relationship type connected to the participating
entity types via straight lines. Note that the relationship type is not shown with an arrow. The
name should be typically be readable from left to right and top to bottom
Relationship
Name
Many-to-One
Many-to-Many
Constraint on
Relationship
Each relationship type has constraints that limit the possible entity
combinations that can participate to its instances. They are
determined by the context of the mini-world that the relationship
represent. We can distinguish between two types of constraint
(1) Cardinality Ratio and (2) Participation Constraint
Relationship
NameCardinality Cardinality
(min, max)(min, max)
Cardinality Ratio
The Cardinality Ratio specifies the minimum and maximum number
of instances that can participate to the relationship. A cardinality
ration can have any positive number, with the constraint that the
minimum cardinality must be lower than or equals to the maximum
cardinality. The minimum cardinality can be omitted, but the
maximum cardinality must always be present
Relationship
Name
(min, max) (min, max)
Participation
Constraint
The Participation Constraint specifies the minimum number of
instances that can participate to the relationship. That is, it
specifies whether the existence of an entity depends on another
entity. There exist two types
(1) Mandatory participation and (2) Optional participation
Relationship
Name
(1, max) (0, max)
Mandatory Optional
Relationship
Name
Relationship
Name
Mandatory Optional
OptionalMandatory
Different representations of mandatory and optional partecipation
(1,1) (0,N)
The following is a N-to-1 relationship. Each department can have zero or more employees (0,N)
and an employee can work for only one department (1,1). The participation is mandatory for the
entity Employee and optional for the entity Department
Mandatory participation means that each instance in the set of the entity Employee must be
related to the entity department
(0,1) (1,1)
The following is a 1-to-1 relationship. A department can be managed by only one employee and
an employee can manage at maximum one department. Therefore, the relationship is
mandatory for the entity type department and optional for the entity employee
When a type of entity participates to a relationship type more than
once with different roles we refer to those relationships as recursive.
Role Name
Recursive
Relationship
Any entity that participate to some type of relationship has a role. The name of the
role specifies the role the entity has in each instance of the relationship. For example,
in a “MARRIED_TO” relationship an entity PERSON can have the role either of husband
or wife.
Role 1
Role 2
[…] each department has […] an employee that manage it (a
manager). We need to keep track of the manager’s start date.
Each department manages several projects. […] Each
employee works for a department and can work on
more projects. We also want to memorize the total weekly hours
that an employee has spent on a project and the supervisor of
each employee. Finally, each employee has a list of
dependents […].
Let’s find the relationships!
UML, ER and Dimensional Modelling
Dimensional modelling
Why do we use Dimensional
Modelling?
All the modelling techniques give us different ways to store the data.
Different ways of storing data gives us different advantages. For
example, ER Modelling gives us the advantage of storing data is such
a way that there is less redundancy. Dimensional modelling, on the
other hand, give us the advantage of storing data in such a fashion
that it is easier to retrieve the information from the data once the
data is stored in database. Be careful! dimensional model is not a
good solution if your primary purpose of your data modeling is to
reduce storage space requirement, reduce redundancy, speed-up
loading time etc.
Dimensional Model
is a database structure that is optimized for
online queries and Data Warehousing tools. It
consits of dimensions and facts
Dimensions
are the objects of context, that is, things about
something is being spoken, and are the entry
points for getting at the facts
Facts
are numeric values that a business whishes to
count
Dimensional Models are designed for reading, summarizing and analyzing numeric
information, whereas Relational Models are optimized for adding and maintaining
data using real-time operational systems.
The goal of dimensional modelling can be summarized as
Faster Data Retrieval
Better Understandability
Extensibility
The four key decisions made during the design of a
dimensional model include:
Select the business process
Declare the grain
Identify the facts
Identify the dimensions
Select the business process
Business processes are the operational activities performed by your organization,
such as taking an order, processing an insurance claim, registering students for a
class, or snapshotting every account each month. Business process events generate
or capture performance metrics that translate into facts in a fact table. Most fact
tables focus on the results of a single business process. Choosing the process is
important because it defines a specific design target and allows the grain,
dimensions, and facts to be declared. Each business process corresponds to a row
in the enterprise data warehouse bus matrix
Declare the grain
Declaring the grain is the pivotal step in a dimensional design. The grain establishes
exactly what a single fact table row represents. The grain declaration becomes a
binding contract on the design. The grain must be declared before choosing
dimensions or facts because every candidate dimension or fact must be consistent
with the grain. This consistency enforces a uniformity on all dimensional designs that
is critical to Business Intelligence application performance and ease of use. Atomic
grain refers to the lowest level at which data is captured by a given business
process. You should start by focusing on atomic-grained data because it withstands
the assault of unpredictable user queries
Identify the dimensions
Dimensions provide the “who, what, where, when, why, and how” context surrounding
a business process event. Dimension tables contain the descriptive attributes used
by applications for filtering and grouping the facts. With the grain of a fact table
firmly in mind, all the possible dimensions can be identified. Whenever possible, a
dimension should be single valued when associated with a given fact row.
Dimension tables are sometimes called the “soul” of the data warehouse because
they contain the entry points and descriptive labels that enable the Data
Warehouse/Business Intelligence system to be leveraged for business analysis. A
disproportionate amount of effort is put into the data governance and development
of dimension tables because they are the drivers of the user’s BI experience.
Identify the facts
Facts are the measurements that result from a business process event and are
almost always numeric. A single fact table row has a one-to-one relationship to a
measurement event as described by the fact table’s grain. Thus a fact table
corresponds to a physical observable event, and not to the demands of a particular
report. Within a fact table, only facts consistent with the declared grain are allowed.
For example, in a retail sales transaction, the quantity of a product sold and its
extended price are good facts, whereas the store manager’s salary is disallowed.
A Fact Table consists of one or more numeric facts of importance to a business. At
the lowest grain, a fact table row corresponds to a measurement event and vice
versa. In addition to numeric measures, a fact table always contains foreign keys for
each of its associated dimensions. Details about the dimensions (e.g customer name,
customer address) are stored in the dimension table (i.e. customer).
Identify dimensions
In the above statement, we are speaking about 3 different things - we
are speaking about food, some specific McDonald’s store and some
specific day. Burgers and fries are two different members of food
dimension. We will have to create separate tables for separate
dimensions
The business objective is to create a data model that can store, and report
number of burgers and fries sold from a specific McDonald’s outlet per day
Identify facts
In the above statement, the number of burgers/fries sold is a measure.
Examples of facts are the number of products sold, the value of products sold, the number
of products produced and the number of service calls received
Businesses have a need to monitor these facts closely and to sum them using different
dimensions:
1. The value of products sold this quarter versus last quarter
2. The value of products sold by store
3. The value of products sold by channel (e.g. delivery apps, in-store shopping, etc.)
Businesses will often need to sum facts by multiple dimensions:
1. The value of products sold store, by product type and by day of week
2. The value of products sold by product and by channel
The business objective is to create a data model that can store, and report number
of burgers and fries sold from a specific McDonald’s outlet per day
Identify the attributes or properties of dimensions
We need to know what are the properties or attributes of each dimension that we need to
store in our table. This is important since knowing the properties let us decide what
columns are required to be created in each dimension table.
Each dimension might have number of different properties, but for a given context, not all
of them are relevant for us. As an example, let's take the dimension food. We can think of
so many different attributes of food - e.g. names of the food, price of the food, total
calories in the food, colour of the food and so on. But we need to check which of these
attributes are relevant to us - that is - which of these attributes are required for reporting
on this data. As for the given statement above, we just need to know only one attribute of
the food dimension - i.e. name of the food (burger or fries)
The business objective is to create a data model that can store, and report number
of burgers and fries sold from a specific McDonald’s outlet per day
UML, ER and Dimensional Modelling
Approaches to Dimensional Model
Star Schema
Multiple fact tables share dimension tables, viewed as a collection
of stars, therefore called galaxy schema or fact constellation
Snowflake Schema
Facts Constellation
A fact table in the middle connected to a set of dimension tables
A refinement of star schema where some dimensional hierarchy is
normalized into a set of smaller dimension tables, forming a shape
similar to snowflake
UML, ER and Dimensional Modelling

More Related Content

What's hot (19)

PPTX
class diagram
Shohan Ean
 
PPT
Uml class Diagram
Satyamevjayte Haxor
 
PPTX
UML Diagram - Use-Case diagram, Activity Diagram, Sequence Diagram, Er Diagra...
Niloy Biswas
 
PPT
Object Oriented Modeling and Design with UML
Malek Sumaiya
 
PPTX
UML Diagram @ Software engineering discussion
CherryBerry2
 
PPT
UML Diagram Assignment Help, UML Diagram Homework Help
Jacob William
 
PPT
Umldiagram
pavandeep11
 
PPT
Interfaces & Packages V2
Dr Anjan Krishnamurthy
 
PPT
Slide 5 Class Diagram
Niloy Rocker
 
PPT
Class diagram
LakshmanaD2
 
PPTX
The Ultimate Guide for UML Class Diagrams by Creately
Creately
 
PPTX
Unified Modeling Language
surana college
 
PPT
34. uml
karzansaid
 
PPT
Relations Class Diagram
halwal
 
PPT
Unified Modeling Language
Debajyoti Biswas
 
PPTX
unified modelling language(UML) diagrams
pratyashi satapathy
 
DOC
Case Study Uml
ganesh12july
 
PPT
Class diagram presentation
SayedFarhan110
 
class diagram
Shohan Ean
 
Uml class Diagram
Satyamevjayte Haxor
 
UML Diagram - Use-Case diagram, Activity Diagram, Sequence Diagram, Er Diagra...
Niloy Biswas
 
Object Oriented Modeling and Design with UML
Malek Sumaiya
 
UML Diagram @ Software engineering discussion
CherryBerry2
 
UML Diagram Assignment Help, UML Diagram Homework Help
Jacob William
 
Umldiagram
pavandeep11
 
Interfaces & Packages V2
Dr Anjan Krishnamurthy
 
Slide 5 Class Diagram
Niloy Rocker
 
Class diagram
LakshmanaD2
 
The Ultimate Guide for UML Class Diagrams by Creately
Creately
 
Unified Modeling Language
surana college
 
34. uml
karzansaid
 
Relations Class Diagram
halwal
 
Unified Modeling Language
Debajyoti Biswas
 
unified modelling language(UML) diagrams
pratyashi satapathy
 
Case Study Uml
ganesh12july
 
Class diagram presentation
SayedFarhan110
 

Similar to UML, ER and Dimensional Modelling (20)

PPT
Uml report
Franco Valdez
 
PPT
Intro to UML 2
rchakra
 
PPT
Selab1 slides
Sumedha
 
PDF
UML Overview and Introduction functions.pdf
prathipaceec
 
PPTX
UML_Lecture.pptxnd bfdjjrnekdddkeeeenekejneje
ssusera6a60c1
 
PPT
Fundamentals of Software Engineering
Madhar Khan Pathan
 
PDF
UML-Advanced Software Engineering
Amit Singh
 
PPTX
Lecture 17 -18 - Sequence Diagram - Class Diagram.pptx
i210865
 
PPT
Uml lecture
Inocentshuja Ahmad
 
PPT
Object oriented programming in C++ programming language
SurindraKumar
 
PPT
Introduction to software engineering in data science.ppt
SurindraKumar
 
PPT
Object oriented programming language in software engineering
SurindraKumar
 
PPTX
Lecture#02, building blocks of uml ASE
babak danyal
 
PPTX
UML Chart Designing Methods - Lecture.pptx
lankanking4
 
PPT
Cs8592 ooad unit 3
VADUGANATHAND1
 
PPT
Cs8592 ooad unit 3
MAYILVELKUMARPONNUSA
 
PPT
Uml - An Overview
Raj Thilak S
 
PPT
OOAD-Unit-3.ppt UML and ANALYSISI AND DESIGN
KalyaniLokhande5
 
PPTX
UML
Jazib Amjad
 
PDF
System Desigren_OOD-9asdasdasdsasdasdasd.pdf
testforanything13579
 
Uml report
Franco Valdez
 
Intro to UML 2
rchakra
 
Selab1 slides
Sumedha
 
UML Overview and Introduction functions.pdf
prathipaceec
 
UML_Lecture.pptxnd bfdjjrnekdddkeeeenekejneje
ssusera6a60c1
 
Fundamentals of Software Engineering
Madhar Khan Pathan
 
UML-Advanced Software Engineering
Amit Singh
 
Lecture 17 -18 - Sequence Diagram - Class Diagram.pptx
i210865
 
Uml lecture
Inocentshuja Ahmad
 
Object oriented programming in C++ programming language
SurindraKumar
 
Introduction to software engineering in data science.ppt
SurindraKumar
 
Object oriented programming language in software engineering
SurindraKumar
 
Lecture#02, building blocks of uml ASE
babak danyal
 
UML Chart Designing Methods - Lecture.pptx
lankanking4
 
Cs8592 ooad unit 3
VADUGANATHAND1
 
Cs8592 ooad unit 3
MAYILVELKUMARPONNUSA
 
Uml - An Overview
Raj Thilak S
 
OOAD-Unit-3.ppt UML and ANALYSISI AND DESIGN
KalyaniLokhande5
 
System Desigren_OOD-9asdasdasdsasdasdasd.pdf
testforanything13579
 
Ad

More from Stefano Dalla Palma (11)

PDF
Design for Testability
Stefano Dalla Palma
 
PDF
Introduction to Mutation Testing
Stefano Dalla Palma
 
PDF
Artificial Neural Networks
Stefano Dalla Palma
 
PDF
Decision Tree learning
Stefano Dalla Palma
 
PDF
Introduction to Machine Learning with examples in R
Stefano Dalla Palma
 
PDF
Introduction to Machine Learning concepts
Stefano Dalla Palma
 
PDF
Apache Mahout Architecture Overview
Stefano Dalla Palma
 
PDF
An Empirical Study on Bounded Model Checking
Stefano Dalla Palma
 
PDF
VCCFinder: Finding Potential Vulnerabilities in Open-Source Projects to Assis...
Stefano Dalla Palma
 
PPTX
Detecting controversy in microposts: an approach based on word similarity wit...
Stefano Dalla Palma
 
PDF
Prolog in a nutshell
Stefano Dalla Palma
 
Design for Testability
Stefano Dalla Palma
 
Introduction to Mutation Testing
Stefano Dalla Palma
 
Artificial Neural Networks
Stefano Dalla Palma
 
Decision Tree learning
Stefano Dalla Palma
 
Introduction to Machine Learning with examples in R
Stefano Dalla Palma
 
Introduction to Machine Learning concepts
Stefano Dalla Palma
 
Apache Mahout Architecture Overview
Stefano Dalla Palma
 
An Empirical Study on Bounded Model Checking
Stefano Dalla Palma
 
VCCFinder: Finding Potential Vulnerabilities in Open-Source Projects to Assis...
Stefano Dalla Palma
 
Detecting controversy in microposts: an approach based on word similarity wit...
Stefano Dalla Palma
 
Prolog in a nutshell
Stefano Dalla Palma
 
Ad

Recently uploaded (20)

PDF
Loading Data into Snowflake (Bulk & Stream)
Accentfuture
 
PPTX
Data anlytics Hospitals Research India.pptx
SayantanChakravorty2
 
PDF
Technical-Report-GPS_GIS_RS-for-MSF-finalv2.pdf
KPycho
 
PDF
A GraphRAG approach for Energy Efficiency Q&A
Marco Brambilla
 
PDF
UNISE-Operation-Procedure-InDHIS2trainng
ahmedabduselam23
 
PDF
apidays Singapore 2025 - The API Playbook for AI by Shin Wee Chuang (PAND AI)
apidays
 
PDF
apidays Singapore 2025 - Building a Federated Future, Alex Szomora (GSMA)
apidays
 
PDF
Unlocking Insights: Introducing i-Metrics Asia-Pacific Corporation and Strate...
Janette Toral
 
PDF
2025 Global Data Summit - FOM with AI.pdf
Marco Wobben
 
PPTX
covid 19 data analysis updates in our municipality
RhuAyungon1
 
PDF
Business implication of Artificial Intelligence.pdf
VishalChugh12
 
PDF
apidays Singapore 2025 - How APIs can make - or break - trust in your AI by S...
apidays
 
PDF
apidays Singapore 2025 - Trustworthy Generative AI: The Role of Observability...
apidays
 
PPTX
SHREYAS25 INTERN-I,II,III PPT (1).pptx pre
swapnilherage
 
PDF
Development and validation of the Japanese version of the Organizational Matt...
Yoga Tokuyoshi
 
PPTX
BinarySearchTree in datastructures in detail
kichokuttu
 
PPTX
thid ppt defines the ich guridlens and gives the information about the ICH gu...
shaistabegum14
 
PPTX
big data eco system fundamentals of data science
arivukarasi
 
PDF
apidays Singapore 2025 - Streaming Lakehouse with Kafka, Flink and Iceberg by...
apidays
 
PDF
SQL for Accountants and Finance Managers
ysmaelreyes
 
Loading Data into Snowflake (Bulk & Stream)
Accentfuture
 
Data anlytics Hospitals Research India.pptx
SayantanChakravorty2
 
Technical-Report-GPS_GIS_RS-for-MSF-finalv2.pdf
KPycho
 
A GraphRAG approach for Energy Efficiency Q&A
Marco Brambilla
 
UNISE-Operation-Procedure-InDHIS2trainng
ahmedabduselam23
 
apidays Singapore 2025 - The API Playbook for AI by Shin Wee Chuang (PAND AI)
apidays
 
apidays Singapore 2025 - Building a Federated Future, Alex Szomora (GSMA)
apidays
 
Unlocking Insights: Introducing i-Metrics Asia-Pacific Corporation and Strate...
Janette Toral
 
2025 Global Data Summit - FOM with AI.pdf
Marco Wobben
 
covid 19 data analysis updates in our municipality
RhuAyungon1
 
Business implication of Artificial Intelligence.pdf
VishalChugh12
 
apidays Singapore 2025 - How APIs can make - or break - trust in your AI by S...
apidays
 
apidays Singapore 2025 - Trustworthy Generative AI: The Role of Observability...
apidays
 
SHREYAS25 INTERN-I,II,III PPT (1).pptx pre
swapnilherage
 
Development and validation of the Japanese version of the Organizational Matt...
Yoga Tokuyoshi
 
BinarySearchTree in datastructures in detail
kichokuttu
 
thid ppt defines the ich guridlens and gives the information about the ICH gu...
shaistabegum14
 
big data eco system fundamentals of data science
arivukarasi
 
apidays Singapore 2025 - Streaming Lakehouse with Kafka, Flink and Iceberg by...
apidays
 
SQL for Accountants and Finance Managers
ysmaelreyes
 

UML, ER and Dimensional Modelling

  • 1. UML, ER and DIMENSIONAL MODELS S t e f a n o D a l l a P a l m a
  • 2. A model is an abstraction that describe a system
  • 3. Software size grows up rapidly
  • 8. UML is way of visualizing a software program using diagrams Class Diagram Object Diagram Package Diagram Component Diagram Deployment Diagram Composite Structure Diagram Sequence Diagram Activity Diagram Use case Diagram Collaborative Diagram Statechart Diagram Structural diagrams Behavioural diagrams
  • 9. UML is way of visualizing a software program using diagrams Class Diagram Object Diagram Package Diagram Component Diagram Deployment Diagram Composite Structure Diagram Structural diagrams Behavioural diagrams Activity Diagram Use case Diagram Collaborative Diagram Statechart Diagram Sequence Diagram
  • 10. Why do we use UML? A complex enterprise application with many collaborators will require a solid foundation of planning and clear, concise communication among team members as the project advance. Visualizing user interactions, processes, and the structure of the system you're trying to build will help save time down the line and make sure everyone on the team is on the same page.
  • 12. ActorName Actor Actors are roles, external entities (users, systems, environment) that interact with the system
  • 13. UseCaseName A use case is a class of functionalities provided by the system as events flow. It consists of an unique name, participating actors, entry conditions, event flows, exit conditions, special requirements Use Case
  • 15. Include UC2 <<include>> UC1 Include is used to extract use case fragments that are duplicated in multiple use cases for the purpose of reuse
  • 17. Extend UC2 <<extend>> UC1 Extend models exceptional or rare cases It is used when a use case adds steps to another first- class use case
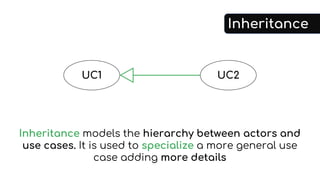
  • 19. Inheritance Inheritance models the hierarchy between actors and use cases. It is used to specialize a more general use case adding more details UC2UC1
  • 20. ATMUser DepositCash WithdrawCash TransferFunds Authenticate <<include>> <<include>> <<include>> AuthenticateWithPin AuthenticateWithFingerprint
  • 22. Class
  • 23. Access modifier All classes have different access levels – visibility – depending on the access modifier Visibility markers signify who can access the information contained within a class
  • 26. Inheritance Inheritance (or generalization) is a relationship between two classes where one class is a specialized version of another
  • 29. Associations Associations model static relationships between classes Unidirectional association Bidirectional association
  • 30. In a unidirectional association one class is aware of the other and interact with it It is modelled with a straight connecting line that points an open arrowhead from knowing class to the known class
  • 31. In a bidirectional association both classes are aware of each other and their relationships with the other Association name* 0…1 Multiplicity Role Role Reading direction
  • 36. Binary association hasCapital 1 1 administers 1 * attends * * 1-to-1 association 1-to-many association many-to-many association
  • 37. n-ary association: more than two classes are involved in the relationship * * 0…1 examiner Grade Ternary association class
  • 38. Association class is necessary when modeling many-to-many associations. It is possible, but not necessary, when modeling 1- to-1 or 1-to-many associations * Association class * *1
  • 39. * Association class * *1 Association class is necessary when modeling many-to-many associations. It is possible, but not necessary, when modeling 1- to-1 or 1-to-many associations
  • 40. Dependency A dependency is a relationship between two elements in which a change to an independent element can have repercussions on a dependent element Class A depends on class B, which means that changing the structure or the behaviour of B could affect the structure or the behaviour of A Independent classDependent class
  • 41. Aggregation Aggregation is a special association that denotes a “consist of” hierarchy between a class A, the aggregate, and a class B, its part. It is used to express that a class is part of another class. Aggregation is a weak ownership between two classes, meaning that parts can exist independently of the whole
  • 42. 4,4 2,5 0,1* * 1,* Student is part of a lab class Course is part of a study program A car consist of an engine, a battery, four wheel and at least two doors and maximum five doors
  • 43. Composition Composition is a special type of aggregation that denotes a strong ownership between class A, the whole, and class B, its part. There exists a dependency between the two classes. If the composite object (the whole) is deleted, also its parts are deleted. Furthermore, one part can only be contained in at most one composite object at one specific point in time 1
  • 44. Lecture hall is part of the building. If the building is deleted, the lecture hall is also deleted City is part of the Country and the Country is part of the World. If the Country is deleted, the City is also deleted. If the World is deleted… 1 11 * * *
  • 47. describe interactions among classes, or among actors and the system, in terms of an exchange of messages over time Sequence diagrams
  • 48. Participant Participant (or class role) describe the way an object will behave in context. Use the UML object symbols to illustrate roles, but don’t list object attributes
  • 49. Lifeline Lifelines are vertical dashed lines that indicate the object's presence over time. Theyrepresent either roles or object instances that participate in the sequence being modelled
  • 50. Execution Occurrence Activation boxes represent the time an object needs to complete a task. When an object is busy executing a process or waiting for a reply message, use a thin rectangle placed vertically on its lifeline
  • 51. Messages Messages are arrows that represent communication between objects The message (or method) name is placed above the arrowed line. The message that is being sent to the receiving object represents an operation (or method) that the receiving object's class implements.
  • 52. Synchronous message A synchronous message requires a response before the interaction can continue. It's usually drawn using a line with a solid arrowhead pointing from one object to another
  • 53. Asynchronous message An asynchronous message doesn’t need a reply for interaction to continue. Like synchronous messages, they are drawn with an arrow connecting two lifelines; however, the arrowhead is usually opened and there is no return message depicted
  • 54. Reply message A reply message is drawn with a dotted line and an open arrowhead pointing back to the original lifeline
  • 55. Self message A self message is a message an object sends to itself, usually shown as a U shaped arrow pointing back to itself
  • 56. Create message A create message creates an new object. Similar to a return message, it’s depicted with a dashed line and an open arrowhead that points to the rectangle representing the object created
  • 57. Destroy message A destroy message destroys an object. It can be shown by an arrow with an X at the end
  • 59. Sequence diagrams represent the dynamic behaviour of the system in term of interactions between objects and actors They are complementary to class diagrams. That is, with class diagrams one knowns the static structure of a systems and relationships between classes, but not how classes interact each other over time They require a lot of time, but it’s worth it! The reason the sequence diagram is so useful is because it shows the interaction logic between the objects in the system in the time order that the interactions take place
  • 61. illustrate dynamic nature of the system by modelling the flow of control from activity to activity. An activity is an operation on some class in the system that results in a change in the state of the system. Typically, activity diagrams are used to model workflow or business process and internal operations Activity diagrams
  • 62. Initial state Initial state (or start point) is shown by a small filled circle followed by an arrow and represents the initial action or the start point for any activity diagram
  • 63. Activity An activity (or action state) represents an ongoing execution of a step in a workflow (such as an operation or a transaction) that results in a change of the system state Activity
  • 64. Action flow Action flows, also called edges and paths, illustrate transitions from one activity state to another
  • 65. Branching A diamond represents a decision (or branch) with alternate paths When an activity requires a decision prior to moving on the next activity, add a diamond between the two activities. The outgoing alternatives should be labelled with a condition or guard expression. Guards are statements that must be true before moving to the next activity Guards [“Condition” is true] [“Condition” is false]
  • 67. Synchronization A fork node is used to split a single incoming flow into multiple concurrent flows. A join node joins multiple concurrent flows back into a single outgoing flow. A fork and join node used together are often referred to as synchronization Fork node Join node
  • 68. Final state A final state is shown by a small filled circle nested inside another empty circle and represents the final action state for any activity diagram
  • 71. What is a database? A database is a collection of correlated data organized in a systematic way. With “data” we mean known facts that can be stored. For example the name, surname and birthdate of a person. A database must represent the aspects of the real world under consideration, called miniworld. It must contain correlated data. Indeed, a random collection of data cannot be considered a database. Finally, it must be designed for a specific use. A database can have any size and complexity.
  • 72. A phonebook is a small database
  • 73. What about Facebook and Google databases?
  • 74. 4.000.000.000.000.000 bytes of data are stored by Facebook every day
  • 75. The equivalent of 14 billions high quality 3 minutes songs
  • 78. Example: University We want to realize a database for the University to manage students, courses (with prerequisites) and passed exams. We can organize it in 4 entities: 1. STUDENT: contains data associated to each student 2. COURSE: contains data associated to each course 3. PREREQUISITES: contains the prerequisites for attending each course. 4. GRADE: contains data about the grades for each student and each exam. To define the database, we need to specify the structure of each entity. That is, we have to specify attributes (data element) of each record and the type of each data element.
  • 81. A data model is a set of concepts that can be used to describe the structure of a database, that is, (1) the types of data, (2) relationships between data and (3) semantic constraints on data Data Model
  • 82. Data models are classified depending on the concepts used to describe the structure of the database High level data models (or conceptual data model): provide concepts that are near to the way the user perceive the data. Representational data models (or implementational data models): provide concepts comprehensible by the final users, but that are not so distant from the way they are physically organized. Low-lever data models (or physical data models): provide concepts that describe details on how data are stored on the machine.
  • 83. Data models are classified depending on the concepts used to describe the structure of the database High level data models (or conceptual data model): provide concepts that are near to the way the user perceive the data. Representational data models (or implementational data models): provide concepts comprehensible by the final users, but that are not so distant from the way they are physically organized. Low-lever data models (or physical data models): provide concepts that describe details on how data are stored on the machine. High level data models use concepts such as entities, attributes and relationships STUDENT Name Student Number Year COURSE Name Semester Lecturer PREREQUISITES Course Propaedeucity Lecturer GRADE Student Course Grade
  • 84. Entity An entity is a class of specific objects (facts, persons, vehicles or otherwise) which have common properties and are represented in the database
  • 85. It can be either a physical object or abstract
  • 86. Attribute Attributes are properties that describe an entity
  • 87. The entity Employee has the attributes Name, Surname, Salary, Birthdate and Address
  • 88. Separable More values Calculable There exist several types of attribute
  • 89. Multi-valued Attribute A multivalued attribute is an attribute that can have multiple value
  • 90. Key attribute A key attribute is an attribute that has a unique value for the entity. More attributes together can form a key attribute. In such a case those attributes can be grouped in a composite attribute that becomes a “key attribute”
  • 92. Hi, sure. Tell me more about it. Hi dude! I need a database for my Company. Can you help me? Mmm… got it. What about employees? The company is organized in departments and each department has a name, a number that identifies it and an employee the manage it (a manager). We need to keep track of the manager’s start date. Each department manages several projects. Each project has a name, a number and a single location. A department, instead, can have multiple location. The Company database example
  • 93. For each employee we need to keep track of its name, SSN, address, salary, sex and birthdate. Each employee works for a department and can work on more projects. We also want to memorize the total weekly hours that an employee has spent on a project and the supervisor of each employee. Finally, each employee has a list of dependents for which we store name, sex, birthdate and relationship with the employee. Ok bro! I will work on it and I’ll let you know. See ya!
  • 94. The company is organized in departments and each department has a name, a number that identifies it and an employee that manage it (a manager). We need to keep track of the manager’s start date. Each department manages several projects. Each project has a name, a number and a single location. A department, instead, can have multiple location. Let’s find the entities!
  • 96. For each employee we need to keep track of its name, SSN, address, salary, sex and birthdate. Each employee works for a department and can work on more projects. We also want to memorize the total weekly hours that an employee has spent on a project and the supervisor of each employee. Finally, each employee has a list of dependents for which we store name, sex, birthdate and relationship with the employee. Let’s find the entities!
  • 98. The initial design is typically not complete. Some aspects in the requirements will be represented as relationships. Indeed, now we have to represent the fact that an employee can work on multiple projects and the total weekly hours of an employee on each project. We also need to represent the fact that an employee manage a department and when she start doing it and the fact that each employee has a supervisor
  • 99. Relationship A relationship relates two or more entities with a specific meaning A diamond-shaped box is used to display a relationship type connected to the participating entity types via straight lines. Note that the relationship type is not shown with an arrow. The name should be typically be readable from left to right and top to bottom Relationship Name
  • 102. Constraint on Relationship Each relationship type has constraints that limit the possible entity combinations that can participate to its instances. They are determined by the context of the mini-world that the relationship represent. We can distinguish between two types of constraint (1) Cardinality Ratio and (2) Participation Constraint Relationship NameCardinality Cardinality (min, max)(min, max)
  • 103. Cardinality Ratio The Cardinality Ratio specifies the minimum and maximum number of instances that can participate to the relationship. A cardinality ration can have any positive number, with the constraint that the minimum cardinality must be lower than or equals to the maximum cardinality. The minimum cardinality can be omitted, but the maximum cardinality must always be present Relationship Name (min, max) (min, max)
  • 104. Participation Constraint The Participation Constraint specifies the minimum number of instances that can participate to the relationship. That is, it specifies whether the existence of an entity depends on another entity. There exist two types (1) Mandatory participation and (2) Optional participation Relationship Name (1, max) (0, max) Mandatory Optional
  • 106. (1,1) (0,N) The following is a N-to-1 relationship. Each department can have zero or more employees (0,N) and an employee can work for only one department (1,1). The participation is mandatory for the entity Employee and optional for the entity Department Mandatory participation means that each instance in the set of the entity Employee must be related to the entity department (0,1) (1,1) The following is a 1-to-1 relationship. A department can be managed by only one employee and an employee can manage at maximum one department. Therefore, the relationship is mandatory for the entity type department and optional for the entity employee
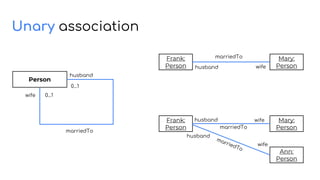
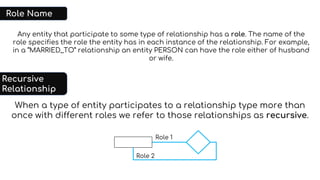
  • 107. When a type of entity participates to a relationship type more than once with different roles we refer to those relationships as recursive. Role Name Recursive Relationship Any entity that participate to some type of relationship has a role. The name of the role specifies the role the entity has in each instance of the relationship. For example, in a “MARRIED_TO” relationship an entity PERSON can have the role either of husband or wife. Role 1 Role 2
  • 108. […] each department has […] an employee that manage it (a manager). We need to keep track of the manager’s start date. Each department manages several projects. […] Each employee works for a department and can work on more projects. We also want to memorize the total weekly hours that an employee has spent on a project and the supervisor of each employee. Finally, each employee has a list of dependents […]. Let’s find the relationships!
  • 113. Why do we use Dimensional Modelling? All the modelling techniques give us different ways to store the data. Different ways of storing data gives us different advantages. For example, ER Modelling gives us the advantage of storing data is such a way that there is less redundancy. Dimensional modelling, on the other hand, give us the advantage of storing data in such a fashion that it is easier to retrieve the information from the data once the data is stored in database. Be careful! dimensional model is not a good solution if your primary purpose of your data modeling is to reduce storage space requirement, reduce redundancy, speed-up loading time etc.
  • 114. Dimensional Model is a database structure that is optimized for online queries and Data Warehousing tools. It consits of dimensions and facts Dimensions are the objects of context, that is, things about something is being spoken, and are the entry points for getting at the facts Facts are numeric values that a business whishes to count
  • 115. Dimensional Models are designed for reading, summarizing and analyzing numeric information, whereas Relational Models are optimized for adding and maintaining data using real-time operational systems.
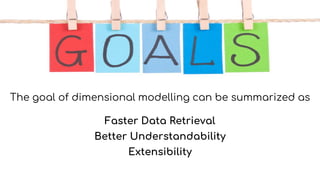
  • 116. The goal of dimensional modelling can be summarized as Faster Data Retrieval Better Understandability Extensibility
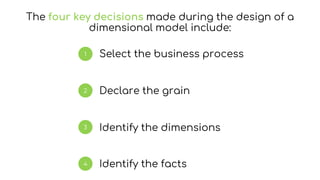
  • 117. The four key decisions made during the design of a dimensional model include: Select the business process Declare the grain Identify the facts Identify the dimensions
  • 118. Select the business process Business processes are the operational activities performed by your organization, such as taking an order, processing an insurance claim, registering students for a class, or snapshotting every account each month. Business process events generate or capture performance metrics that translate into facts in a fact table. Most fact tables focus on the results of a single business process. Choosing the process is important because it defines a specific design target and allows the grain, dimensions, and facts to be declared. Each business process corresponds to a row in the enterprise data warehouse bus matrix
  • 119. Declare the grain Declaring the grain is the pivotal step in a dimensional design. The grain establishes exactly what a single fact table row represents. The grain declaration becomes a binding contract on the design. The grain must be declared before choosing dimensions or facts because every candidate dimension or fact must be consistent with the grain. This consistency enforces a uniformity on all dimensional designs that is critical to Business Intelligence application performance and ease of use. Atomic grain refers to the lowest level at which data is captured by a given business process. You should start by focusing on atomic-grained data because it withstands the assault of unpredictable user queries
  • 120. Identify the dimensions Dimensions provide the “who, what, where, when, why, and how” context surrounding a business process event. Dimension tables contain the descriptive attributes used by applications for filtering and grouping the facts. With the grain of a fact table firmly in mind, all the possible dimensions can be identified. Whenever possible, a dimension should be single valued when associated with a given fact row. Dimension tables are sometimes called the “soul” of the data warehouse because they contain the entry points and descriptive labels that enable the Data Warehouse/Business Intelligence system to be leveraged for business analysis. A disproportionate amount of effort is put into the data governance and development of dimension tables because they are the drivers of the user’s BI experience.
  • 121. Identify the facts Facts are the measurements that result from a business process event and are almost always numeric. A single fact table row has a one-to-one relationship to a measurement event as described by the fact table’s grain. Thus a fact table corresponds to a physical observable event, and not to the demands of a particular report. Within a fact table, only facts consistent with the declared grain are allowed. For example, in a retail sales transaction, the quantity of a product sold and its extended price are good facts, whereas the store manager’s salary is disallowed. A Fact Table consists of one or more numeric facts of importance to a business. At the lowest grain, a fact table row corresponds to a measurement event and vice versa. In addition to numeric measures, a fact table always contains foreign keys for each of its associated dimensions. Details about the dimensions (e.g customer name, customer address) are stored in the dimension table (i.e. customer).
  • 122. Identify dimensions In the above statement, we are speaking about 3 different things - we are speaking about food, some specific McDonald’s store and some specific day. Burgers and fries are two different members of food dimension. We will have to create separate tables for separate dimensions The business objective is to create a data model that can store, and report number of burgers and fries sold from a specific McDonald’s outlet per day
  • 123. Identify facts In the above statement, the number of burgers/fries sold is a measure. Examples of facts are the number of products sold, the value of products sold, the number of products produced and the number of service calls received Businesses have a need to monitor these facts closely and to sum them using different dimensions: 1. The value of products sold this quarter versus last quarter 2. The value of products sold by store 3. The value of products sold by channel (e.g. delivery apps, in-store shopping, etc.) Businesses will often need to sum facts by multiple dimensions: 1. The value of products sold store, by product type and by day of week 2. The value of products sold by product and by channel The business objective is to create a data model that can store, and report number of burgers and fries sold from a specific McDonald’s outlet per day
  • 124. Identify the attributes or properties of dimensions We need to know what are the properties or attributes of each dimension that we need to store in our table. This is important since knowing the properties let us decide what columns are required to be created in each dimension table. Each dimension might have number of different properties, but for a given context, not all of them are relevant for us. As an example, let's take the dimension food. We can think of so many different attributes of food - e.g. names of the food, price of the food, total calories in the food, colour of the food and so on. But we need to check which of these attributes are relevant to us - that is - which of these attributes are required for reporting on this data. As for the given statement above, we just need to know only one attribute of the food dimension - i.e. name of the food (burger or fries) The business objective is to create a data model that can store, and report number of burgers and fries sold from a specific McDonald’s outlet per day
  • 127. Approaches to Dimensional Model Star Schema Multiple fact tables share dimension tables, viewed as a collection of stars, therefore called galaxy schema or fact constellation Snowflake Schema Facts Constellation A fact table in the middle connected to a set of dimension tables A refinement of star schema where some dimensional hierarchy is normalized into a set of smaller dimension tables, forming a shape similar to snowflake