SlideShare a Scribd company logo
Accountability, transparency and corruption in global health: the critical role of health metrics and evaluationStephen S LimAssistant Professor of Global Health
2OutlineContextTwo examplesTracking immunization coverageConditional cash transfers to women for delivering in a health facility
3OutlineContextTwo examplesTracking immunization coverageConditional cash transfers to women for delivering in a health facility
Development Assistance (Billions US$) for Health by Institution, 1990, 20074
5Global goals, funders and initiativesGoals1978: Alma-Ata: Primary Health Care and Health for All1984: Universal childhood immunization by 19902000: Millennium Development Goals2003: 3 by 5 – 3 million people on antiretroviral drugs by 20052008: Malaria EliminationPrivate philanthropic organizations2000: Bill and Melinda Gates Foundation2006: Warren Buffet pledged additional US$30 to BMGFGlobal Health Initiatives2000: Global Alliance for Vaccines and Immunizations (GAVI)2002: Global Fund for Aids, Tuberculosis and Malaria (GFATM)2003: US President’s Emergency Plan for AIDS Relief (PEPFAR)2005: US President’s Malaria Initiative (PMI)2007: International Health Partnership (IHP+)
6National health sector reforms and programs2001: Thailand Universal Coverage30 Baht Scheme2003/04: Mexico Health Sector ReformsSystem of Social Protection in Health including Seguro Popular2005: Indian National Rural Health MissionConditional cash transfers for women to give birth in health facilities
Critical role of health metrics and evaluationHigh-quality measurement of health indicators and evaluation of programs is central to issues of transparency and accountabilityAre resources being used effectively? Have initiatives and reforms led to improvements in health system delivery and population health?Mounting pressure from funders, civil society, etc to document this  Economic crisis has led to rising fears that development assistance budgets will be cut 7
8OutlineContextTwo examplesTracking immunization coverageConditional cash transfers to women for delivering in a health facility
9Tracking childhood immunization coverageSubstantial resources have been invested in delivering immunization servicesBasic vaccines, e.g. three-dose diptheria, pertussis and tetanus (DTP3) as well as new vaccines, e.g. HiB, rotavirusGlobal initiatives1984: Universal Childhood Immunization (UCI) by 1990 initiative, defined as 80% immunization coverage1999: Global Alliance on Vaccines and Immunizations (GAVI)Monitoring the extent of immunization delivery is critical for evaluating how effective these investments and initiatives have been
10Tracking childhood immunization coverageGAVI’s Immunization Services Support (ISS) is the funding that aims to increase coverage of basic vaccines such as three-dose diptheria, tetanus and pertussis (DTP3) vaccination. ISS payments are performance-based with funds disbursed in proportion to the number of additional children targeted or reported to receive DTP3.Number of additional children receiving DTP3 is based on official reports from countries to WHO and UNICEF.
11Tracking childhood immunization coverageTwo main questions:What is the trend in the fraction of children receiving three-dose diptheria, tetanus and pertussis vaccination (DTP3 coverage) over the period 1986 to 2006?Do target-oriented initiatives such as universal childhood immunization (UCI) and results-based financing initiatives such as GAVI’s Immunization Services Support (ISS) lead to over-reporting of DTP3 immunization coverage?
12Data sourcesMicro-data from standardized multi-country surveys DHS, MICS, CDCCrude coverage: three DTP vaccinations by maternal recall or card documented, irrespective of vaccine scheduleEstimated for each birth cohort (up to 5 years prior to the survey)225 surveysSurvey reports and WHO/UNICEF database:78 multi-country surveys142 country-specific surveys with sample size reported145 country-specific surveys without sample size reportedAdministrative data estimates based on health service provider registriesReported routinely to WHO and UNICEF since 1990Officially reported estimates since 1980
13Quick review of Immunization Services Support (ISS)Performance-based paymentNumber of additional children reported by countries to have received DTP3Reports largely based on administrative dataBaseline is the year prior to approval of the proposalUS$20 is paid once per additional childData quality audit (DQA) of administrative data system before reward payments commence (from Year 3)
14
15
16
17
18Estimating missing survey coverageTwo purposes:Generate plausible estimates over time to allow monitoring of indicatorsReduce compositional bias in in causal inference that can stem from missing dataWe use validated statistical approaches that areObjectiveReplicableCharacterizes uncertainty
19
20Global trends in DTP3 coverageSurvey-based global coverage of DTP3 (black) with 95% uncertainty estimates compared to countries’ officially reported (red) and WHO and UNICEF estimates (blue), 1986 to 2006.
21Regional trends
22Does ISS lead to over-reporting?Statistical analysis of over-reporting (officially reported coverage minus survey coverage) by years since the GAVI ISS baseline
23GAVI Immunization Services Support (ISS)Number of additional children vaccinated in 51 countries receiving ISS funding up to the year 2006 :Based on official reports: 13.9 millionSurvey-based: 7.3 (5.5 to 9.2) millionISS paymentsBased on official reports: US$289 millionSurvey-based: US$148 millionOver-reporting is not uniform4 countries that reported increases, number of additional children did not increase6 overestimated by > 4x10 overestimated by > 2x but ≤ 4x23 overestimated by > 1x but ≤ 2x8 countries underestimated
24ImplicationsAt the global level, survey-based immunization coverage has increased continuously and gradually over the last 20 yearsReflects time and investment needed to expand health servicesImprovements more pronounced in some regions (e.g. Central, West sub-Saharan Africa) and countries (e.g. Cameroon) during recent time periodTargets and payments for performance such as GAVI’s ISS can incentivize improvements but also lead to over-reportingOver-reporting likely reflects pressures throughout the reporting system to meet targetsMonitoring and evaluation systems need to be based on independent, rigorous, empirical measurements that are robust to these effects
25OutlineContextTwo examplesTracking immunization coverageConditional cash transfers to women for delivering in a health facility
JananiSurakshaYojana – “Safe motherhood scheme”Launched in 2005; 100% centrally fundedGoal: reduce maternal and neonatal mortalityWorks by incentivizing women to deliver in a health facilityImplemented through Accredited Social Health Activists (ASHAs)ASHAs also receive a cash benefitBudget allocation of US$342 million in 2009-1026Accredited Social Health Activist (ASHA)Madhya Pradesh, IndiaPhoto: Department for International Development, UKAID
National guidelines, EligibilityIn 10 high-focus states All pregnant women delivering in government facility or accredited private institutionsOther states & home deliveriesBelow the Poverty Line >19 years of ageFirst two live birthsTargeted to women from scheduled caste or tribe 27
National guidelines, Cash payments281 U.S. dollar ~ 45 Indian Rupees
QuestionsWhat is the level of implementation of JSY at district and state-levels?Is JSY reaching its intended beneficiaries?Does receipt of financial assistance under JSY lead to increased antenatal care and in-facility delivery  and reduced perinatal, neonatal and maternal mortality? 29
DataIndia District-level Household Surveys (DLHS)DLHS-2: ~1,000 households from 593 districts, 2002 to 2004DLHS-3: 1,000 to 1,500 households from 611 districts, late 2007 to early 2009Ever-married women aged 15 to 44, for most recent pregnancyAntenatal care (no. of visits)Delivery care (type of provider, location)Outcome (live birth, still birth, spontaneous or induced abortion)Survival of the child in the case of a live birthReceipt of financial assistance under JSY (DLHS-3)Individual and household characteristics, e.g. asset-based wealth, caste, education, location of residence and distance to facility30
31Births receiving JSY, 2007/08In-facility birth coverage, 2001 to 2003
JSY uptake by socioeconomic indicators, national-level32
33In-facility birth coverage, 2007/08In-facility birth coverage, 2001-2003
Evaluating impact of JSY on coverage and outcomesExact matchingMatch births receiving JSY to those not receiving JSY in DLHS-3Matching covariates: urban/rural residence, BPL card ownership, wealth quintile, caste, education, parity, and maternal age Logistic regression on matched data allows more precise control for confoundersWith-vs-withoutLogistic regression, comparing births receiving JSY to births that did not receive JSY in DLHS-3 and all births in DLHS-2District-level differences-in-differencesCompare districts by level of JSY uptake, controlling for baseline differences (DLHS-2)580 district aggregates from DLHS-2 to DLHS-3.34
OutcomesIntervention coverageAntenatal care with at least three visitsIn-facility birthSkilled birth attendance (in-facility birth or birth outside of a facility with a skilled attendant)MortalityPerinatal death (stillbirth or death up to and including 7 days after a live birth)Neonatal death (death up to and including 1 month after a live birth)Maternal mortality* (death of women aged 15 to 49 during pregnancy or up to 6 weeks after birth or termination)* In district-level analysis only35
Potential confoundersControlled for:maternal age;number of live births;birth interval;single or multiple birth;maternal education;household wealth based on asset ownership; caste/tribe;  religion; and location of residence with respect to distance to the nearest health facilityVaried using district, state-level fixed and random effects36
JSY and intervention coverage, national levelChange in probability of receiving intervention: JSY vs no JSY
Impact on mortality, national levelChange in probability of death: JSY vs no JSY
Variation by State: Intervention coverage
Variation by State: Mortality
ImplicationsVaried uptake of JSY across states; not reaching the very poorIncreases in ANC coverage and intra-partum care coverageLikely reductions in perinatal and stillbirth/neonatal mortalityBut potential quality of care issues in high-focus states indicatesAlternative monitoring approach needed for maternal mortalityContinued monitoring and evaluating the program is critical41
42SummarySubstantial resources are being directed towards improving population healthNeed to track in a valid, reliable and comparable way health indicators and evaluate the impact of programsEnsure that increased resources for health are being utilized intended purpose and are making a difference to the health of populationsIncreasing relevance during a time of global financial crisisIndependent and empirically-based monitoring of health indicators and evaluation of programs

More Related Content

PPTX
Rozier - Immunization
PPTX
The EAT Lancet Publication: Implications for Nutrition Health and Planet
PPTX
Integrated Use of Social and Behaviour Change Interventions Improved Compleme...
PDF
Kohler - Family Planning
PPTX
Cash Transfers and Violence Against Women and Children
PPTX
Some Welfare Consequences of COVID-19 in Ethiopia
PPTX
Rural Social Protection: Economic Inclusion and Resilience
PPTX
The Impact of Zambia's Child Grant Program (CGP) on Child Height
Rozier - Immunization
The EAT Lancet Publication: Implications for Nutrition Health and Planet
Integrated Use of Social and Behaviour Change Interventions Improved Compleme...
Kohler - Family Planning
Cash Transfers and Violence Against Women and Children
Some Welfare Consequences of COVID-19 in Ethiopia
Rural Social Protection: Economic Inclusion and Resilience
The Impact of Zambia's Child Grant Program (CGP) on Child Height

What's hot (16)

PDF
WEBINAR: European Commission Discussion of IFPRI’s 2021 Global Food Policy Re...
PPTX
Ethiopia’s Urban ‘Cash Plus’ Pilot: Health Insurance System Linkages
PDF
An Interrupted Time Series Multivariate Regression Analysis Evaluation of Sta...
PDF
Monitoring household coping strategies during complex crises final
PDF
The impact of the global financial crisis on reproductive and maternal health...
PDF
Cash Transfers, Polygamy & IPV: Experimental evidence from Mali
PPTX
Vital statistics
PDF
2014 decentralisation affected child immunisation gha
PDF
The Role of Health Insurance in UHC: Learning from Ghana and Ethiopia
PDF
711201935
PPTX
Hoeffler - Domestic Violence
PPTX
Direct & Indirect Impacts of an Unconditional Cash Transfer Programme: Zimbab...
PDF
Experience du RDC par Dr Denis Matshifi, SANRU
PDF
2008 Shsop Fin Obstetric Care Vouchers In Cambodia Por &C
PPTX
In search of the holy grail: Can unconditional cash transfers graduate househ...
PPTX
Are malaria elimination efforts on the right tracks ADJE U D PhD, MPH, FPC Pharm
 
WEBINAR: European Commission Discussion of IFPRI’s 2021 Global Food Policy Re...
Ethiopia’s Urban ‘Cash Plus’ Pilot: Health Insurance System Linkages
An Interrupted Time Series Multivariate Regression Analysis Evaluation of Sta...
Monitoring household coping strategies during complex crises final
The impact of the global financial crisis on reproductive and maternal health...
Cash Transfers, Polygamy & IPV: Experimental evidence from Mali
Vital statistics
2014 decentralisation affected child immunisation gha
The Role of Health Insurance in UHC: Learning from Ghana and Ethiopia
711201935
Hoeffler - Domestic Violence
Direct & Indirect Impacts of an Unconditional Cash Transfer Programme: Zimbab...
Experience du RDC par Dr Denis Matshifi, SANRU
2008 Shsop Fin Obstetric Care Vouchers In Cambodia Por &C
In search of the holy grail: Can unconditional cash transfers graduate househ...
Are malaria elimination efforts on the right tracks ADJE U D PhD, MPH, FPC Pharm
 
Ad

Similar to Understanding the Effect of the GAVI Initiative on Reported Vaccination Coverage Levels (20)

PPTX
25_Gabon_PPT_2014_UPDATE_FINAL.pptx
PPTX
34_Iraq_PPT_2014_UPDATE.History of Iraq .pptx
PPTX
Maternal and Child Mortality in the United States
PDF
PDF
Small Data Matter
PPTX
What Happened Since the Child Survival Call to Action_John Borazzo_4.26.13
PDF
Aharona glatman freedman social determinants sept 4-5 2013 -
PDF
Aharona glatman freedman social determinants sept 4-5 2013 -
PPTX
Devendar psm ppt.pptx
PPTX
Infant Mortality Rate in India -Millennium Development Goal
PPT
Effectiveness of Care Groups and Interpersonal Approaches: Evidence and a Res...
PPTX
Innovations in Health Service Evaluation Techniques: Intro
PPT
Lives Saved Analyses for Child Survival Projects: Using LiST to Estimate the ...
PPT
Using li st_to_estimate_impact
PPT
Make them count using the best data for maximum impact
PPTX
The Gavi Investment Opportunity 2021-2025
PPTX
Strategy update: implementation and progress
DOCX
Appendix 3 justification for mdg 5 maf
PDF
EXPANDED PROGRAM ON IMMUNIZATION IN PAKISTAN
PDF
Mission Indradhanush: A Game Changer in India's Journey Toward Universal Immu...
25_Gabon_PPT_2014_UPDATE_FINAL.pptx
34_Iraq_PPT_2014_UPDATE.History of Iraq .pptx
Maternal and Child Mortality in the United States
Small Data Matter
What Happened Since the Child Survival Call to Action_John Borazzo_4.26.13
Aharona glatman freedman social determinants sept 4-5 2013 -
Devendar psm ppt.pptx
Infant Mortality Rate in India -Millennium Development Goal
Effectiveness of Care Groups and Interpersonal Approaches: Evidence and a Res...
Innovations in Health Service Evaluation Techniques: Intro
Lives Saved Analyses for Child Survival Projects: Using LiST to Estimate the ...
Using li st_to_estimate_impact
Make them count using the best data for maximum impact
The Gavi Investment Opportunity 2021-2025
Strategy update: implementation and progress
Appendix 3 justification for mdg 5 maf
EXPANDED PROGRAM ON IMMUNIZATION IN PAKISTAN
Mission Indradhanush: A Game Changer in India's Journey Toward Universal Immu...
Ad

More from UWGlobalHealth (20)

PPT
Captone presentations
PPTX
Civic Engagement
PPT
Global Responsibilities for Health Care
PPTX
Grass without roots
PPT
The Power of Numbers- Communities Use Government Budget Data to Advocate for ...
PPTX
Perspectives and Controversies surrounding human rights
PPT
Politics and Health Reform:Lessons From a Year in Washington, D.C.
PDF
"What Will It Take To Control TB?" Richard Chaisson, MD
PPTX
Health Societal Right100122 Web
PDF
"The Aid Enclave: Mapping and Emerging Geography of Global Health"
PDF
"U.S. Healthcare Reform"
PPT
"The Health System and Aid Effectives: Sudan's Experience"
PPT
"The Spirit Level: Why Greater Equality Makes Societies Stronger"
PPT
IHOP Information Session 2010
PPTX
Mexico Health Reform
PPT
Aid In Mozambique
PPTX
Code of Conduct
PPT
Public, Private Partnerships
PPT
Private Sector Collaboration
PPTX
King Holmes, MD, PhD. University Consortium for Global Health. Sept. 15, 2009.
Captone presentations
Civic Engagement
Global Responsibilities for Health Care
Grass without roots
The Power of Numbers- Communities Use Government Budget Data to Advocate for ...
Perspectives and Controversies surrounding human rights
Politics and Health Reform:Lessons From a Year in Washington, D.C.
"What Will It Take To Control TB?" Richard Chaisson, MD
Health Societal Right100122 Web
"The Aid Enclave: Mapping and Emerging Geography of Global Health"
"U.S. Healthcare Reform"
"The Health System and Aid Effectives: Sudan's Experience"
"The Spirit Level: Why Greater Equality Makes Societies Stronger"
IHOP Information Session 2010
Mexico Health Reform
Aid In Mozambique
Code of Conduct
Public, Private Partnerships
Private Sector Collaboration
King Holmes, MD, PhD. University Consortium for Global Health. Sept. 15, 2009.

Understanding the Effect of the GAVI Initiative on Reported Vaccination Coverage Levels

  • 1. Accountability, transparency and corruption in global health: the critical role of health metrics and evaluationStephen S LimAssistant Professor of Global Health
  • 2. 2OutlineContextTwo examplesTracking immunization coverageConditional cash transfers to women for delivering in a health facility
  • 3. 3OutlineContextTwo examplesTracking immunization coverageConditional cash transfers to women for delivering in a health facility
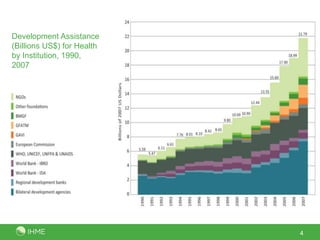
  • 4. Development Assistance (Billions US$) for Health by Institution, 1990, 20074
  • 5. 5Global goals, funders and initiativesGoals1978: Alma-Ata: Primary Health Care and Health for All1984: Universal childhood immunization by 19902000: Millennium Development Goals2003: 3 by 5 – 3 million people on antiretroviral drugs by 20052008: Malaria EliminationPrivate philanthropic organizations2000: Bill and Melinda Gates Foundation2006: Warren Buffet pledged additional US$30 to BMGFGlobal Health Initiatives2000: Global Alliance for Vaccines and Immunizations (GAVI)2002: Global Fund for Aids, Tuberculosis and Malaria (GFATM)2003: US President’s Emergency Plan for AIDS Relief (PEPFAR)2005: US President’s Malaria Initiative (PMI)2007: International Health Partnership (IHP+)
  • 6. 6National health sector reforms and programs2001: Thailand Universal Coverage30 Baht Scheme2003/04: Mexico Health Sector ReformsSystem of Social Protection in Health including Seguro Popular2005: Indian National Rural Health MissionConditional cash transfers for women to give birth in health facilities
  • 7. Critical role of health metrics and evaluationHigh-quality measurement of health indicators and evaluation of programs is central to issues of transparency and accountabilityAre resources being used effectively? Have initiatives and reforms led to improvements in health system delivery and population health?Mounting pressure from funders, civil society, etc to document this Economic crisis has led to rising fears that development assistance budgets will be cut 7
  • 8. 8OutlineContextTwo examplesTracking immunization coverageConditional cash transfers to women for delivering in a health facility
  • 9. 9Tracking childhood immunization coverageSubstantial resources have been invested in delivering immunization servicesBasic vaccines, e.g. three-dose diptheria, pertussis and tetanus (DTP3) as well as new vaccines, e.g. HiB, rotavirusGlobal initiatives1984: Universal Childhood Immunization (UCI) by 1990 initiative, defined as 80% immunization coverage1999: Global Alliance on Vaccines and Immunizations (GAVI)Monitoring the extent of immunization delivery is critical for evaluating how effective these investments and initiatives have been
  • 10. 10Tracking childhood immunization coverageGAVI’s Immunization Services Support (ISS) is the funding that aims to increase coverage of basic vaccines such as three-dose diptheria, tetanus and pertussis (DTP3) vaccination. ISS payments are performance-based with funds disbursed in proportion to the number of additional children targeted or reported to receive DTP3.Number of additional children receiving DTP3 is based on official reports from countries to WHO and UNICEF.
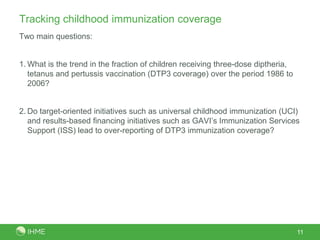
  • 11. 11Tracking childhood immunization coverageTwo main questions:What is the trend in the fraction of children receiving three-dose diptheria, tetanus and pertussis vaccination (DTP3 coverage) over the period 1986 to 2006?Do target-oriented initiatives such as universal childhood immunization (UCI) and results-based financing initiatives such as GAVI’s Immunization Services Support (ISS) lead to over-reporting of DTP3 immunization coverage?
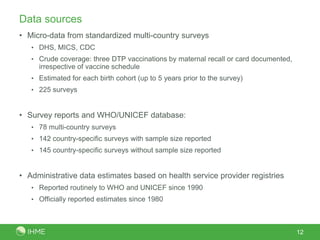
  • 12. 12Data sourcesMicro-data from standardized multi-country surveys DHS, MICS, CDCCrude coverage: three DTP vaccinations by maternal recall or card documented, irrespective of vaccine scheduleEstimated for each birth cohort (up to 5 years prior to the survey)225 surveysSurvey reports and WHO/UNICEF database:78 multi-country surveys142 country-specific surveys with sample size reported145 country-specific surveys without sample size reportedAdministrative data estimates based on health service provider registriesReported routinely to WHO and UNICEF since 1990Officially reported estimates since 1980
  • 13. 13Quick review of Immunization Services Support (ISS)Performance-based paymentNumber of additional children reported by countries to have received DTP3Reports largely based on administrative dataBaseline is the year prior to approval of the proposalUS$20 is paid once per additional childData quality audit (DQA) of administrative data system before reward payments commence (from Year 3)
  • 14. 14
  • 15. 15
  • 16. 16
  • 17. 17
  • 18. 18Estimating missing survey coverageTwo purposes:Generate plausible estimates over time to allow monitoring of indicatorsReduce compositional bias in in causal inference that can stem from missing dataWe use validated statistical approaches that areObjectiveReplicableCharacterizes uncertainty
  • 19. 19
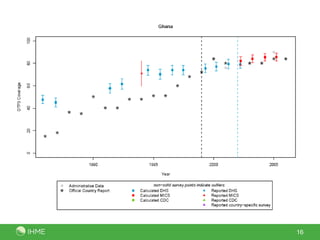
  • 20. 20Global trends in DTP3 coverageSurvey-based global coverage of DTP3 (black) with 95% uncertainty estimates compared to countries’ officially reported (red) and WHO and UNICEF estimates (blue), 1986 to 2006.
  • 22. 22Does ISS lead to over-reporting?Statistical analysis of over-reporting (officially reported coverage minus survey coverage) by years since the GAVI ISS baseline
  • 23. 23GAVI Immunization Services Support (ISS)Number of additional children vaccinated in 51 countries receiving ISS funding up to the year 2006 :Based on official reports: 13.9 millionSurvey-based: 7.3 (5.5 to 9.2) millionISS paymentsBased on official reports: US$289 millionSurvey-based: US$148 millionOver-reporting is not uniform4 countries that reported increases, number of additional children did not increase6 overestimated by > 4x10 overestimated by > 2x but ≤ 4x23 overestimated by > 1x but ≤ 2x8 countries underestimated
  • 24. 24ImplicationsAt the global level, survey-based immunization coverage has increased continuously and gradually over the last 20 yearsReflects time and investment needed to expand health servicesImprovements more pronounced in some regions (e.g. Central, West sub-Saharan Africa) and countries (e.g. Cameroon) during recent time periodTargets and payments for performance such as GAVI’s ISS can incentivize improvements but also lead to over-reportingOver-reporting likely reflects pressures throughout the reporting system to meet targetsMonitoring and evaluation systems need to be based on independent, rigorous, empirical measurements that are robust to these effects
  • 25. 25OutlineContextTwo examplesTracking immunization coverageConditional cash transfers to women for delivering in a health facility
  • 26. JananiSurakshaYojana – “Safe motherhood scheme”Launched in 2005; 100% centrally fundedGoal: reduce maternal and neonatal mortalityWorks by incentivizing women to deliver in a health facilityImplemented through Accredited Social Health Activists (ASHAs)ASHAs also receive a cash benefitBudget allocation of US$342 million in 2009-1026Accredited Social Health Activist (ASHA)Madhya Pradesh, IndiaPhoto: Department for International Development, UKAID
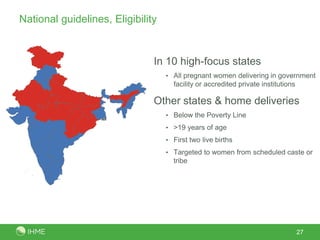
  • 27. National guidelines, EligibilityIn 10 high-focus states All pregnant women delivering in government facility or accredited private institutionsOther states & home deliveriesBelow the Poverty Line >19 years of ageFirst two live birthsTargeted to women from scheduled caste or tribe 27
  • 28. National guidelines, Cash payments281 U.S. dollar ~ 45 Indian Rupees
  • 29. QuestionsWhat is the level of implementation of JSY at district and state-levels?Is JSY reaching its intended beneficiaries?Does receipt of financial assistance under JSY lead to increased antenatal care and in-facility delivery and reduced perinatal, neonatal and maternal mortality? 29
  • 30. DataIndia District-level Household Surveys (DLHS)DLHS-2: ~1,000 households from 593 districts, 2002 to 2004DLHS-3: 1,000 to 1,500 households from 611 districts, late 2007 to early 2009Ever-married women aged 15 to 44, for most recent pregnancyAntenatal care (no. of visits)Delivery care (type of provider, location)Outcome (live birth, still birth, spontaneous or induced abortion)Survival of the child in the case of a live birthReceipt of financial assistance under JSY (DLHS-3)Individual and household characteristics, e.g. asset-based wealth, caste, education, location of residence and distance to facility30
  • 31. 31Births receiving JSY, 2007/08In-facility birth coverage, 2001 to 2003
  • 32. JSY uptake by socioeconomic indicators, national-level32
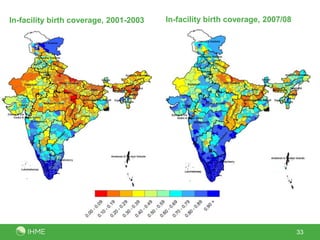
  • 33. 33In-facility birth coverage, 2007/08In-facility birth coverage, 2001-2003
  • 34. Evaluating impact of JSY on coverage and outcomesExact matchingMatch births receiving JSY to those not receiving JSY in DLHS-3Matching covariates: urban/rural residence, BPL card ownership, wealth quintile, caste, education, parity, and maternal age Logistic regression on matched data allows more precise control for confoundersWith-vs-withoutLogistic regression, comparing births receiving JSY to births that did not receive JSY in DLHS-3 and all births in DLHS-2District-level differences-in-differencesCompare districts by level of JSY uptake, controlling for baseline differences (DLHS-2)580 district aggregates from DLHS-2 to DLHS-3.34
  • 35. OutcomesIntervention coverageAntenatal care with at least three visitsIn-facility birthSkilled birth attendance (in-facility birth or birth outside of a facility with a skilled attendant)MortalityPerinatal death (stillbirth or death up to and including 7 days after a live birth)Neonatal death (death up to and including 1 month after a live birth)Maternal mortality* (death of women aged 15 to 49 during pregnancy or up to 6 weeks after birth or termination)* In district-level analysis only35
  • 36. Potential confoundersControlled for:maternal age;number of live births;birth interval;single or multiple birth;maternal education;household wealth based on asset ownership; caste/tribe; religion; and location of residence with respect to distance to the nearest health facilityVaried using district, state-level fixed and random effects36
  • 37. JSY and intervention coverage, national levelChange in probability of receiving intervention: JSY vs no JSY
  • 38. Impact on mortality, national levelChange in probability of death: JSY vs no JSY
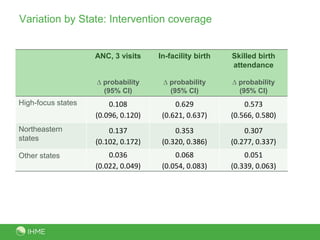
  • 39. Variation by State: Intervention coverage
  • 41. ImplicationsVaried uptake of JSY across states; not reaching the very poorIncreases in ANC coverage and intra-partum care coverageLikely reductions in perinatal and stillbirth/neonatal mortalityBut potential quality of care issues in high-focus states indicatesAlternative monitoring approach needed for maternal mortalityContinued monitoring and evaluating the program is critical41
  • 42. 42SummarySubstantial resources are being directed towards improving population healthNeed to track in a valid, reliable and comparable way health indicators and evaluate the impact of programsEnsure that increased resources for health are being utilized intended purpose and are making a difference to the health of populationsIncreasing relevance during a time of global financial crisisIndependent and empirically-based monitoring of health indicators and evaluation of programs

Editor's Notes

  • #27: Skilled birth attendance (SBA) coverage improved from 33% in 1990 to 48% in 2005Maternal mortality ratio declined from around 500 per 100,000 live births in 1990 to around 260 in 2005Neonatal mortality rate decreased from 54 per 1,000 live births in 1990 to 29 in 2005
  • #29: ASHA = Accredited Social Health Activist1400 INR = ~31 dollars, 1000 INR = ~22 USD, 500 INR= ~11 USD, 200 INR = ~4.4 USD600 INR = ~13 dollars
  • #38: Consistent results across three analytical approachesTranslation: For every 10 women receiving JSY, 1 additional woman will complete 3 ANC visits, 4 to 5 additional women will give birth in-facility, 3 to 4 women will give birth in a facility or with a skilled attendant
  • #39: Less consistent results across three analytical approaches for mortality impacts. Individual level analysis suggest reduction of around 3 to 6 perinatal deaths per 1,000 births for every woman receiving JSY; similar magnitude for still birth or neonatal mortality. District-level results suggest larger effects but are not significantly different from zero change for perinatal, stillbirth/neonatal mortality. We also see no effect on maternal mortality. Two possible explanations:Small numbers problem in the district-level numbers. District analysis removes bias associated with selective uptake of JSY that the individual-level analyses are not controlling for. Given the consistent results across the three analytical approaches for intervention coverage that is not prone to small numbers problems we think the former is more likely but cannot say definitively. Maternal mortality a big problem – need an alternative approach to measure impact
  • #40: Much larger effects for in-facility birth/SBA in high-focus states, compared to north-east states compared to other states
  • #41: Examining differences by high-focus states vs other states shows smaller effects in high-focus states compared to other states. Two possible explanations:Different targeting of women in high-focus compared to non-high-focus states. In high-focus states all women are eligible for JSY, whereas in non-high-focus states only women living below the poverty line are eligible. As a result, the former group may include lower risk women where the benefit of the program may be smaller. Another possible explanation is that high-focus states have lower quality of obstetric care or are less likely to be able to cope with the increased workloads that have resulted from the large increases of in-facility deliveries due to JSY.