SlideShare a Scribd company logo
"Apprentissage non supervisé" de la
       théorie à la pratique


      Miguel Arturo Barreto Sánz
Outline
● Introduction

 The unsupervised learning


● The   Self-Organizing Map
 The biological inspiration
 The algorithm
 Characteristics
 Examples


● Practical   examples using MATLAB


                              1
Introduction
Unsupervised learning is a way to form “natural groupings”
or clusters of patterns.

Unsupervised learning seeks to determine how the data are
organized.

It is distinguished from supervised learning in that the
learner is given only unlabeled examples.
.
Among neural network models, the Self-Organizing Map
(SOM) are commonly used unsupervised learning
algorithms.

The SOM is a topographic organization in which nearby
locations in the map represent inputs with similar properties.


                          2
The Self-Organizing Map
               The biological inspiration

                    Sensory information is processed in the
                    neocortex by highly ordered neuronal
                    networks.

                    • Tangential to the cortical surface,
W. Penfield         representations of the sensory periphery
                    are organized into well-ordered maps.

                    • Taste maps in gustatory cortex (Accolla
                    et al., 2007)

                    • Somatotopic maps in primary
                    somatosensory cortex (Kaas, 1991).

                             3
The Self-Organizing Map
 The biological inspiration

                Other prominent cortical maps
                are the tonotopic organization
                of auditory cortex (Kalatsky et
                al., 2005),


                The most intensely studied
                example is the primary visual
                cortex, which is arranged with
                superimposed maps of
                retinotopy, ocular dominance
                and orientation (Bonhoeffer
                and Grinvald, 1991).
            4
The Self-Organizing Map
 The biological inspiration


                       Humunculus


            5
The Self-Organizing Map
         The biological inspiration


Somatosensory cortex dominated by the representation
of teeth in the naked mole-rat brain
Kenneth C. Catania, and Michael S. Remple.


                                        6
The Self-Organizing Map
      The biological inspiration


A remarkably high degree of organization is obvious in the
primary somatosensory cortex, in which a clear pattern of
cytoarchitectonic units termed ‘barrels’ are observed in
perfect match with the arrangement of the whiskers on the
snout of the mouse (Woolsey and Van der Loos, 1970)
                         7
The Self-Organizing Map
  The biological inspiration


Mapping functionally related sensory
information onto nearby cortical regions is
thought to minimize axonal wiring length and
simplify the synaptic circuits underlying
correlation-based associational plasticity.


                  8
The Self-Organizing Map

                In a topology-preserving map, units located physically
                next to each other will respond to classes of input vectors
                that are likewise next to each other.

                Although it is easy to visualize units next to each other in a
Teuvo Kohonen
                two-dimensional array, it is not so easy to determine
                which classes of vectors are next to each other in a high-
                dimensional space.

                Large-dimensional input vectors are, in a sense, projected
                down on the two dimensional map in a way that maintains
                the natural order of the input vectors.

                This dimensional reduction could allow us to visualize
                 easily important relationships among the data that
                 otherwise might go unnoticed.
                                     9
The Self-Organizing Map

A SOM is formed of neurons located on a
regular, usually 1- or 2-dimensional grid.

The neurons are connected to adjacent
neurons by a neighborhood relation
dictating the structure of the map.

In the 2-dimensional case the neurons of
the map can be arranged either on a
rectangular or a hexagonal lattice

 2                        2
     1                     1
                               0             Input   Input
         0


                                   10
The algorithm
The weights of the neurons
are initialized
                   t=0


                             2
The algorithm


Example
          2
The algorithm
The training utilizes               BMU
competitive learning.

The neuron with weight
vector most similar to the
input is called the best
matching unit (BMU).

The weights of the BMU
and neurons close to it in
the SOM lattice are
adjusted towards the
input vector.

The magnitude of the
change decreases with
time and with distance
from the BMU.
                             2
The algorithm


Next example


               2
The algorithm


     2
The algorithm


     2
The algorithm


     2
Characteristics


Inputs: State of health,   Quality of life word map
nutrition, educational
services etc.

                               2
Characteristics
    Input 3 Dimentions             Output 2 dimentions


      z


                x
                                                 x
y

                                                         y


                               2
Visualization


      2
2
Introduction


     2
Visualization


      2
Clusters of sites with similar
                   characteristics

  Soil     What crops or varieties are likely to perform well where and
           when.


Climate


Genotype


                     Homologues places for Colombian coffee production.
                     Brazil, Equator, East Africa, and New Guinea.
                                   14
                                   2
Clusters of sites with similar
           characteristics

For commercial (mass production) crops (rice, corn) it is known the
“when” and “where”

For native crops (guanabana, lulo) or special types of crops (coffee
varieties) it is not the case.

                     When and what I must cultivate ?
                     Market demand


                                               DAPA
                                               (Diversification
                                               Agriculture Project
                 The COCH project              Alliance)


                             16
                             2
1. Large database
                           The challenges
2. Multivariable problem
                                              1 point

                                                        1 Km


                                               1 Km


                                            1 336,025 points


                                 2
The challenges
                               Introduction
   1. Large datasets
   2. Multivariate problem
   Climate, management, variety, climate estimates, soil etc.

   Example. BIOCLIM is a bioclimatic prediction system which uses surrogate
   terms (bioclimatic parameters) derived from mean monthly climate
   estimates, to approximate energy and water balances at a given location

B1. Annual Mean Temperature                              B11. Mean Temperature of Coldest Quarter
B2. Mean Diurnal Range(Mean(period max-min))             B12. Annual Precipitation
B3. Isothermality (P2/P7)                                B13. Precipitation of Wettest Period
B4. Temperature Seasonality (Coefficient of Variation)   B14. Precipitation of Driest Period
B5. Max Temperature of Warmest Period                    B15. Precipitation Seasonality
B6. Min Temperature of Coldest Period                    (Coefficient of Variation)
B7. Temperature Annual Range (P5-P6)                     B16. Precipitation of Wettest Quarter
B8. Mean Temperature of Wettest Quarter                  B17. Precipitation of Driest Quarter
B9. Mean Temperature of Driest Quarter                   B18. Precipitation of Warmest Quarter
B10. Mean Temperature of Warmest Quarter                 B19. Precipitation of Coldest Quarter


                                               2
Clusters of sites with similar
                   characteristics
How to work ?
How to obtain Prototypes, Clustering and Visualization at the same
time ?

Approach
Unsupervised learning
Self-organizing maps

Two flavors of SOMs

Self-organizing maps                       Growing hierarchical map
Static map – Just one representation       Different representations to different levels


                                       2
Clusters of sites with similar
                        characteristics
Self-Organizing Map (SOM)


                                           The clusters found in the
                                           feature space in many
                                           cases are not the same as
                                           those found in geographic
                                           space.

                                           Represent clusters of a
                                           multidimensional space:
                                           map multidimensional data
                                           onto a two-dimensional
                                           lattice of cells.

                                         Similarity of sugarcane
                                         growing environmental
                                         conditions (1999-2005)
                                         using Self-organizing

                                2        maps
                                    29
Approaches
 GHSOM
             P


    2
P1. Annual Mean Temperature
                       P2. Mean Diurnal Range(Mean(period max-min))


            Introduction
                       P3. Isothermality (P2/P7)
                       P4. Temperature Seasonality (Coefficient of Variation)
                       P5. Max Temperature of Warmest Period
                       P6. Min Temperature of Coldest Period
                       P7. Temperature Annual Range (P5-P6)
                       P8. Mean Temperature of Wettest Quarter
                       P9. Mean Temperature of Driest Quarter
                       P10. Mean Temperature of Warmest Quarter
                       P11. Mean Temperature of Coldest Quarter
                       P12. Annual Precipitation
                       P13. Precipitation of Wettest Period
                       P14. Precipitation of Driest Period
                       P15. Precipitation Seasonality(Coefficient of Variation)
                       P16. Precipitation of Wettest Quarter
                       P17. Precipitation of Driest Quarter
                       P18. Precipitation of Warmest Quarter
                       P19. Precipitation of Coldest Quarter


GHSOM
Component
planes


                 2
Merci !

More Related Content

What's hot (20)

PPTX
Register transfer language
Sanjeev Patel
 
PDF
Fuzzy Logic in the Real World
BCSLeicester
 
PPT
backpropagation in neural networks
Akash Goel
 
PPTX
Media Access Control (MAC Layer)
Meenakshi Paul
 
PPT
Artificial neural network
mustafa aadel
 
PPTX
Switch networking
MohikaJamadari
 
PPT
Selective repeat protocol
Manusha Dilan
 
PPTX
hopfield neural network
Abhishikha Sinha
 
PPTX
Density based clustering
YaswanthHariKumarVud
 
PPTX
Input - Output Organization and I/O Interface
kasthurimukila
 
PPTX
Communication costs in parallel machines
Syed Zaid Irshad
 
PPTX
Multiprocessor architecture
Arpan Baishya
 
PPTX
14_cnn complete.pptx
FaizanNadeem10
 
PPT
1619 quantum computing
Dr Fereidoun Dejahang
 
PPTX
Information theory
AparnaLal2
 
PPTX
Solutions to byzantine agreement problem
AJAY KHARAT
 
PPTX
Grid based method & model based clustering method
rajshreemuthiah
 
PPTX
Convolutional Neural Network (CNN)of Deep Learning
alihassaah1994
 
PDF
Unit 4 data link layer
mekind
 
PPTX
Evaluation of multilabel multi class classification
Sridhar Nomula
 
Register transfer language
Sanjeev Patel
 
Fuzzy Logic in the Real World
BCSLeicester
 
backpropagation in neural networks
Akash Goel
 
Media Access Control (MAC Layer)
Meenakshi Paul
 
Artificial neural network
mustafa aadel
 
Switch networking
MohikaJamadari
 
Selective repeat protocol
Manusha Dilan
 
hopfield neural network
Abhishikha Sinha
 
Density based clustering
YaswanthHariKumarVud
 
Input - Output Organization and I/O Interface
kasthurimukila
 
Communication costs in parallel machines
Syed Zaid Irshad
 
Multiprocessor architecture
Arpan Baishya
 
14_cnn complete.pptx
FaizanNadeem10
 
1619 quantum computing
Dr Fereidoun Dejahang
 
Information theory
AparnaLal2
 
Solutions to byzantine agreement problem
AJAY KHARAT
 
Grid based method & model based clustering method
rajshreemuthiah
 
Convolutional Neural Network (CNN)of Deep Learning
alihassaah1994
 
Unit 4 data link layer
mekind
 
Evaluation of multilabel multi class classification
Sridhar Nomula
 

Viewers also liked (20)

PDF
Self-Organising Maps for Customer Segmentation using R - Shane Lynn - Dublin R
shanelynn
 
PPTX
Self-organizing map
Tarat Diloksawatdikul
 
PPTX
Kohonen self organizing maps
raphaelkiminya
 
PPT
Sefl Organizing Map
Nguyen Van Chuc
 
PDF
Neural Networks: Self-Organizing Maps (SOM)
Mostafa G. M. Mostafa
 
PPT
Neural networks Self Organizing Map by Engr. Edgar Carrillo II
Edgar Carrillo
 
PDF
Customer Clustering For Retail Marketing
Jonathan Sedar
 
PPTX
Dimension Reduction And Visualization Of Large High Dimensional Data Via Inte...
wl820609
 
PDF
Artificial neural networks
stellajoseph
 
PPT
Cluster analysis for market segmentation
Vishal Tandel
 
PDF
MATLAB IMPLEMENTATION OF SELF-ORGANIZING MAPS FOR CLUSTERING OF REMOTE SENSIN...
Daksh Raj Chopra
 
PPTX
Application of Clustering in Data Science using Real-life Examples
Edureka!
 
PDF
Cluster Analysis for Dummies
Venkata Reddy Konasani
 
PPTX
The Transformation of Systems Biology Into A Large Data Science
Robert Grossman
 
PPTX
Intrusion Detection Model using Self Organizing Maps.
Tushar Shinde
 
PDF
Neural network-toolbox
angeltejera
 
DOC
Intro matlab-nn
soldier78
 
PPT
learning Vector Quantization LVQ2 LVQ3
ESCOM
 
PDF
project_report
Ejaz Navas
 
PPTX
Matlab Neural Network Toolbox
AliMETN
 
Self-Organising Maps for Customer Segmentation using R - Shane Lynn - Dublin R
shanelynn
 
Self-organizing map
Tarat Diloksawatdikul
 
Kohonen self organizing maps
raphaelkiminya
 
Sefl Organizing Map
Nguyen Van Chuc
 
Neural Networks: Self-Organizing Maps (SOM)
Mostafa G. M. Mostafa
 
Neural networks Self Organizing Map by Engr. Edgar Carrillo II
Edgar Carrillo
 
Customer Clustering For Retail Marketing
Jonathan Sedar
 
Dimension Reduction And Visualization Of Large High Dimensional Data Via Inte...
wl820609
 
Artificial neural networks
stellajoseph
 
Cluster analysis for market segmentation
Vishal Tandel
 
MATLAB IMPLEMENTATION OF SELF-ORGANIZING MAPS FOR CLUSTERING OF REMOTE SENSIN...
Daksh Raj Chopra
 
Application of Clustering in Data Science using Real-life Examples
Edureka!
 
Cluster Analysis for Dummies
Venkata Reddy Konasani
 
The Transformation of Systems Biology Into A Large Data Science
Robert Grossman
 
Intrusion Detection Model using Self Organizing Maps.
Tushar Shinde
 
Neural network-toolbox
angeltejera
 
Intro matlab-nn
soldier78
 
learning Vector Quantization LVQ2 LVQ3
ESCOM
 
project_report
Ejaz Navas
 
Matlab Neural Network Toolbox
AliMETN
 
Ad

Similar to Self-organizing maps - Tutorial (20)

PPT
Bio inspired computational techniques applied to the analysis and visualizati...
askroll
 
DOC
Data Mining Assignment Sample Online - PDF
Ajeet Singh
 
PDF
Implementing kohonen's som with missing data in OTB
melaneum
 
PDF
Migue final presentation_v28
askroll
 
PDF
Machine_Learning_Project_Report
Aditya Hendra
 
PPT
Improving the correlation hunting in a large quantity of SOM component planes
askroll
 
PDF
10.1.1.29.5089
Ahmet Yarımçam
 
PDF
Geographic Information: Aspects of Phenomenology and Cognition
Robert (Bob) Williams
 
PDF
Intrusion Detection System Using Self Organizing Map Algorithms
Editor IJCATR
 
PDF
Image Morphing: A Literature Study
Editor IJCATR
 
PDF
Intrusion Detection System Using Self Organizing Map Algorithms
Editor IJCATR
 
PDF
Budthimedhee - Input2012
INPUT 2012
 
PDF
Van hulle springer:som
ArchiLab 7
 
PDF
KCS-055 MLT U4.pdf
Dr. Radhey Shyam
 
PDF
Algortimos bio-inspirados para clustering y visualizacion de datos geoespaciales
askroll
 
PPTX
Self-organzing maps in Earth Observation Data Cube Analysis
Lorena Santos
 
KEY
20090521 Dv Brief
Dave Vieglais
 
PDF
Map as a Service: A Framework for Visualising and Maximising Information Retu...
M H
 
PPT
Research Data Sharing LERU
LIBER Europe
 
Bio inspired computational techniques applied to the analysis and visualizati...
askroll
 
Data Mining Assignment Sample Online - PDF
Ajeet Singh
 
Implementing kohonen's som with missing data in OTB
melaneum
 
Migue final presentation_v28
askroll
 
Machine_Learning_Project_Report
Aditya Hendra
 
Improving the correlation hunting in a large quantity of SOM component planes
askroll
 
10.1.1.29.5089
Ahmet Yarımçam
 
Geographic Information: Aspects of Phenomenology and Cognition
Robert (Bob) Williams
 
Intrusion Detection System Using Self Organizing Map Algorithms
Editor IJCATR
 
Image Morphing: A Literature Study
Editor IJCATR
 
Intrusion Detection System Using Self Organizing Map Algorithms
Editor IJCATR
 
Budthimedhee - Input2012
INPUT 2012
 
Van hulle springer:som
ArchiLab 7
 
KCS-055 MLT U4.pdf
Dr. Radhey Shyam
 
Algortimos bio-inspirados para clustering y visualizacion de datos geoespaciales
askroll
 
Self-organzing maps in Earth Observation Data Cube Analysis
Lorena Santos
 
20090521 Dv Brief
Dave Vieglais
 
Map as a Service: A Framework for Visualising and Maximising Information Retu...
M H
 
Research Data Sharing LERU
LIBER Europe
 
Ad

More from askroll (7)

PDF
Microsoft power point curso-2006_sesion2_kohonen
askroll
 
PPT
Fuzzy Growing Hierarchical Self-organizing Networks
askroll
 
PPT
Classification of similar productivity zones in the sugar cane culture using ...
askroll
 
PPT
Mapas de Kohonen como una herramienta visual de apoyo al soporte de decisione...
askroll
 
PPT
Curso 2006 Sesion 1 Kohonen
askroll
 
PPT
The COCH project
askroll
 
PDF
Bio-inspired techniques and their application to precision agriculture (Andre...
askroll
 
Microsoft power point curso-2006_sesion2_kohonen
askroll
 
Fuzzy Growing Hierarchical Self-organizing Networks
askroll
 
Classification of similar productivity zones in the sugar cane culture using ...
askroll
 
Mapas de Kohonen como una herramienta visual de apoyo al soporte de decisione...
askroll
 
Curso 2006 Sesion 1 Kohonen
askroll
 
The COCH project
askroll
 
Bio-inspired techniques and their application to precision agriculture (Andre...
askroll
 

Recently uploaded (20)

PPTX
AI Penetration Testing Essentials: A Cybersecurity Guide for 2025
defencerabbit Team
 
PDF
Complete JavaScript Notes: From Basics to Advanced Concepts.pdf
haydendavispro
 
PDF
Achieving Consistent and Reliable AI Code Generation - Medusa AI
medusaaico
 
PDF
LLMs.txt: Easily Control How AI Crawls Your Site
Keploy
 
PDF
NewMind AI - Journal 100 Insights After The 100th Issue
NewMind AI
 
PDF
Bitcoin for Millennials podcast with Bram, Power Laws of Bitcoin
Stephen Perrenod
 
PPTX
From Sci-Fi to Reality: Exploring AI Evolution
Svetlana Meissner
 
PPTX
OpenID AuthZEN - Analyst Briefing July 2025
David Brossard
 
PPTX
Webinar: Introduction to LF Energy EVerest
DanBrown980551
 
PDF
Building Real-Time Digital Twins with IBM Maximo & ArcGIS Indoors
Safe Software
 
PDF
HubSpot Main Hub: A Unified Growth Platform
Jaswinder Singh
 
PDF
Exolore The Essential AI Tools in 2025.pdf
Srinivasan M
 
PDF
The Builder’s Playbook - 2025 State of AI Report.pdf
jeroen339954
 
PPTX
UiPath Academic Alliance Educator Panels: Session 2 - Business Analyst Content
DianaGray10
 
PDF
CIFDAQ Token Spotlight for 9th July 2025
CIFDAQ
 
PPTX
WooCommerce Workshop: Bring Your Laptop
Laura Hartwig
 
PDF
Newgen 2022-Forrester Newgen TEI_13 05 2022-The-Total-Economic-Impact-Newgen-...
darshakparmar
 
PDF
Smart Trailers 2025 Update with History and Overview
Paul Menig
 
PPTX
"Autonomy of LLM Agents: Current State and Future Prospects", Oles` Petriv
Fwdays
 
PDF
CIFDAQ Weekly Market Wrap for 11th July 2025
CIFDAQ
 
AI Penetration Testing Essentials: A Cybersecurity Guide for 2025
defencerabbit Team
 
Complete JavaScript Notes: From Basics to Advanced Concepts.pdf
haydendavispro
 
Achieving Consistent and Reliable AI Code Generation - Medusa AI
medusaaico
 
LLMs.txt: Easily Control How AI Crawls Your Site
Keploy
 
NewMind AI - Journal 100 Insights After The 100th Issue
NewMind AI
 
Bitcoin for Millennials podcast with Bram, Power Laws of Bitcoin
Stephen Perrenod
 
From Sci-Fi to Reality: Exploring AI Evolution
Svetlana Meissner
 
OpenID AuthZEN - Analyst Briefing July 2025
David Brossard
 
Webinar: Introduction to LF Energy EVerest
DanBrown980551
 
Building Real-Time Digital Twins with IBM Maximo & ArcGIS Indoors
Safe Software
 
HubSpot Main Hub: A Unified Growth Platform
Jaswinder Singh
 
Exolore The Essential AI Tools in 2025.pdf
Srinivasan M
 
The Builder’s Playbook - 2025 State of AI Report.pdf
jeroen339954
 
UiPath Academic Alliance Educator Panels: Session 2 - Business Analyst Content
DianaGray10
 
CIFDAQ Token Spotlight for 9th July 2025
CIFDAQ
 
WooCommerce Workshop: Bring Your Laptop
Laura Hartwig
 
Newgen 2022-Forrester Newgen TEI_13 05 2022-The-Total-Economic-Impact-Newgen-...
darshakparmar
 
Smart Trailers 2025 Update with History and Overview
Paul Menig
 
"Autonomy of LLM Agents: Current State and Future Prospects", Oles` Petriv
Fwdays
 
CIFDAQ Weekly Market Wrap for 11th July 2025
CIFDAQ
 

Self-organizing maps - Tutorial

  • 1. "Apprentissage non supervisé" de la théorie à la pratique Miguel Arturo Barreto Sánz
  • 2. Outline ● Introduction The unsupervised learning ● The Self-Organizing Map The biological inspiration The algorithm Characteristics Examples ● Practical examples using MATLAB 1
  • 3. Introduction Unsupervised learning is a way to form “natural groupings” or clusters of patterns. Unsupervised learning seeks to determine how the data are organized. It is distinguished from supervised learning in that the learner is given only unlabeled examples. . Among neural network models, the Self-Organizing Map (SOM) are commonly used unsupervised learning algorithms. The SOM is a topographic organization in which nearby locations in the map represent inputs with similar properties. 2
  • 4. The Self-Organizing Map The biological inspiration Sensory information is processed in the neocortex by highly ordered neuronal networks. • Tangential to the cortical surface, W. Penfield representations of the sensory periphery are organized into well-ordered maps. • Taste maps in gustatory cortex (Accolla et al., 2007) • Somatotopic maps in primary somatosensory cortex (Kaas, 1991). 3
  • 5. The Self-Organizing Map The biological inspiration Other prominent cortical maps are the tonotopic organization of auditory cortex (Kalatsky et al., 2005), The most intensely studied example is the primary visual cortex, which is arranged with superimposed maps of retinotopy, ocular dominance and orientation (Bonhoeffer and Grinvald, 1991). 4
  • 6. The Self-Organizing Map The biological inspiration Humunculus 5
  • 7. The Self-Organizing Map The biological inspiration Somatosensory cortex dominated by the representation of teeth in the naked mole-rat brain Kenneth C. Catania, and Michael S. Remple. 6
  • 8. The Self-Organizing Map The biological inspiration A remarkably high degree of organization is obvious in the primary somatosensory cortex, in which a clear pattern of cytoarchitectonic units termed ‘barrels’ are observed in perfect match with the arrangement of the whiskers on the snout of the mouse (Woolsey and Van der Loos, 1970) 7
  • 9. The Self-Organizing Map The biological inspiration Mapping functionally related sensory information onto nearby cortical regions is thought to minimize axonal wiring length and simplify the synaptic circuits underlying correlation-based associational plasticity. 8
  • 10. The Self-Organizing Map In a topology-preserving map, units located physically next to each other will respond to classes of input vectors that are likewise next to each other. Although it is easy to visualize units next to each other in a Teuvo Kohonen two-dimensional array, it is not so easy to determine which classes of vectors are next to each other in a high- dimensional space. Large-dimensional input vectors are, in a sense, projected down on the two dimensional map in a way that maintains the natural order of the input vectors. This dimensional reduction could allow us to visualize easily important relationships among the data that otherwise might go unnoticed. 9
  • 11. The Self-Organizing Map A SOM is formed of neurons located on a regular, usually 1- or 2-dimensional grid. The neurons are connected to adjacent neurons by a neighborhood relation dictating the structure of the map. In the 2-dimensional case the neurons of the map can be arranged either on a rectangular or a hexagonal lattice 2 2 1 1 0 Input Input 0 10
  • 12. The algorithm The weights of the neurons are initialized t=0 2
  • 14. The algorithm The training utilizes BMU competitive learning. The neuron with weight vector most similar to the input is called the best matching unit (BMU). The weights of the BMU and neurons close to it in the SOM lattice are adjusted towards the input vector. The magnitude of the change decreases with time and with distance from the BMU. 2
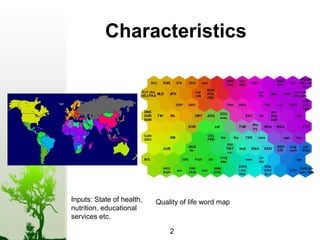
  • 19. Characteristics Inputs: State of health, Quality of life word map nutrition, educational services etc. 2
  • 20. Characteristics Input 3 Dimentions Output 2 dimentions z x x y y 2
  • 22. 2
  • 25. Clusters of sites with similar characteristics Soil What crops or varieties are likely to perform well where and when. Climate Genotype Homologues places for Colombian coffee production. Brazil, Equator, East Africa, and New Guinea. 14 2
  • 26. Clusters of sites with similar characteristics For commercial (mass production) crops (rice, corn) it is known the “when” and “where” For native crops (guanabana, lulo) or special types of crops (coffee varieties) it is not the case. When and what I must cultivate ? Market demand DAPA (Diversification Agriculture Project The COCH project Alliance) 16 2
  • 27. 1. Large database The challenges 2. Multivariable problem 1 point 1 Km 1 Km 1 336,025 points 2
  • 28. The challenges Introduction 1. Large datasets 2. Multivariate problem Climate, management, variety, climate estimates, soil etc. Example. BIOCLIM is a bioclimatic prediction system which uses surrogate terms (bioclimatic parameters) derived from mean monthly climate estimates, to approximate energy and water balances at a given location B1. Annual Mean Temperature B11. Mean Temperature of Coldest Quarter B2. Mean Diurnal Range(Mean(period max-min)) B12. Annual Precipitation B3. Isothermality (P2/P7) B13. Precipitation of Wettest Period B4. Temperature Seasonality (Coefficient of Variation) B14. Precipitation of Driest Period B5. Max Temperature of Warmest Period B15. Precipitation Seasonality B6. Min Temperature of Coldest Period (Coefficient of Variation) B7. Temperature Annual Range (P5-P6) B16. Precipitation of Wettest Quarter B8. Mean Temperature of Wettest Quarter B17. Precipitation of Driest Quarter B9. Mean Temperature of Driest Quarter B18. Precipitation of Warmest Quarter B10. Mean Temperature of Warmest Quarter B19. Precipitation of Coldest Quarter 2
  • 29. Clusters of sites with similar characteristics How to work ? How to obtain Prototypes, Clustering and Visualization at the same time ? Approach Unsupervised learning Self-organizing maps Two flavors of SOMs Self-organizing maps Growing hierarchical map Static map – Just one representation Different representations to different levels 2
  • 30. Clusters of sites with similar characteristics Self-Organizing Map (SOM) The clusters found in the feature space in many cases are not the same as those found in geographic space. Represent clusters of a multidimensional space: map multidimensional data onto a two-dimensional lattice of cells. Similarity of sugarcane growing environmental conditions (1999-2005) using Self-organizing 2 maps 29
  • 32. P1. Annual Mean Temperature P2. Mean Diurnal Range(Mean(period max-min)) Introduction P3. Isothermality (P2/P7) P4. Temperature Seasonality (Coefficient of Variation) P5. Max Temperature of Warmest Period P6. Min Temperature of Coldest Period P7. Temperature Annual Range (P5-P6) P8. Mean Temperature of Wettest Quarter P9. Mean Temperature of Driest Quarter P10. Mean Temperature of Warmest Quarter P11. Mean Temperature of Coldest Quarter P12. Annual Precipitation P13. Precipitation of Wettest Period P14. Precipitation of Driest Period P15. Precipitation Seasonality(Coefficient of Variation) P16. Precipitation of Wettest Quarter P17. Precipitation of Driest Quarter P18. Precipitation of Warmest Quarter P19. Precipitation of Coldest Quarter GHSOM Component planes 2