SlideShare a Scribd company logo
VMware Performance for Gurus
Richard McDougall
Principal Engineer, VMware, Inc
rmc@vmware.com       @richardmcdougll
Usenix Tutorial, December, 2010


                                        © 2010 VMware Inc. All rights reserved
Abstract

!  This class teaches the fundamentals of performance and observability for
    vSphere virtualization technology.
!  The objective of the class is to learn how to be a practitioner of
    performance diagnosis and capacity planning with vSphere.
!  We use a combination of introductory vSphere internals and performance
    analysis techniques to expose what’s going on under the covers, learn
    how to interpret metrics, and how to triage performance problems.
!  We’ll learn how to interpret load measurements, to perform accurate
    capacity planning.


2
Credits

!  Thank you to the many contributors of slides and drawings, including:
    •  Ravi Soundararajan – VC and esxtop
    •  Andrei Dorofeev – Scheduling
    •  Patrick Tullmann – Architecture
    •  Bing Tsai – Storage
    •  Howie Xu - Networking
    •  Scott Drummonds – Performance
    •  Devaki Kulkarni - Tuning
    •  Jeff Buell – Tuning
    •  Irfan Ahmad – Storage & IO
    •  Krishna Raj Raja – Performance
    •  Kit Colbert – Memory
    •  Ole Agesen – Monitor Overview
    •  Sreekanth Setty - Networking
    •  Ajay Gulati - Storage
    •  Wei Zhang - Networking
    •  Amar Padmanabhan – Networking


3
Agenda/Topics

!  Introduction
!  Performance Monitoring
!  CPU
!  Memory
!  I/O and Storage
!  Networking
!  Applications


4
INTRODUCTION TO

    VIRTUALIZATION

         AND

     VMWARE VI/ESX


5
Traditional Architecture

Operating system performs various roles
 •  Application Runtime Libraries
 •  Resource Management (CPU, Memory etc)
 •  Hardware + Driver management


                                   "   Performance & Scalability of the OS
                                       was paramount
                                   "   Performance Observability tools are a
                                       feature of the OS


6
The Virtualized World
The OS takes on the role of a Library, Virtualization layer grows
Application
Run-time Libraries and Services
Application-Level Service Management

Application-decomposition of performance


                                                  Run-time or Deployment OS
                                                  Local Scheduling and Memory Management
                                                  Local File System

                                                  Infrastructure OS (Virtualization Layer)
                                                  Scheduling
                                                  Resource Management
                                                  Device Drivers
                                                  I/O Stack
                                                  File System
                                                  Volume Management
                                                  Network QoS
                                                  Firewall
                                                  Power Management
                                                  Fault Management
                                                  Performance Observability of System Resources


 7
vShere Platform


    Delegated Administration

               Developers        Application          Desktop    DBAs get their
                  QA              Owners             Managers
                                                                 Own per-DB Sandbox
               Test/Dev        Pre-Production        Desktop

                                                                Rapid, Templated
    Process                                                     DB Provisioning
    Automation/Control

                                                                Resource Management
    Distributed                                                 Availability, DR
    Virtualization                  DRS        HA   DR
                                                                Virtual, Portable
    Distributed                                                 DB Instances
    Management


    Hypervisor                                                  High Performance
                                                                Scalable Consolidation


    Physical                                                    Storage Virtualization


8
Hypervisor Architectures


         Virtual            Virtual                     Virtual              Virtual    Virtual
                                          General
                                       Dom0 (Linux)
        Machine            Machine      Purpose OS
                                            or         Machine              Machine    Machine
                                        Parent VM
        Drivers            Drivers      (Windows)      Drivers              Drivers    Drivers

                                        Drivers


                                                                            Drivers
      Dom0 or Parent Xen/Viridian
                     Partition Model                  Vmware ESX


Very Small Hypervisor
                                                      ESX Server
General purpose OS in parent partition for I/O and
   management                                         "   Small Hypervisor < 24 mb
                                                      "   Specialized Virtualization Kernel
All I/O driver traffic going thru parent OS
                                                      "   Direct driver model
Extra Latency, Less control of I/O
                                                      "   Management VMs
                                                         "   Remote CLI, CIM, VI API


  9
VMware ESX Architecture


                                                                        CPU is controlled by scheduler
                                                                        and virtualized by monitor
                                                           File
                                            TCP/IP        System        Monitor supports:
 Guest           Guest                                                  ! BT (Binary Translation)
                                                                        ! HW (Hardware assist)
                                                                        ! PV (Paravirtualization)

      Monitor                    Monitor (BT, HW, PV)


                                         Virtual NIC     Virtual SCSI
                                                                        Memory is allocated by the
     VMkernel
                            Memory
                                        Virtual Switch   File System
                                                                        VMkernel and virtualized by the
                Scheduler   Allocator
                                                                        monitor

                                        NIC Drivers      I/O Drivers


                                                                        Network and I/O devices are
                                                                        emulated and proxied though
     Physical
     Hardware                                                           native device drivers


10
Inside the Monitor: Classical Instruction Virtualization
Trap-and-emulate
!  Nonvirtualized (“native”) system
  •  OS runs in privileged mode
  •  OS “owns” the hardware
  •  Application code has less privilege                   Apps     Ring 3

                                                            OS
                                                                    Ring 0
!  Virtualized
  •  VMM most privileged (for isolation)
  •  Classical “ring compression” or “de-privileging”
      •  Run guest OS kernel in Ring 1
      •  Privileged instructions trap; emulated by VMM
                                                           Apps     Ring 3
  •  But: does not work for x86 (lack of traps)
                                                         Guest OS
                                                                    Ring 1


                                                           VMM      Ring 0


 11
Classical VM performance

!  Native speed except for traps
 •  Overhead = trap frequency * average trap cost
!  Trap sources:
 •  Privileged instructions
 •  Page table updates (to support memory virtualization)
 •  Memory-mapped devices
!  Back-of-the-envelope numbers:
 •  Trap cost is high on deeply pipelined CPUs: ~1000 cycles
 •  Trap frequency is high for “tough” workloads: 50 kHz or greater
 •  Bottom line: substantial overhead


12
Binary Translation of Guest Code

!  Translate guest kernel code
!  Replace privileged instrs with safe “equivalent” instruction sequences
!  No need for traps
!  BT is an extremely powerful technology
 •  Permits any unmodified x86 OS to run in a VM
 •  Can virtualize any instruction set


13
BT Mechanics

!  Each translator invocation
 •  Consume one input basic block (guest code)
 •  Produce one output basic block
!  Store output in translation cache
 •  Future reuse
 •  Amortize translation costs
 •  Guest-transparent: no patching “in place”


                     input                           translated
                     basic block                     basic block
          Guest                         translator


                                                                   Translation cache


14
Combining BT and Direct Execution


                                 Direct Execution
                              (user mode guest code)

           Faults, syscalls
           interrupts


                                      VMM


                                                       IRET, sysret


                              Binary Translation
                          (kernel mode guest code)


15
Performance of a BT-based VMM

!  Costs
  •  Running the translator
  •  Path lengthening: output is sometimes longer than input
  •  System call overheads: DE/BT transition
!  Benefits
  •  Avoid costly traps
  •  Most instructions need no change (“identical” translation)
  •  Adaptation: adjust translation in response to guest behavior
     •  Online profile-guided optimization
  •  User-mode code runs at full speed (“direct execution”)


16
Speeding Up Virtualization


     Technologies for optimizing performance


             Privileged instruction   Binary Translation, Paravirt. CPU
             virtualization           Hardware Virtualization Assist


                                      Binary translation Paravirt. Memory
             Memory virtualization
                                      Hardware Guest Page Tables


             Device and I/O           Paravirtualized Devices
             virtualization           Stateless offload, Direct Mapped I/O


17
Multi-mode Monitors


                 Guest                 Guest                 Guest             There are different types of
                                                                               Monitors for different
                                                                               Workloads and CPU types

                   Binary                Para-               Hardware
                                                                               VMware ESX provides a
                 Translation         Virtualization           Assist           dynamic framework to allow
                                                                               the best Monitor for the
                                             Virtual NIC        Virtual SCSI
                                                                               workload
                               Memory
     VMkernel                               Virtual Switch      File System
                Scheduler      Allocator                                       Let’s look at some of the
                                                                               charactersitics of the
                                             NIC Drivers         I/O Drivers   different monitors


     Physical
     Hardware


18
Virtualization Hardware Assist


More recent CPUs have features to
reduce some of the overhead at the
monitor level

1st Gen: Intel VT and AMD-V                               Guest

•  doesn’t remove all virtualization
   overheads: scheduling, memory
   management and I/O are still virtualized
   with a software layer
                                                                                 Monitor
2ndGen: AMD Barcelona RVI
and Intel EPT
                                                                                  Virtual NIC     Virtual SCSI
•  Helps with memory virtualization
                                                                     Memory
   overheads                                  VMkernel                           Virtual Switch   File System
                                                         Scheduler   Allocator
•  Most workloads run with less than 10%
   overhead
•  EPT provides performance gains of up to                                        NIC Drivers     I/O Drivers
   30% for MMU intensive benchmarks
   (Kernel Compile, Citrix etc)
•  EPT provides performance gains of up to
   500% for MMU intensive micro-
   benchmarks
•  Far fewer “outlier” workloads              Physical
                                              Hardware


 19
vSphere 4 Monitor Enhancements

!  8-VCPU virtual Machines
 •  Impressive scalability from 1-8 vCPUs
!  Monitor type chosen based on Guest OS and CPU model
 •  UI option to override the default
!  Support for upcoming processors with hardware memory virtualization
 •  Rapid Virtualization Indexing from AMD already supported
 •  Extended Page Table from Intel
 •  Improvements to software memory virtualization
!  Better Large Page Support (Unique to VMware ESX)
 •  (Includes enhancements in VMkernel)


20
Intel VT-x / AMD-V: 1st Generation HW Support

!  Key feature: root vs. guest CPU mode
 •  VMM executes in root mode
                                                  Apps             Ring 3


                                                                            Guest mode
 •  Guest (OS, apps) execute in guest mode
                                                Guest OS
!  VMM and Guest run as                                            Ring 0
 “co-routines”


                                                                            Root mode
                                                VM         VM
 •  VM enter                                    exit       enter

 •  Guest runs                                    VMM

 •  A while later: VM exit
 •  VMM runs
 •  ...


21
How VMM Controls Guest Execution

!  Hardware-defined structure
 •  Intel: VMCS (virtual machine control structure)
 •  AMD: VMCB (virtual machine control block)
!  VMCB/VMCS contains
 •  Guest state
 •  Control bits that define conditions for exit
    •  Exit on IN, OUT, CPUID, ...                       VMM          Guest
                                                           VMCB
    •  Exit on write to control register CR3               physical CPU
    •  Exit on page fault, pending interrupt, ...
 •  VMM uses control bits to “confine” and observe guest


22
Performance of a VT-x/AMD-V Based VMM

!  VMM only intervenes to handle exits
!  Same performance equation as classical trap-and-emulate:
 •  overhead = exit frequency * average exit cost
!  VMCB/VMCS can avoid simple exits (e.g., enable/disable interrupts), but
 many exits remain
 •  Page table updates
 •  Context switches
 •  In/out
 •  Interrupts


23
Qualitative Comparison of BT and VT-x/AMD-V

!  BT loses on:
 •  system calls
                                      !  VT-x/AMD-V loses on:
 •  translator overheads
                                       •  exits (costlier than “callouts”)
 •  path lengthening
                                       •  no adaptation (cannot elim. exits)
 •  indirect control flow
                                       •  page table updates
!  BT wins on:                         •  memory-mapped I/O
 •  page table updates (adaptation)
                                       •  IN/OUT instructions
 •  memory-mapped I/O (adapt.)
                                      !  VT-x/AMD-V wins on:
 •  IN/OUT instructions
                                       •  system calls
 •  no traps for priv. instructions
                                       •  almost all code runs “directly”


24
Qualitative Comparison of BT and VT-x/AMD-V

!  BT loses on:
 •  system calls
                                      !  VT-x/AMD-V loses on:
 •  translator overheads
                                       •  exits (costlier than “callouts”)
 •  path lengthening
                                       •  no adaptation (cannot elim. exits)
 •  indirect control flow
                                       •  page table updates
!  BT wins on:                         •  memory-mapped I/O
 •  page table updates (adaptation)
                                       •  IN/OUT instructions
 •  memory-mapped I/O (adapt.)
                                      !  VT-x/AMD-V wins on:
 •  IN/OUT instructions
                                       •  system calls
 •  no traps for priv. instructions
                                       •  almost all code runs “directly”


25
Qualitative Comparison of BT and VT-x/AMD-V

!  BT loses on:
 •  system calls
                                      !  VT-x/AMD-V loses on:
 •  translator overheads
                                       •  exits (costlier than “callouts”)
 •  path lengthening
                                       •  no adaptation (cannot elim. exits)
 •  indirect control flow
                                       •  page table updates
!  BT wins on:                         •  memory-mapped I/O
 •  page table updates (adaptation)
                                       •  IN/OUT instructions
 •  memory-mapped I/O (adapt.)
                                      !  VT-x/AMD-V wins on:
 •  IN/OUT instructions
                                       •  system calls
 •  no traps for priv. instructions
                                       •  almost all code runs “directly”


26
VMexit Latencies are getting lower…


                       Intel Architecture VMexit Latencies
          1600


          1400


          1200                                                Latency (cycles)

          1000


           800


           600


           400


           200


             0
                   Prescott    Cedar Mill   Merom    Penryn        Nehalem (Estimated)


     !  VMexit performance is critical to hardware assist-based virtualization
     !  In additional to generational performance improvements, Intel is improving VMexit
       latencies


27
Virtual Memory in a Native OS


          Process 1                             Process 2
      0                          4GB        0                4GB
                                                                       Virtual    VA
                                                                       Memory


                                                                       Physical   PA
                                                                       Memory


     !  Applications see contiguous virtual address space, not physical memory
     !  OS defines VA -> PA mapping
          •  Usually at 4 KB granularity: a page at a time
          •  Mappings are stored in page tables


28
Virtual Memory (ctd)


          Process 1                             Process 2
      0                          4GB        0                         4GB
                                                                                    Virtual          VA
                                                                                    Memory


                                                                                    Physical         PA
                                                                                    Memory


     !  Applications see contiguous virtual address space, not physical memory
     !  OS defines VA -> PA mapping
                                                             TLB                    VA→PA mapping
          •  Usually at 4 KB granularity                    VA   PA

          •  Mappings are stored in page tables
     !  HW memory management unit (MMU)                                      %cr3              ...

          •  Page table walker                                           TLB fill
                                                                        hardware
          •  TLB (translation look-aside buffer)


29
Virtualizing Virtual Memory


                 VM 1                                VM 2

     Process 1          Process 2        Process 1          Process 2
                                                                          Virtual    VA
                                                                          Memory


                                                                          Physical   PA
                                                                          Memory


                                                                          Machine    MA
                                                                          Memory


     !  To run multiple VMs on a single system, another level of memory virtualization
       must be done
       •  Guest OS still controls virtual to physical mapping: VA -> PA
       •  Guest OS has no direct access to machine memory (to enforce isolation)
     !  VMM maps guest physical memory to actual machine memory: PA -> MA


30
Virtualizing Virtual Memory
Shadow Page Tables


                 VM 1                                  VM 2

     Process 1          Process 2          Process 1          Process 2
                                                                             Virtual    VA
                                                                             Memory


                                                                             Physical   PA
                                                                             Memory


                                                                             Machine    MA
                                                                             Memory


         !  VMM builds “shadow page tables” to accelerate the mappings
            •  Shadow directly maps VA -> MA
            •  Can avoid doing two levels of translation on every access
            •  TLB caches VA->MA mapping
            •  Leverage hardware walker for TLB fills (walking shadows)
            •  When guest changes VA -> PA, the VMM updates shadow page tables


31
3-way Performance Trade-off in Shadow Page Tables

!  1. Trace costs
  •  VMM must intercept Guest writes to primary page tables
  •  Propagate change into shadow page table (or invalidate)
!  2. Page fault costs
  •  VMM must intercept page faults
  •  Validate shadow page table entry (hidden page fault), or
     forward fault to Guest (true page fault)
!  3. Context switch costs
  •  VMM must intercept CR3 writes
  •  Activate new set of shadow page tables
!  Finding good trade-off is crucial for performance
!  VMware has 9 years of experience here


32
!  VMware currently supports and Scaling to Wide vSMP
      Shadow Page Tables up to 4-way vSMP

!  Problems lurk in scaling to higher numbers of vCPUs
 •  Per-vcpu shadow page tables
    •  High memory overhead
    •  Process migration costs (cold shadows/lack of shadows)
    •  Remote trace events costlier than local events
 •  vcpu-shared shadow page tables
    •  Higher synchronization costs in VMM
!  Can already see this in extreme cases
 •  forkwait is slower on vSMP than a uniprocessor VM


33
2nd Generation Hardware Assist
Nested/Extended Page Tables


                                              VA→PA mapping


                              Guest PT ptr              ...
           TLB
          VA MA


                         TLB fill                             guest
                        hardware                              VMM


                          Nested PT ptr


                                             PA→MA mapping


34
Analysis of NPT

!  MMU composes VA->PA and PA->MA mappings on the fly at TLB fill time
!  Benefits
 •  Significant reduction in “exit frequency”
     •  No trace faults (primary page table modifications as fast as native)
     •  Page faults require no exits
     •  Context switches require no exits
 •  No shadow page table memory overhead
 •  Better scalability to wider vSMP
     •  Aligns with multi-core: performance through parallelism
!  Costs
 •  More expensive TLB misses: O(n2) cost for page table walk,
     where n is the depth of the page table tree


35
Analysis of NPT

!  MMU composes VA->PA and PA->MA mappings on the fly at TLB fill time
!  Benefits
 •  Significant reduction in “exit frequency”
     •  No trace faults (primary page table modifications as fast as native)
     •  Page faults require no exits
     •  Context switches require no exits
 •  No shadow page table memory overhead
 •  Better scalability to wider vSMP
     •  Aligns with multi-core: performance through parallelism
!  Costs
 •  More expensive TLB misses: O(n2) cost for page table walk,
     where n is the depth of the page table tree


36
Improving NPT Performance
Large pages
!  2 MB today, 1 GB in the future
  •  In part guest’s responsibility: “inner” page tables
      •  For most guests/workloads this requires explicit setup
  •  In part VMM’s responsibility: “outer” page tables
      •  ESX will take care of it
!  1st benefit: faster page walks (fewer levels to traverse)
!  2nd benefit: fewer page walks (increased TLB capacity)


                                TLB

                                           MMU


37
Hardware-assisted Memory Virtualization


                                    Efficiency Improvement


           60%


           50%


           40%


           30%


           20%


           10%


            0%
                   Apache Compile                SQL Server    Citrix XenApp


                                      Efficiency Improvement


38
vSphere Monitor Defaults


39
Performance Help from the Hypervisor

!  Take advantage of new Hardware
 •  Utilize multi-core systems easily without changing the app or OS
 •  Leverage 64-bit memory hardware sizes with existing 32-bit VMs
 •  Take advantage of newer high performance I/O + networking asynchronously from
     guest-OS changes/revs.
!  More flexible Storage
 •  More options for distributed, reliable boot
 •  Leverage low-cost, high performance NFS, iSCSI I/O for boot or data without changing
     the guest OS
!  Distributed Resource Management
 •  Manage Linux, Solaris, Windows with one set of metrics and tools
 •  Manage horizontal apps with cluster-aware resource management


40
CPU and Memory Paravirtualization


Paravirtualization extends the
                                                                                             File
guest to allow direct interaction                                                           System
with the underlying hypervisor                  Guest                    TCP/IP


Paravirtualization reduces the
monitor cost including memory
and System call operations.                           Monitor                     Monitor


Gains from paravirtualization                                           Virtual NIC     Virtual SCSI
are workload specific
                                                           Memory
                                    VMkernel                           Virtual Switch   File System
                                               Scheduler   Allocator
Hardware virtualization
mitigates the need for some of                                         NIC Drivers          I/O Drivers
the paravirtualization calls

VMware approach:
VMI and paravirt-ops
                                    Physical
                                    Hardware


41
Device Paravirtualization


Device Paravirtualization places
                                                                                           File
A high performance virtualization-                                                        System
Aware device driver into the guest               Guest                    TCP/IP


                                                                          pvdriver
Paravirtualized drivers are more
CPU efficient (less CPU over-
head for virtualization)                                                Monitor


                                                                         pvdevice        Virtual SCSI
Paravirtualized drivers can
                                                            Memory
also take advantage of HW            VMkernel
                                                Scheduler   Allocator
                                                                        Virtual Switch   File System
features, like partial offload
(checksum, large-segment)
                                                                         NIC Drivers     I/O Drivers


VMware ESX uses para-
virtualized network drivers
                                     Physical
                                     Hardware


42
Storage – Fully virtualized via VMFS and Raw Paths


                                                           Guest OS            Guest OS

                       Guest OS
                                                     /dev/hda                         /dev/hda

                              /dev/hda        VMFS         database1.vmdk   database2.vmdk


                                FC LUN                                          FC or iSCSI
                                                                                LUN
! RAW                                       ! VMFS
! RAW provides direct access to             ! Leverage templates and quick
                                            provisioning
a LUN from within the VM
                                            ! Fewer LUNs means you don’t have to
! Allows portability between physical and   watch Heap
virtual                                     ! Scales better with Consolidated Backup
! RAW means more LUNs                       ! Preferred Method
  •  More provisioning time
! Advanced features still work


  43
Optimized Network Performance

                                                                        Network stack and drivers
                                                                        ere implemented in ESX
                                                                        layer (not in the guest)
                                                            File
                                            TCP/IP         System       VMware’s strategy is to
                 Guest
                                                                        optimize the network stack
                                                                        in the ESX layer, and keep
                                                                        the guest 100% agnostic of
                                                                        the underlying hardware
                                        Monitor
                                                                        This enables full-virtualization
                                         Virtual NIC     Virtual SCSI   capabilities (vmotion etc)
                            Memory
     VMkernel
                Scheduler   Allocator
                                        Virtual Switch   File System    ESX Stack is heavily
                                                                        Performance optimized
                                         NIC Drivers     I/O Drivers
                                                                        ESX Focus: stateless offload;
                                                                        including LSO (large segment
                                                                        Offload), Checksum offload,
                                                                        10Gbe perf, Multi-ring NICs
     Physical
     Hardware


44
Guest-Transparent NFS and iSCSI
iSCSI and NFS Virtualization in VMware ESX


                                                                        iSCSI and NFS are growing
                                                            File        To be popular, due to their
                                            TCP/IP         System
                 Guest                                                  low port/switch/fabric costs

                                                                        Virtualization provides the
                                                                        ideal mechanism to
                                                                        transparently adopt iSCSI/NFS
                                        Monitor

                                                                        Guests don’t need iSCSI/NFS
                                         Virtual NIC
                                                         Virtual SCSI   Drivers: they continue to see
     VMkernel
                            Memory                                      SCSI
                                        Virtual Switch
                Scheduler   Allocator                      iSCSI
                                                             Or
                                                            NFS
                                                                        VMware ESX 3 provides high
                                         NIC Drivers                    Performance NFS and iSCSI
                                                                        Stacks

                                                                        Futher emphasis on 1Gbe/
     Physical                                                           10Gbe performance
     Hardware


45
INTRODUCTION TO

      PERFORMANCE

       MONITORING


46
Traditional Architecture


        Operating system performs various roles
         •  Application Runtime Libraries
         •  Resource Management (CPU, Memory etc)
         •  Hardware + Driver management


                                  "   Performance & Scalability of the OS
                                      was paramount
                                  "   Performance Observability tools are a
                                      feature of the OS


47
Performance in a Virtualized World
The OS takes on the role of a Library, Virtualization layer grows


                                                     Application
                                                     Run-time Libraries and Services
                                                     Application-Level Service Management
                                                     Application-decomposition of performance


                                                  Run-time or Deployment OS
                                                  Local Scheduling and Memory Management
                                                  Local File System

                                                  Infrastructure OS (Virtualization Layer)
                                                  Scheduling
                                                  Resource Management
                                                  Device Drivers
                                                  I/O Stack
                                                  File System
                                                  Volume Management
                                                  Network QoS
                                                  Firewall
                                                  Power Management
                                                  Fault Management
                                                  Performance Observability of System Resources


48
Performance Management Trends


     Partitioning     Distributed Resource    Service-Oriented/
                          Management         Service-Level Driven


                                             Web         App


                                                   DB


       ESX 1.x             vSphere                 PaaS,
                                                   Appspeed


49
Performance Measurement

!  Three basic performance measurement metrics:
     •  Throughput: Transactions per/Sec, Instructions Retired per sec, MB/sec, IOPS, etc,
        …
     •  Latency: How long does it take
         •  e.g., Response time
     •  Utilization: How much resource is consumed to perform a unit of work
!  Latency and throughput are often inter-related, latency becomes
 important for smaller jobs


50
Throughput, Queues and Latency


                                                                           Customers
                                                                           Serviced
Arriving                                                                   (throughput is
                        Queue
Customers                                                                  customers
                        (how many people in
(arrivals per minute)                           Checkout                   service per
                        queue)
                                                Utilization = percentage   minute)
                                                of time busy serving
                                                customers


                           queue time                    service time


                                response time


  51
Mathematical Representation, terms


     Arriving            Queue
     Customers
                                                                  Checkout

                                 Utilization = busy-time at server / time elapsed
                 input                                    output

                                             server


                           queue time        service time


                                 response time

52
Throughput,Utilization and Response time are connected


     The Buzen and Denning Method


53
Relationship between Utilization and Response Time


54
Summary of Queuing and Measurements

!  Utilization is a measure of the resources, not quality of service
 •  We can measure utilization (e.g. CPU), but don’t assume good response time
 •  Measuring service time and queuing (Latency) is much more important
!  Throughput shows how much work is completed only
 •  Quality of service (response time) may be compromised if there is queuing or slow
     service times.
!  Make sure your key measurement indicators represent what constitutes
 good performance for your users
 •  Measure end-user latency of users
 •  Measure throughput and latency of a system
!  Common mistakes
 •  Measure something which has little to do with end-user happiness/performance
 •  Measure utilization only
 •  Measure throughput of an overloaded system with a simple benchmark, resulting in
     artificially high results since response times are bad


55
Potential Impacts to Performance

!  Virtual Machine Contributors Latency:
  •  CPU Overhead can contribute to latency
  •  Scheduling latency (VM runnable, but waiting…)
  •  Waiting for a global memory paging operation
  •  Disk Reads/Writes taking longer
!  Virtual machine impacts to Throughput:
  •  Longer latency, but only if the application is thread-limited
  •  Sub-systems not scaling (e.g. I/O)
!  Virtual machine Utilization:
  •  Longer latency, but only if the application is thread-limited


56
Comparing Native to Virtualized Performance

!  Pick the key measure
 •  Not always Utilization
 •  User response-time and throughput might be more important
!  It’s sometimes possible to get better virtual performance
 •  Higher throughput: Can use multiple-VMs to scale up higher than native
 •  Memory sharing can reduce total memory footprint
!  Pick the right benchmark
 •  The best one is your real application
 •  Avoid micro-benchmarks: they often emphasize the wrong metric
     •  especially in virtualized environments


57
Performance Tricks and Catches

!  Can trade-off utilization for latency
  •  Offloading to other CPUs can improve latency of running job at the cost of more
      utilization
  •  A good thing in light of multi-core
!  Latency and Throughput may be skewed by time
  •  If the time measurement is inaccurate, so will be the latency or throughput
      measurements
  •  Ensure that latency and throughput are measured from a stable time source


 58
Time keeping in Native World

!  OS time keeping
 •  OS programs the timer hardware to deliver timer interrupts at specified frequency
 •  Time tracked by counting timer interrupts
 •  Interrupts are masked in critical section of the OS code
 •  Time loss is inevitable however rate of progress of time is nearly constant
!  Hardware time keeping
 •  TSC: Processor maintains Time Stamp Counter. Applications can query TSC (RDTSC
     instruction) for high precision time
      •  Not accurate when processor frequency varies (e.g. Intel’s Speedstep)


59
Time keeping in Virtualized World

!  OS time keeping
 •  Time progresses in the guest with the delivery of virtual timer interrupts
 •  Under CPU over commitment timer interrupts may not be delivered to the guest at the
     requested rate

 •  Lost ticks are compensated with fast delivery of timer interrupts
     •  Rate of progress of time is not constant (Time sync does not address this issue)

!  Hardware time keeping
 •  TSC: Guest OSes see pseudo-TSC that is based on physical CPU TSC
 •  TSC’s may not be synchronized between physical CPUs
 •  RDTSC is unreliable if the VM migrates between physical CPUs or across host
     (Vmotion)


60
Native-VM Comparison Pitfalls (1 of 3)

!  Guest reports clock speed of the
 underlying physical processor
 •  Resource pool settings may limit the CPU
    clock cycles
 •  Guest may not get to use the CPU all the
    time under contention with other virtual
    machines
!  Guest reports total memory allocated
 by the user
 •  This doesn’t have to correspond to the
     actual memory currently allocated by the
     hypervisor


61
Native-VM Comparison Pitfalls (2 of 3)

!  Processor Utilization accounting
 •  Single threaded application can ping pong
    between CPUs
 •  CPU utilization reported in
    task manager is normalized per CPU
 •  Windows does not account idle loop spinning


!  Available Memory
 •  Available memory inside the
     guest may come from swap
     on the host


62
Native-VM Comparison Pitfalls (3 of 3)

!  Hardware setup and configuration differences
 •  Processor: Architecture, cache, clock speed
     •  Performance difference between different architecture is quite substantial
     •  L2, L3 cache size impacts performance of some workload
     •  Clock speed becomes relevant only when the architecture is the same
 •  Disk : Local dedicated disk versus shared SAN
     •  Incorrect SAN configuration could impact performance
 •  File system: Local file system versus Distributed VMFS
     •  Distributed file systems (VMFS) have locking overhead for metadata updates
 •  Network: NIC adapter class, driver, speed/duplex


 " Slower hardware can outperform powerful hardware when the latter shares resources
  with more than one OS/Application


63
Virtualized World Implications

!  Guest OS metrics
     •  Performance metrics in the guest could be skewed when the rate of progress of time is skewed
     •  Guest OS resource availability can give incorrect picture
!  Resource availability
 •  Resources are shared, hypervisors control the allocation
 •  Virtual machines may not get all the hardware resources
!  Performance Profiling
     •  Hardware performance counters are not virtualized
     •  Applications cannot use hardware performance counters for performance profiling in the guest
!  Virtualization moves performance measurement and management to the
 hypervisor layer


64
Approaching Performance Issues

 •  Make sure it is an apples-to-apples comparison
 •  Check guest tools & guest processes
 •  Check host configurations & host processes
 •  Check VirtualCenter client for resource issues
 •  Check esxtop for obvious resource issues
 •  Examine log files for errors
 •  If no suspects, run microbenchmarks (e.g., Iometer, netperf) to narrow scope
 •  Once you have suspects, check relevant configurations
 •  If all else fails…discuss on the Performance Forum


65
Tools for Performance Analysis

!  VirtualCenter client (VI client):
  •  Per-host and per-cluster stats
  •  Graphical Interface
  •  Historical and Real-time data
!  esxtop: per-host statistics
  •  Command-line tool found in the console-OS
!  SDK
  •  Allows you to collect only the statistics they want
!  All tools use same mechanism to retrieve data (special vmkernel calls)


 66
Important Terminology


                                                                 File
                                                TCP/IP          System
         Service
vCPU     Console     Guest
                                                                             Virtual Disk

cCPU                                                                          VMHBA
          Monitor                           Monitor                         vNIC

                                             Virtual NIC     Virtual SCSI

                                Memory
         VMkernel                           Virtual Switch   File System
                    Scheduler   Allocator


                                             NIC Drivers     I/O Drivers


                                                                              HBA
         Physical
         Hardware


 pCPU                                                                         Physical Disk
                                                  pNIC

 67
VI Client


                                                        Chart Type

            Real-time vs. Historical

                                                   Object


                                                Counter type


                                       Rollup                  Stats type


68
VI Client

!  Real-time vs. archived statistics (past hour vs. past day)
!  Rollup: representing different stats intervals
!  Stats Type: rate vs. number
!  Objects (e.g., vCPU0, vCPU1, all CPUs)
!  Counters (e.g., which stats to collect for a given device)
!  Stacked vs. Line charts


69
Real-time vs. Historical stats


     !  VirtualCenter stores statistics at different granularities

     Time Interval             Data frequency            Number of samples

     Past Hour (real-time) 20s                           180

     Past Day                  5 minutes                 288
     Past Week                 15 minutes                672
     Past Month                1 hour                    720
     Past Year                 1 day                     365


70
Stats Infrastructure in vSphere

     4. Rollups


                       DB
                                             ESX
     3. Send
        5-min
        stats to DB

                                             ESX

                  vCenter Server
                   (vpxd, tomcat)
                                                   1. Collect
                       2. Send 5-min stats            20s and
                          to vCenter         ESX
                                                      5-min
                                                      host and
                                                      VM stats

71
Rollups


                      1.    Past-Day (5-minutes) " Past-Week
                      2.    Past-Week (30-minutes) " Past-Month
                      3.    Past-Month (2-hours) " Past-Year
                      4.    (Past-Year = 1 data point per day)
       DB


 DB only archives historical data
 •  Real-time (i.e., Past hour) NOT archived at DB
 •  Past-day, Past-week, etc. " Stats Interval
 •  Stats Levels ONLY APPLY TO HISTORICAL DATA


72
Anatomy of a Stats Query: Past-Hour (“RealTime”) Stats


                                  DB
                                                             ESX


                1. Query

      Client                                                 ESX

                             vCenter Server
                              (vpxd, tomcat)
               3. Response
                                       2. Get stats
                                          from host
                                                             ESX
     No calls to DB
     Note: Same code path for past-day stats within last 30 minutes

73
Anatomy of a Stats Query: Archived Stats


                                    DB
                                               ESX

                     2. Get stats

                1. Query

      Client                                   ESX

                             vCenter Server
                              (vpxd, tomcat)
               3. Response

                                               ESX
     No calls to ESX host (caveats apply)
     Stats Level = Store this stat in the DB

74
Stats type

!  Statistics type: rate vs. delta vs. absolute


      Statistics type        Description          Example

      Rate                   Value over the       CPU Usage (MHz)
                             current interval


      Delta                  Change from          CPU Ready time
                             previous interval


      Absolute               Absolute value       Memory Active
                             (independent of
                             interval)
 75
Objects and Counters

!  Objects: instances or aggregations of devices
 •  Examples: VCPU0, VCPU1, vmhba1:1:2, aggregate over all NICs


!  Counters: which stats to collect
 •  Examples:
     •  CPU: used time, ready time, usage (%)
     •  NIC: network packets received
     •  Memory: memory swapped


76
Stacked vs. Line charts


     !  Line
       •  Each instance shown separately


     !  Stacked
       •  Graphs are stacked on top of each other
       •  Only applies to certain kinds of charts, e.g.:
         •  Breakdown of Host CPU MHz by Virtual Machine
         •  Breakdown of Virtual Machine CPU by VCPU


77
esxtop

!  What is esxtop ?
     •  Performance troubleshooting tool for ESX host
     •  Displays performance statistics in rows and column format


                                                                    Fields


                                       Entities -running
                                       worlds in this
                                       case


78
esxtop FAQ

!  Where to get it?
     •  Comes pre-installed with ESX service console
     •  Remote version of esxtop (resxtop) ships with the Remote Command Line interface (RCLI)
      package


!  What are its intended use cases?
     •  Get a quick overview of the system
     •  Spot performance bottlenecks


!  What it is not meant for ?
     •  Not meant for long term performance monitoring, data mining, reporting, alerting etc. Use VI
      client or the SDK for those use cases


79
esxtop FAQ

!  What is the difference between esxtop and resxtop


                               esxtop         VMKernel

                            Service Console
                                                ESX


            resxtop                Network            hostd            VMKernel

     Linux client machine
                                                          ESXi / ESX


80
Introduction to esxtop

!  Performance statistics
     •  Some are static and don’t change during runtime, for example MEMSZ (memsize), VM Name
      etc


     •  Some are computed dynamically, for example CPU load average, memory over-commitment
      load average etc


     •  Some are calculated from the delta between two successive snapshots. Refresh interval (-d)
      determines the time between successive snapshots
        •  for example %CPU used = ( CPU used time at snapshot 2 - CPU used time at snapshot 1 ) /
            time elapsed between snapshots


81
esxtop modes

!  Interactive mode (default)
     •  Shows data in the screen and accepts keystrokes
     •  Requires TERM=xterm


!  Batch mode (-b)
     •  Dumps data to stdout in CSV format
     •  Dumps default fields or fields stored in the configuration file


!  Replay mode (-R)
     •  Replays data from vm-support performance snapshot


82
esxtop interactive mode

!  Global commands
     •  space - update display
     •  s - set refresh interval (default 5 secs)
     •  f - select fields (context sensitive)
     •  W - save configuration file (~/.esxtop3rc)
     •  V - view VM only
     •  oO - Change the order of displayed fields (context sensitive)
     •  ? - help (context sensitive)
     •  ^L - redraw screen
     •  q - quit


83
esxtop screens


! Screens
     •  c: cpu (default)
     •  m: memory
     •  n: network                                  VM         VM       VM        VM
     •  d: disk adapter
     •  u: disk device (added in ESX 3.5)
     •  v: disk VM (added in ESX 3.5)             CPU        Memory     Virtual
                                                                                    vSCSI
                                                Scheduler   Scheduler   Switch
     •  i: Interrupts (new in ESX 4.0)
     •  p: power management (new in ESX 4.1)     c, i, p      m          n        d, u, v
                                               VMkernel


84
Using screen


     Time     Uptime   running worlds


                                        fields hidden from the view…

     • Worlds = VMKernel processes
     • ID = world identifier
     • GID = world group identifier
     • NWLD = number of worlds


85
Using screen - expanding groups


     press ‘e’ key


      • In rolled up view stats are cumulative of all the worlds in the group
      • Expanded view gives breakdown per world
      • VM group consists of mks, vcpu, vmx worlds. SMP VMs have additional vcpu
      and vmm worlds
      • vmm0, vmm1 = Virtual machine monitors for vCPU0 and vCPU1 respectively


86
esxtop replay mode

!  To record esxtop data
     •  vm-support -S -d <duration>


!  To replay
     •  tar xvzf vm-support-dump.tgz
     •  cd vm-support-*/
     •  esxtop -R ./ (esxtop version should match)


87
esxtop replay mode


              Current time


88
esxtop batch mode

!  Batch mode (-b)
 •  Produces windows perfmon compatible CSV file
 •  CSV file compatibility requires fixed number of columns on every row - statistics of
     VMs/worlds instances that appear after starting the batch mode are not collected
     because of this reason
 •  Only counters that are specified in the configuration file are collected, (-a) option
     collects all counters
 •  Counters are named slightly differently


89
esxtop batch mode

!  To use batch mode
      •  esxtop -b > esxtop_output.csv


!  To select fields
      •  Run esxtop in interactive mode
      •  Select the fields
      •  Save configuration file (‘w’ key)


!  To dump all fields
      •  esxtop -b -a > esxtop_output.csv


 90
esxtop batch mode – importing data into perfmon


91
esxtop batch mode – viewing data in perfmon


92
esxtop batch mode – trimming data


          Trimming data
                                     Saving data after trim


93
esxplot

!  http://labs.vmware.com/flings/esxplot


94
SDK

!  Use the VIM API to access statistics relevant to a particular user

!  Can only access statistics that are exported by the VIM API (and thus are
 accessible via esxtop/VI client)


95
Conclusions

!  Always Analyze with a Latency approach
   •  Response time of user
   •  Queuing for resources in the guest
   •  Queuing for resources in vSphere
   •  Queing for resources outside of the host (SAN, NAS etc)
!  These tools are useful in different contexts
      •  Real-time data: esxtop
      •  Historical data: VirtualCenter
      •  Coarse-grained resource/cluster usage: VirtualCenter
      •  Fine-grained resource usage: esxtop


 96
CPU


97
CPUs and Scheduling


                                                o  Schedule virtual CPUs on
                                                   physical CPUs
                                                o  Virtual time based proportional-
                                                   share CPU scheduler
                Guest       Guest     Guest
                                                o  Flexible and accurate rate-based
                                                   controls over CPU time
                                                   allocations
                                                o  NUMA/processor/cache topology
                Monitor     Monitor   Monitor
                                                   aware
                                                o  Provide graceful degradation in
                                                   over-commitment situations
     VMkernel             Scheduler             o  High scalability with low
                                                   scheduling latencies
                                                o  Fine-grain built-in accounting for
                                                   workload observability
                                                o  Support for VSMP virtual
                                                   machines
     Physical
     CPUs


98
Resource Controls

!  Reservation
  •  Minimum service level guarantee (in MHz)
                                                         Total Mhz
  •  Even when system is overcommitted
  •  Needs to pass admission control
                                                              Limit
!  Shares
  •  CPU entitlement is directly proportional to VM's
      shares and depends on the total number of         Shares
      shares issued                                      apply
                                                         here
  •  Abstract number, only ratio matters

!  Limit                                                Reservation

  •  Absolute upper bound on CPU entitlement (in MHz)
  •  Even when system is not overcommitted
                                                             0 Mhz


 99
Resource Control Example


                    Add 2nd VM                  Add 3rd VM
        100%      ► with same           50%   ► with same
                      number                      number                33.3%
                     of shares                   of shares


                                                                      ▼
                                                             Set 3rd VM’s limit to
                                                             25% of total capacity


        FAILED     Add 4th VM                 Set 1st VM’s
                   with reservation           reservation to
      ADMISSION                     ◄
                   set to 75% of              50% of total ◄            37.5%
       CONTROL     total capacity       50%   capacity


100
Resource Pools

!  Motivation
  •  Allocate aggregate resources for sets of VMs
  •  Isolation between pools, sharing within pools
  •  Flexible hierarchical organization
  •  Access control and delegation                                           Admin

!  What is a resource pool?
  •  Abstract object with permissions
  •  Reservation, limit, and shares                  L: not set     Pool A           Pool B   L: 2000Mhz
                                                     R: 600Mhz                                R: not set
  •  Parent pool, child pools and VMs                S: 60 shares                             S: 40 shares

  •  Can be used on a stand-alone
      host or in a cluster (group of hosts)

                                                          VM1        VM2     VM3       VM4


                                                                               60%            40%


101
Example migration scenario 4_4_0_0 with DRS


                                                                                                                                                     vCenter
                                                                                                                                           HP                                                                                                                         HP
                                                        1           2                                                                   ProLiant                                           1          2                                                            ProLiant
                                                                    OVER                                                                DL380G6                                                       OVER                                                         DL380G6
                                           1            2           TEMP                 1       5                                                                          1              2          TEMP                       1       5
                                 POWER         POWER                                                                                                                  POWER        POWER
                                 SUPPLY        SUPPLY               INTER                                        PL A Y ER                                            SUPPLY       SUPPLY             INTER                                      PL A Y ER
                                                                    LOCK                                                                                                                              LOCK
                                 POWER CAP                                                                                                                            POWER CAP
                                                                     DIMMS                                                                                                                             DIMMS
                              1A 3G 5E 7C 9i                 9i 7C 5E 3G 1A                                                                                          1A 3G 5E 7C 9i            9i 7C 5E 3G 1A

                                                                                         2       6                                                                                                                               2       6
                                 2D 4B 6H 8F                  8F 6H 4B 2D                                                                                             2D 4B 6H 8F               8F 6H 4B 2D
                                                   ONLINE                                                                                                                              ONLINE
                                           1       SPARE                     2                                                                                                 1       SPARE                    2
                                  PROC                                  PROC                                                                                           PROC                               PROC
                                                       MIRROR                                                                                                                          MIRROR
                              FANS                                                                                                                                   FANS
                                                                                         3       7                                                                                                                               3       7
                                   1           2         3      4        5       6                                                                                      1          2       3     4         5         6


                                                                                         4       8                                                                                                                               4       8


                                                                                                                                                   Imbalanced
                                                                                                                                                    Balanced
                                                                                                                                                   Cluster
                                                                                                                                                    Cluster


             1
                          1

                          2
                                       2
                                      OVER
                                      TEMP                                           1       5
                                                                                                                                HP
                                                                                                                             ProLiant
                                                                                                                             DL380G6
                                                                                                                                                      Heavy Load             POWER
                                                                                                                                                                             SUPPLY
                                                                                                                                                                                       1
                                                                                                                                                                                           POWER
                                                                                                                                                                                           SUPPLY
                                                                                                                                                                                                 1

                                                                                                                                                                                                 2
                                                                                                                                                                                                               2
                                                                                                                                                                                                               OVER
                                                                                                                                                                                                               TEMP

                                                                                                                                                                                                               INTER
                                                                                                                                                                                                               LOCK
                                                                                                                                                                                                                                     1       5
                                                                                                                                                                                                                                                       PL A Y ER
                                                                                                                                                                                                                                                                        HP
                                                                                                                                                                                                                                                                     ProLiant
                                                                                                                                                                                                                                                                     DL380G6


       POWER        POWER                                                                                                                                                    POWER CAP
       SUPPLY       SUPPLY             INTER                                                         PL A Y ER
                                                                                                                                                                                                              DIMMS
                                       LOCK                                                                                                                                 1A 3G 5E 7C 9i            9i 7C 5E 3G 1A
       POWER CAP
                                      DIMMS
      1A 3G 5E 7C 9i          9i 7C 5E 3G 1A                                                                                                                                                                                         2       6

                                                                                     2       6                                                                                  2D 4B 6H 8F               8F 6H 4B 2D
                                                                                                                                                                                               ONLINE
                                                                                                                                                                                       1       SPARE                     2
       2D 4B 6H 8F               8F 6H 4B 2D
                        ONLINE                                                                                                                                                     PROC                             PROC
                1                                  2                                                                                                                                            MIRROR
                        SPARE                                                                                                                                               FANS
        PROC                               PROC
                                                                                                                                                                                                                                     3       7
                        MIRROR                                                                                                                                                     1       2      3        4         5       6
      FANS
                                                                                     3       7
         1          2     3       4            5        6


                                                                                                                                                                                                                                     4       8

                                                                                     4       8


                                                                                                                                                      Lighter Load


102
DRS Scalability – Transactions per minute
(Higher the better)


                                                   Transactions per minute - DRS vs. No DRS                    No DRS     DRS
                           Already balanced
                           So, fewer gains
                                                                                            Higher gains (> 40%)
                                                                                            with more imbalance

                         140000
                         130000
                         120000
Transaction per minute


                         110000
                         100000
                          90000
                          80000
                          70000
                          60000
                          50000
                          40000
                                  2_2_2_2     3_2_2_1   3_3_1_1   3_3_2_0   4_2_1_1   4_2_2_0   4_3_1_0   4_4_0_0   5_3_0_0
                                                                       Run Scenario


       103
DRS Scalability – Application Response Time
(Lower the better)


                                                     Transaction Response Time - DRS vs. No DRS       No DRS   DRS

                                  70.00

                                  60.00
 Transaction Response time (ms)


                                  50.00


                                  40.00


                                  30.00

                                  20.00


                                  10.00


                                   0.00
                                          2_2_2_2 3_2_2_1 3_3_1_1 3_3_2_0 4_2_1_1 4_2_2_0 4_3_1_0 4_4_0_0 5_3_0_0
                                                                       Run Scenario


    104
ESX CPU Scheduling States

!  World states (simplified view):
 •  ready = ready-to-run but no physical CPU free
 •  run = currently active and running
 •  wait = blocked on I/O


!  Multi-CPU Virtual Machines => gang scheduling
 •  Co-run (latency to get vCPUs running)
 •  Co-stop (time in “stopped” state)


105
Ready Time (1 of 2)


!  VM state                                                  Run
 •  running (%used)
 •  waiting (%twait)
 •  ready to run (%ready)                                            Ready
                                                Wait

!  When does a VM go to “ready to run” state
 •  Guest wants to run or need to be woken up (to deliver an interrupt)
 •  CPU unavailable for scheduling the VM


106
Ready Time (2 of 2)

!  Factors affecting CPU availability
 •    CPU overcommitment
      •    Even Idle VMs have to be scheduled periodically to deliver timer interrupts
 •    NUMA constraints
      •    NUMA node locality gives better performance
 •    Burstiness – Inter-related workloads
      •    Tip: Use host anti affinity rules to place inter related workloads on different hosts
 •    Co-scheduling constraints
 •    CPU affinity restrictions


Fact: Ready time could exist even when CPU usage is low


107
Different Metrics for Different Reasons

!  Problem Indication
 •  Response Times, Latency contributors
 •  Queuing
!  Headroom Calculation
 •  Measure Utilization, predict headroom
!  Capacity Prediction
 •  If I have n users today, how much resource is needed in the future?
!  Service Level Prediction
 •  Predict the effect of response time changes
 •  Resource or Load changes


108
Myths and Fallacies

!  High CPU utilization is an indicator of a problem
 •  Not always: Single threaded compute intensive jobs operate quite happily at 100%
!  Less than 100% CPU means service is good (false)
 •  Not always: Bursty transaction oriented workloads follow littles-law curve, which limits
      effective utilization to a lower number


109
Consider these two workloads


5                                           5
4                                           4
3                                           3
2                                           2
1                                           1
0                                           0
      Period 1 Period 2 Period 3 Period 4       Period 1 Period 2 Period 3 Period 4


          Utilization is 25%                     Utilization is 25%
          Average Response time is high          Average Response time is low


110
The Buzen and Denning Method


111
Simple model of the Scheduler


112
CPU and Queuing Metrics

!  How much CPU is too much?
 •  It’s workload dependent.
 •  The only reliable metrics is to calculate how much time a workload waits in a queue for
      CPU
 •  This must be a measure of guest-level threads (not VMkernel)
!  Which is better – a faster CPU or more CPUs?
 •  Typical question in the physical world
 •  Question for us: will additional vCPUs help?


113
Relationship between Utilization and Response Time


114
Tools for diagnosing CPU performance: VI Client

!  Basic stuff
       •  CPU usage (percent)
       •  CPU ready time (but ready time by itself can be misleading)
!  Advanced stuff
       •  CPU wait time: time spent blocked on IO
       •  CPU extra time: time given to virtual machine over reservation
       •  CPU guaranteed: min CPU for virtual machine
!  Cluster-level statistics
       •  Percent of entitled resources delivered
       •  Utilization percent
       •  Effective CPU resources: MHz for cluster


 115
CPU capacity

! How do we know we are maxed out?
      •    If VMs are waiting for CPU time, maybe we need more CPUs.
      •    To measure this, look at CPU ready time.
! What exactly am I looking for?
      •    For each host, collect ready time for each VM
      •    Compute %ready time for each VM (ready time/sampling interval)
      •    If average %ready time > 50%, probe further
! Possible options
      •    DRS could help optimize resources
      •    Change share allocations to de-prioritize less important VMs
      •    More CPUs may be the solution


116
CPU capacity

                                                     (screenshot from VI Client)


  Some caveats on ready time
                                                 Used time
  !    Used time ~ ready time: may
       signal contention. However,
       might not be overcommitted
       due to workload variability
  !    In this example, we have
       periods of activity and idle                            Ready time ~ used time
       periods: CPU isn’t
       overcommitted all the time


                        Ready time < used time


117
VI Client CPU screenshot


      Note CPU milliseconds and percent are on the same chart but use different axes


118
Cluster-level information in the VI Client


                                                  !  Utilization %
                                                    describes available
                                                    capacity on hosts
                                                    (here: CPU usage
                                                    low, memory usage
                                                    medium)


                                             "    % Entitled resources
                                                  delivered: best if all
                                                  90-100+.


119
CPU performance analysis: esxtop

!  PCPU(%): CPU utilization
!  Per-group stats breakdown
 •  %USED: Utilization
 •  %RDY: Ready Time
 •  %TWAIT: Wait and idling time
!  Co-Scheduling stats (multi-CPU Virtual Machines)
 •  %CRUN: Co-run state
 •  %CSTOP: Co-stop state
!  Nmem: each member can consume 100% (expand to see breakdown)
!  Affinity
!  HTSharing


120
esxtop CPU screen (c)


  PCPU = Physical CPU
  CCPU = Console CPU (CPU 0)
  Press ‘f’ key to choose fields


121
New metrics in CPU screen


%LAT_C : %time the VM was not scheduled due to CPU resource issue

%LAT_M : %time the VM was not scheduled due to memory resource issue

%DMD : Moving CPU utilization average in the last one minute

EMIN : Minimum CPU resources in MHZ that the VM is guaranteed to get
when there is CPU contention


122
Troubleshooting CPU related problems

!  CPU constrained


                                       SMP VM


                                       High CPU
                                       utilization


                                       Both the
                                       virtual CPUs
                                       CPU
                                       constrained


 123
Troubleshooting CPU related problems

!  CPU limit


                                       Max
                                       Limited


                       CPU Limit       AMAX = -1 : Unlimited


124
Troubleshooting CPU related problems

!  CPU contention


                                VMs don’t get
 4 CPUs, all at     3 SMP VMs   to run all the   %ready
 100%                           time             accumulates


125
Further ready time examination


      High Ready Time
                                   High MLMTD: there is a limit on this VM…

      "High ready time not always because of overcommitment
      "When you see high ready time, double-check if limit is set

126
Troubleshooting CPU related problems

!  SMP VM running UP HAL/Kernel


                           It is also possible that you are running a single
                           threaded application in a SMP VM
      vCPU 1 not used by
      the VM


127
Troubleshooting CPU related problems

!  High CPU activity in the Service Console


                                              Some process in the
                                              service console is
                                              hogging CPU


                                               Not much activity in
                                               the service console


                                               VMKernel is doing
                                               some activity on
                                               behalf of the console
                                               OS - cloning in this
                                               case


 128
VI Client and Ready Time


                                         Used time
"   Usedtime ~ ready time: may
signal contention. However,
might not be overcommitted due
to workload variability
"   In
    this example, we have
periods of activity and idle
periods: CPU isn’t
overcommitted all the time
                                                     Ready time
                                                     ~ used time


                Ready time < used time


129
CPU Performance

!  vSphere supports eight virtual processors per VM
 •  Use UP VMs for single-threaded applications
      •  Use UP HAL or UP kernel
 •  For SMP VMs, configure only as many VCPUs as needed
 •  Unused VCPUs in SMP VMs:
      •  Impose unnecessary scheduling constraints on ESX Server
      •  Waste system resources (idle looping, process migrations, etc.)


130
CPU Performance

!  For threads/processes that migrate often between VCPUs
 •  Pin the guest thread/process to a particular VCPU
 •  Pinning guest VCPUs to PCPUs rarely needed
!  Guest OS timer interrupt rate
 •  Most Windows, Linux 2.4: 100 Hz
 •  Most Linux 2.6: 1000 Hz
 •  Recent Linux: 250 Hz
 •  Upgrade to newer distro, or rebuild kernel with lower rate


131
Performance Tips

!  Idling VMs
  •  Consider overhead of delivering guest timer interrupts
  •  Lowering guest periodic timer interrupt rate should help
!  VM CPU Affinity
  •  Constrains the scheduler: can cause imbalances
  •  Reservations may not be met – use on your own risk
!  Multi-core processors with shared caches
  •  Performance characteristics heavily depend on the workload
  •  Constructive/destructive cache interference


 132
Performance Tips

!  SMP VMs
 •  Use as few virtual CPUs as possible
 •  Consider timer interrupt overhead of idling CPUs
 •  Co-scheduling overhead increases with more VCPUs
 •  Use SMP kernels in SMP VMs
 •  Pinning guest threads to VCPUs may help to reduce migrations for some workloads
!  Interactive Workloads (VDI, etc)
 •  Assign more shares, increase reservations to achieve faster response times


133
vSphere Scheduler and HT

!  Intel Hyper-threading provides the   The default: more CPU
 appearance of two logical cores
 for each physical core
 •  They are somewhat faster than one
      core but not as fast as two
!  Threads sharing cores less CPU
 than threads with their own cores              v    v            v      v
!  Threads accessing common                     v    v            v      v
 memory will benefit from running
 on the same socket
                                                         Physical core
!  So, 5+ vCPU VMs must choose
 between more CPU and faster                     v       Running vCPU
 memory


134
Optimizing the Scheduler for Large VMs

!  On some virtual machines,             preferHT
 memory latency is more important
 than CPU
!  If VM has more vCPUs than there
 are cores in a single socket, it will
 run faster if forced to a single
 socket
                                             v       v
                                                 v       v
!  Done with Advanced Settings:              v       v
 NUMA.preferHT                                   v       v


                                                         Hyper-threaded physical core

                                         v           Running vCPU


135
MEMORY


136
Virtual Memory


      !  Creates uniform memory address space
                                                                       “virtual” memory
       •  Operating system maps application virtual addresses to
          physical addresses
       •  Gives operating system memory management abilities           guest
          transparent to application
                                                                     “physical” memory


                                                                   hypervisor
      Hypervisor adds extra level of indirection
         "   Maps guest’s physical addresses to machine              “machine” memory
             addresses
         "   Gives hypervisor memory management abilities
             transparent to guest


137
Virtual Memory


          “virtual” memory                    guest
                                               “virtual”
                             Application       memory

          guest                                 App


        “physical” memory    Operating        “physical”
                             System            memory
                                           hypervisor

                                                  OS
      hypervisor

                                             “machine”
        “machine” memory     Hypervisor       memory

                                             Hypervisor


138
Application Memory Management

 •  Starts with no memory
 •  Allocates memory through syscall to operating
      system
 •  Often frees memory voluntarily through syscall
 •  Explicit memory allocation interface with         App
      operating system


                                                       OS


                                                     Hypervi
                                                       sor


139
Operating System Memory Management

 •  Assumes it owns all physical memory
 •  No memory allocation interface with
      hardware
      •  Does not explicitly allocate or free physical
        memory
 •  Defines semantics of “allocated” and “free”            App
      memory
      •  Maintains “free” list and “allocated” lists of
         physical memory
      •  Memory is “free” or “allocated” depending on
         which list it resides
                                                            OS


                                                          Hypervi
                                                            sor


140
Hypervisor Memory Management

 •  Very similar to operating system memory
      management
      •  Assumes it owns all machine memory
      •  No memory allocation interface with hardware
      •  Maintains lists of “free” and “allocated” memory
                                                              App


                                                               OS


                                                            Hypervis
                                                               or


141
VM Memory Allocation

 •  VM starts with no physical memory
      allocated to it
 •  Physical memory allocated on demand
    •  Guest OS will not explicitly allocate
    •  Allocate on first VM access to           App
       memory (read or write)


                                                OS


                                               Hyperv
                                                isor


142
VM Memory Reclamation

•  Guest physical memory not “freed” in typical sense
  •  Guest OS moves memory to its “free” list
  •  Data in “freed” memory may
   not have been modified

                                                                 App


                                                     Guest
                                                    free list     OS
        "    Hypervisor isn’t aware when
             guest frees memory
             "   Freed memory state unchanged
                                                                Hypervi
             "   No access to guest’s “free” list                 sor

             "   Unsure when to reclaim “freed”
                 guest memory


  143
VM Memory Reclamation Cont’d


!  Guest OS (inside the VM)
 •  Allocates and frees…
 •  And allocates and frees…           Inside
                                       the VM           App
 •  And allocates and frees…
                                                       VM


       "    VM                              Guest
                                           free list        OS
            "   Allocates…
            "   And allocates…
            "   And allocates…                         Hyperv
                                                        isor

       "    Hypervisor needs some way of
            reclaiming memory!


 144
Memory Resource Management

!  ESX must balance memory usage
 •  Page sharing to reduce memory footprint of Virtual Machines
 •  Ballooning to relieve memory pressure in a graceful way
 •  Host swapping to relieve memory pressure when ballooning insufficient
 •  Compression to relieve memory pressure without host-level swapping


!  ESX allows overcommitment of memory
 •  Sum of configured memory sizes of virtual machines can be greater than physical
      memory if working sets fit


!  Memory also has limits, shares, and reservations

!  Host swapping can cause performance degradation


145
New in vSphere 4.1 – Memory Compression

!  Compress memory as a last resort before swapping
!  Kicks in after ballooning has failed to maintain free memory
!  Reclaims part of the performance lost when ESX is forced to induce
 swapping

                              1.20                                                                                      3.6

                                     1.00              0.99
                              1.00                                        0.95                                          3
      Normalized Throughput


                                     1.00              0.99


                                                                                                                              Swap Read (MB/sec)
                                                                          0.94             0.80
                              0.80                                                                            0.70      2.4


                              0.60                                                         0.66                         1.8


                              0.40                                                                                      1.2
                                                                                                              0.42

                              0.20                                                                                      0.6


                              0.00                                                                                      0
                                     96                80                 70                60                 50
                                                                 Host Memory Size (GB)

                                     Swap Read with Memory Compression              Swap Read w/o Memory Compression
                                     Throughput with Memory Compression             Throughput w/o Memory Compression


146
                                                                                                                                                   K
Ballooning, Compression, and Swapping (1)

!  Ballooning: Memctl driver grabs pages and gives to ESX
      •  Guest OS choose pages to give to memctl (avoids “hot” pages if possible): either free pages or
       pages to swap
         •  Unused pages are given directly to memctl
         •  Pages to be swapped are first written to swap partition within guest OS and then given to
           memctl


       VM1                                                                            VM2
                            F
         memctl
                                        2. Reclaim

                                                             3. Redistribute

      Swap partition w/in
      Guest OS
                      1. Balloon
                                                     ESX


147
Ballooning, Swapping, and Compression (2)

!  Swapping: ESX reclaims pages forcibly
      •  Guest doesn’t pick pages…ESX may inadvertently pick “hot” pages ("possible VM
       performance implications)
      •  Pages written to VM swap file


       VM1                                                                      VM2


                      Swap
                      Partition (w/in                        1. Force Swap
                                                  ESX
VSWP                  guest)                                 2. Reclaim
(external to guest)                                          3. Redistribute


148
Ballooning, Swapping and Compression (3)

!  Compression: ESX reclaims pages, writes to in-memory cache
      •  Guest doesn’t pick pages…ESX may inadvertently pick “hot” pages ("possible VM
       performance implications)
      •  Pages written in-memory cache " faster than host-level swapping


       VM1                                                                       VM2


                     Swap
                     Partition (w/in                           1. Write to Compression Cache
                                                   ESX
                     guest)                                    2. Give pages to VM2
                                         Compression
                                           Cache

149
Ballooning, Swapping, and Compression (4)

!  Bottom line:
 •  Ballooning may occur even when no memory pressure just to keep memory
      proportions under control
 •  Ballooning is preferable to compression and vastly preferable to swapping
      •  Guest can surrender unused/free pages
          •  With host swapping, ESX cannot tell which pages are unused or free and may accidentally
           pick “hot” pages
      •  Even if balloon driver has to swap to satisfy the balloon request, guest chooses what to swap
          •  Can avoid swapping “hot” pages within guest
      •  Compression: reading from compression cache is faster than reading from disk


150
Transparent Page Sharing


      !  Simple idea: why maintain many             VM 1   VM 2      VM 3
       copies of the same thing?
       •  If 4 Windows VMs running, there are 4
         copies of Windows code
       •  Only one copy needed
                                                           Hypervi
      !  Share memory between VMs when                       sor
       possible
       •  Background hypervisor thread identifies
         identical sets of memory
                                                    VM 1   VM 2      VM 3
       •  Points all VMs at one set of memory,
         frees the others
       •  VMs unaware of change

                                                           Hypervi
                                                             sor


151
Page Sharing in XP


                                                 XP Pro SP2: 4x1GB
                                4500
                                4000
                                3500
                  Memory (MB)   3000                                               Non-Zero
                                2500                                               Zero
                                2000                                               Backing
                                1500                                               Private
                                1000
                                 500
                                   0
                                       1 5 9 13 17 21 25 29 33 37 41 45 49 53 57
                                                       Time (min)


         Memory footprint of four idle VMs quickly decreased to 300MB
         due to aggressive page sharing.


152
Page Sharing in Vista


                                          Vista32: 4x1GB
                       4500
                       4000
                       3500
         Memory (MB)


                       3000                                               Non-Zero
                       2500                                               Zero
                       2000                                               Backing
                       1500                                               Private
                       1000
                        500
                          0
                              1 5 9 13 17 21 25 29 33 37 41 45 49 53 57
                                              Time (min)

          Memory footprint of four idle VMs quickly decreased to 800MB.
          (Vista has larger memory footprint.)


153
Memory capacity

! How do we identify host memory contention?
      •    Host-level swapping (e.g., robbing VM A to satify VM B).
      •    Active memory for all VMs > physical memory on host
           This could mean possible memory over-commitment

! What do I do?
      •    Check swapin (cumulative), swapout (cumulative) and swapused (“instantaneous”) for the
           host. Ballooning (vmmemctl) is also useful.
      •    If swapin and swapout are increasing, it means that there is possible memory over-
           commitment
      •    Another possibility: sum up active memory for each VM. See if it exceeds host physical
           memory.


154
Memory Terminology


                                     memory size
                               total amount of memory
                                  presented to guest


                  allocated memory              unallocated memory
                  memory assigned to            memory not assigned
                      applications
                                                          Host memory usage
                                                          measures this, sorta…
       active memory              inactive memory
  allocated memory recently     allocated memory not
     accessed or used by      recently accessed or used
          applications


                          Guest memory usage measures this


155
Differences Between Memory Statistics

! Biggest difference is physical memory vs. machine memory
 •  Accounting very different between the two layers!


                                                         App


      Physical memory statistics
      "   Active, Balloon, Granted, Shared,              OS
          Swapped, Usage


      Machine memory statistics
                                                        Hyperv
      "   Consumed, Overhead, Shared                     isor
          Common


156
Memory Shared vs. Shared Common


      ! Memory Shared
          •  Amount of physical memory whose mapped machine memory has multiple pieces of
           physical memory mapped to it
          •  6 pieces of memory (VM 1 & 2)       VM 1                   VM 2


      Memory Shared Common
      "   Amount of machine memory with                        Hyperv
                                                                isor
          multiple pieces of physical memory
          mapped to it
      "   3 pieces of memory


157
Memory Granted vs. Consumed


      ! Memory Granted
          •  Amount of physical memory mapped to machine memory
          •  9 pieces of memory (VM 1 & 2)
                                                 VM 1                      VM 2


      Memory Consumed
      "    Amount of machine memory that has
           physical memory mapped to it                           Hyperv
                                                                   isor
      "    6 pieces of memory


      Difference due to page sharing!


158
Memory Active vs. Host Memory


      ! Memory Active/Consumed/Shared
          •  All measure physical memory


                                                   VM 1                   VM 2

      Host Memory
      "    Total machine memory on host
                                                                 Hyperv
                                                                  isor


      Be careful to not mismatch physical and machine statistics!
      "    Guest physical memory can/will be greater than machine memory due to
           memory overcommitment and page sharing


159
Memory Metric Diagram *


VM                                            VM memsize

                                                  granted
       vmmemctl                                                               <unallocated>
                         swapped                  active active
       (ballooned)                                                              (no stat)
                                     zipped       write         shared
       guest physical memory         zipped - zipSaved            shared savings (no stat)

       <unallocated or                                            <unallocated or used by other
       used by other      overhead         consumed                      VMs> (no stat)
       VMs> (no stat)
       host physical memory

                clusterServices.effectivemem (aggregated over all hosts in cluster)
Host

 sysUsage        consumed       shared common                                                 Service
                                                                                             console
                                                                    unreserved
                                                                                             (no stat)
 reserved

 host physical memory                                                            * Figure not to scale!


 160
Using Host and Guest Memory Usage

!  Useful for quickly analyzing VM’s status
 •  Coarse-grained information
 •  Important for prompting further investigation
!  Requires understanding of memory management concepts
 •  Many aspects of host/guest memory interaction not obvious


161
VI Client: VM list summary


Host CPU: avg. CPU utilization for Virtual Machine
Host Memory: consumed memory for Virtual Machine
Guest Memory: active memory for guest


162
Host and Guest Memory Usage


163
VI Client

!  Main page shows “consumed” memory (formerly “active” memory)
!  Performance charts show important statistics for virtual machines
 •  Consumed memory
 •  Granted memory
 •  Ballooned memory
 •  Shared memory
 •  Swapped memory
      •  Swap in
      •  Swap out


164
VI Client: Memory example for Virtual Machine


                          Increase in swap activity


       No swap activity                                Swap in
                                                                      Balloon & target


                                                                 Swap out

                                                            Consumed & granted
                                            Active memory

                                                      Swap usage


165
esxtop memory screen (m)

                                          Possible states:
                                          High,
                                          Soft, hard and
                                          low


      PCI Hole
COS               VMKMEM


 Physical Memory (PMEM)


VMKMEM - Memory managed by VMKernel
COSMEM - Memory used by Service Console


166
esxtop memory screen (m)

                                                                    Swapping activity in
                                                                    Service Console


                                                                          VMKernel Swapping
                                                                          activity


      SZTGT : determined by reservation, limit and memory shares
      SWCUR = 0 : no swapping in the past
      SWTGT = 0 : no swapping pressure                           SZTGT = Size target
      SWR/S, SWR/W = 0 : No swapping activity currently          SWTGT = Swap target
                                                                 SWCUR = Currently swapped
                                                                 MEMCTL = Balloon driver
                                                                 SWR/S = Swap read /sec
                                                                 SWW/S = Swap write /sec


167
Compression stats (new for 4.1)


COWH : Copy on Write Pages hints – amount of memory in MB that are potentially
shareable
CACHESZ: Compression Cache size
CACHEUSD: Compression Cache currently used
ZIP/s, UNZIP/s: Memory compression/decompression rate


168
Troubleshooting memory related problems (using 4.1 latencies)


%LAT_C : %time the VM was not scheduled due to CPU resource issue

%LAT_M : %time the VM was not scheduled due to memory resource issue

%DMD : Moving CPU utilization average in the last one minute

EMIN : Minimum CPU resources in MHZ that the VM is guaranteed to get
when there is CPU contention


169
Troubleshooting memory related problems

!  Swapping


                                                VM with          Swapped in
                   MCTL: N - Balloon driver     Balloon driver   the past but   Swap target is more
         Memory    not active, tools probably                    not actively   for the VM without the
         Hog VMs                                swaps less
                   not installed                                 swapping now   balloon driver


   170
Additional Diagnostic Screens for ESXTOP

!  CPU Screen
  •  PCPU USED(%) – the CPU utilization per physical core or SMT
  •  PCPU UTIL(%) – the CPU utilization per physical core or SMT thread
  •  CORE UTIL(%) - GRANT (MB): Amount of guest physical memory mapped to a resource pool or
       virtual machine. Only used when hyperthreading is enabled.
  •  SWPWT (%) - Percentage of time the Resource Pool/World was waiting for the ESX VMKernel
       swapping memory. The %SWPWT (swap wait) time is included in the %WAIT time.

!  Memory Screen
  •  GRANT (MB) - Amount of guest physical memory mapped to a resource pool or virtual machine.
       The consumed host machine memory can be computed as "GRANT - SHRDSVD".

!  Interrupt Screen (new)
  •  Interrupt statistics for physical devices


 171
Memory Performance

!  Increasing a VM’s memory on a NUMA machine
 •  Will eventually force some memory to be allocated from a remote node, which will
      decrease performance
 •  Try to size the VM so both CPU and memory fit on one node


                     Node 0                            Node 1


172
Memory Performance

!  NUMA scheduling and memory placement policies in ESX 3 manages all
 VMs transparently
 •  No need to manually balance virtual machines between nodes
 •  NUMA optimizations available when node interleaving is disabled
!  Manual override controls available
 •  Memory placement: 'use memory from nodes'
 •  Processor utilization: 'run on processors'
 •  Not generally recommended
!  For best performance of VMs on NUMA systems
 •  # of VCPUs + 1 <= # of cores per node
 •  VM memory <= memory of one node


173
Memory Performance

!  Page tables
 •  ESX cannot use guest page tables
      •  ESX Server maintains shadow page tables
      •  Translate memory addresses from virtual to machine   VA
      •  Per process, per VCPU
 •  VMM maintains physical (per VM) to machine maps
 •  No overhead from “ordinary” memory references


!  Overhead                                                   PA
 •  Page table initialization and updates
 •  Guest OS context switching


                                                              MA


174
Large Pages

!  Increases TLB memory coverage                    Performance Gains
 •  Removes TLB misses, improves efficiency
!  Improves performance of
 applications that are sensitive to           12%

 TLB miss costs
                                              10%
!  Configure OS and application to
 leverage large pages
                                              8%
 •  LP will not be enabled by default
                                              6%


                                              4%


                                              2%


                                              0%
                                                                    Gain (%)


175
Large Pages and ESX Version


!  ESX 3.5: Large pages enabled manually for guest operations only
!  ESX 4.0:
  •  With EPT/RVI: all memory backed by large pages
  •  Without EPT/RVI: manually enabled, liked ESX 3.5

                             Host Small Pages           Host Large Pages

Guest Small Pages            Baseline Performance       Efficient kernel
                                                        operations, improved
                                                        TLB for guest operations


Guest Large Pages            Improved page table        Improved page table,
                             performance                improved TLB

176
Memory Performance


  !  ESX memory space overhead
      •  Service Console: 272 MB
      •  VMkernel: 100 MB+
      •  Per-VM memory space overhead increases with:
        •  Number of VCPUs
        •  Size of guest memory
        •  32 or 64 bit guest OS


  !  ESX memory space reclamation
      •  Page sharing
      •  Ballooning


177
Memory Performance


      !  Avoid high active host memory over-commitment
       •  Total memory demand = active working sets of all VMs
                                + memory overhead
                                – page sharing
       •  No ESX swapping: total memory demand < physical memory


      !  Right-size guest memory
       •  Define adequate guest memory to avoid guest swapping
       •  Per-VM memory space overhead grows with guest memory


178
Memory Space Overhead

!  Additional memory required to run a guest
       •    Increases with guest memory size
       •    Increases with the virtual CPU count
       •    Increases with the number of running processes inside the guest


                           max
                                                      Swap reservation

       Guest memory        min


                                 Guest             Touched memory


                                                         Fixed memory overhead used during
Overhead memory                                          admission control
                                                   Variable overhead, grows with active
                                                   processes in the guest


 179
Memory Space Overhead: Reservation

!  Memory Reservation
  •    Reservation guarantees that memory is not swapped
  •    Overhead memory is non-swappable and therefore it is reserved
  •    Unused guest reservation cannot be used for another reservation
  •    Larger guest memory reservation could restrict overhead memory growth
       •    Performance could be impacted when overhead memory is restricted


                                max
                                            unused               Swap reservation
                                 min
            Guest memory                    unused
                                                                 Guest reservation
                                       Guest

       Overhead memory                                           Overhead reservation


180
Reducing Memory Virtualization Overhead

!  Basic idea
  •  Smaller is faster (but do not undersize the VM) #


!  Recommendations
  •  Right size VM
      •  avoids overhead of accessing HIGHMEM (>786M) and PAE pages (>4G) in 32-bit VMs
      •  Smaller memory overhead provides room for variable memory overhead growth

  •  UP VM
      •  Memory virtualization overhead is generally lesser
      •  Smaller memory space overhead

  •  Tune Guest OS/applications
      •  Prevent/reduce application soft/hard page faults
      •  Pre-allocate memory for applications if possible


181
I/O AND STORAGE


182
Introduction


                                                                     iSCSI and NFS are growing
                                                        File         To be popular, due to their
                                         TCP/IP        System
             Guest                                                   low port/switch/fabric costs

                                                                     Virtualization provides the
                                                                     ideal mechanism to
                                                                     transparently adopt iSCSI/NFS
                                    Monitor

                                                                     Guests don’t need iSCSI/NFS
                                      Virtual NIC     Virtual SCSI   Drivers: they continue to see
                                                                     SCSI
                        Memory
 VMkernel                            Virtual Switch     iSCSI
            Scheduler   Allocator
                                                          Or
                                                         NFS
                                                                     VMware ESX 3 provides high
                                     NIC Drivers                     Performance NFS and iSCSI
                                                                     Stacks

                                                                     Futher emphasis on 1Gbe/
                                                                     10Gbe performance
Physical
Hardware


183
Asynchronous I/O (4.0)


                                 Application
                                                             On-loads I/O processing to
                                                             additional cores
                                                File
                            OS Sched           System
             Guest                                           Guest VM issues I/O and
                                                             continues to run immediately
                                  vCPUs        pvscsi
                                                             VMware ESX asynchronously
                                 Monitor                     issues I/Os and notifies the
                                                             VM upon completion
                                                pvscsi
                                                             VMware ESX can process
  VMkernel           Scheduler                               Multiple I/Os in parallel on
                                               File System
                                                             separate cpus
                                               I/O Drivers
                                                             Significantly Improves IOPs and
                                                             CPU efficiency

  Physical
  CPUs


184
Device Paravirtualization (4.0)


Device Paravirtualization places
                                                                                           File
A high performance virtualization-                                                        System
Aware device driver into the guest               Guest                     TCP/IP


                                                                                           pvscsi
                                                                            vmxnet
Paravirtualized drivers are more
CPU efficient (less CPU over-
head for virtualization)                                                Monitor


Paravirtualized drivers can                                                 vmxnet           pvscsi

also take advantage of HW
                                                            Memory
                                     VMkernel                            Virtual Switch
features, like partial offload                  Scheduler   Allocator                     File System
(checksum, large-segment)
                                                                         NIC Drivers      I/O Drivers
VMware ESX uses para-
virtualized network drivers

vSphere 4 now provides pvscsi
                                     Physical
                                     Hardware


185
Storage – Fully virtualized via VMFS and Raw Paths


                                                           Guest OS           Guest OS

                       Guest OS
                                                     /dev/hda                         /dev/hda

                              /dev/hda        VMFS              vm1.vmdk   vm2.vmdk


                                FC LUN                                         FC or iSCSI
                                                                               LUN
! RAW                                       ! VMFS
! RAW provides direct access to             ! Easier provisioning
a LUN from within the VM                    ! Snapshots, clones possible
! Allows portability between physical and   ! Leverage templates and quick
                                            provisioning
virtual
                                            ! Scales better with Consolidated Backup
! RAW means more LUNs
                                            ! Preferred Method
  •  More provisioning time
! Advanced features still work


  186
How VMFS Works

                          VM#1#(Alice)#              VM#2#(Bob)#

                   Microsoft Office           Microsoft Office

            outlook.exe                   outlook.exe

              Guest Filesystem             Guest Filesystem


                         /vms/vm1                                /vms/vm2
          VMFS
           Files

                                 VMFS


           Physical
            Disk
                                              FC or iSCSI
                                              LUN


187
VMFS Clones and Snapshots

                             VM#1#(Alice)#              VM#2#(Bob)#

                      Microsoft Office           Microsoft Office

                 outlook.exe                 outlook.exe

                  Guest Filesystem            Guest Filesystem


                  Linked
                   Clone
       Specialized Blocks
             (Redo Logs)
            Common OS
               Base Disk


                Physical
                   Disk


188
I/O Performance

!  Disk performance is dependent on many factors:
      •  Filesystem performance
      •  Disk subsystem configuration (SAN, NAS, iSCSI, local disk)
      •  Disk caching
      •  Disk formats (thick, sparse, thin)


!  ESX is tuned for Virtual Machine I/O
!  VMFS clustered filesystem => keeping consistency imposes some
 overheads


189
Disk Fundamentals

!  Disk performance is impacted by Bandwidth and I/O demands
!  Sequential accesses to disk are bandwidth limited
 •  ~70MBytes/sec for a SATA disk
 •  ~150Mbytes/sec for a 15k RPM FC disk
!  Random Accesses to disk are dominated by seek/rotate
 •  10k RPM Disks: 150 IOPS max, ~80 IOPS Nominal
 •  15k RPM Disks: 250 IOPS max, ~120 IOPS Nominal
!  Typically hidden behind an array
 •  ESX sees LUN latency
 •  Exception is local-disk


190
Disk Arrays

!  Lowest level resource is disk
 •  150 IOPS, 70-150MByte/sec                      VMware ESX

!  Disks are aggregated into LUNS
                                            HBA1   HBA2    HBA3    HBA4
 •  Increase performance and availability
!  LUNS can be (should be) cached
                                                     FC Switch
 •  Read caches or write caches
 •  Write caches hide wait-for-write
                                               LUN               LUN
!  Disk arrays share FC Connections
 •  Typically 200 or 400MBytes/sec
                                              Read         Write
                                              Cache        Cache


191
It’s important to understand caches when observing I/O


                                  "   Caches attempt to eliminate I/Os
             Database Cache
                                       "   The best I/O is the one you don’t
                                           do
          Guest OS
                                  "   Caches are at multiple layers:
           Cache
                                       "   Application
                       /dev/hda
                                       "   Guest-OS
               Controller
                Cache                  "   Disk-array
                                  "   Q: What’s the impact on the number
                                      of disks if we improve cache hit rates
                                      from 90% to 95%?
                                       "   10 in 100 => 5 in 100…
                                       "   #of disks reduced by 2x!


192
Observing I/O Performance: Important I/O Terminology


                                                              File
                                              TCP/IP         System
      Service
                  Guest
      Console
                                                                            Virtual Disk
                                                                            VMHBA
       Monitor                           Monitor


                                         vNIC (e1000..)    SCSI (LSI etc)


                             Memory
      VMkernel
                             Allocator
                                          Virtual Switch      VMFS
                 Scheduler


                                          NIC Drivers      I/O Drivers


      Physical
      Hardware                                                               HBA


                                                                             Physical Disk


193
Disk Latencies Explained


             Application

                                                       A = Application Latency
               File
              System                               A
Guest
                                                       R = Perfmon
             I/O Drivers      Windows
                                               R       Physical Disk
                            Device Queue               “Disk Secs/transfer”

                                           S           S = Windows
                                                       Physical Disk Service Time

             Virtual SCSI
                                       G
                                                       G = Guest Latency

 VMkernel      VMFS
                                K
                                                       K = ESX Kernel
               Drivers


                                D                      D = Device Latency


194
Let’s look at the vSphere client…


                                    Rule of thumb:
                                    latency > 20ms is
                                    Bad.
                                    Here:
                                    1,100ms
                                    REALLY BAD!!!


195
A Word About Units in vSphere

Operation throughput: commands per refresh interval (not IOPS)
Bandwidth in KBps (not MBps)


                  255.46 MBps = 258971 KBps


      Real-time chart: refresh 20s. 16349 IOPS = 323745 commands/20s
196
Disk Latencies


                     (screenshot of esxtop)


                      Latency seems high


                 After enabling cache,
                 latency is much better

197
esxtop disk adapter screen (d)


      Host bus adapters (HBAs) -
      includes SCSI, iSCSI, RAID, and           Latency stats from the
      FC-HBA adapters                           Device, Kernel and the Guest


                   DAVG/cmd - Average latency (ms) from the Device (LUN)
                   KAVG/cmd - Average latency (ms) in the VMKernel
                   GAVG/cmd - Average latency (ms) in the Guest


198
esxtop disk device screen (u)


         LUNs in C:T:L format


                                C:T:L - Controller: Target: Lun


199
esxtop disk VM screen (v)


                            running VMs


200
Disk screen (d)

!  SCSI Reservation stats (new in 4.1)


      RESV/s : SCSI reservations per second
      CONS/s: SCSI reservation conflicts per second


201
LUN screen (u)

 VAAI (vStorage API for Array Integration) Stats (new in 4.1)


CLONE_RD, CLONE_WR: Number of Clone read/write requests
CLONE_F: Number of Failed clone operations
MBC_RD/s, MBC_WR/s – Clone read/write MBs/sec
ATS – Number of ATS commands
ATSF – Number of failed ATS commands
ZERO – Number of Zero requests
ZEROF – Number of failed zero requests
MBZERO/s – Megabytes Zeroed per second


202
VM disk screen

 VM disk screen now reports stats using vScsistats (new in 4.1)


 ESX 3.x and 4.x provides this stats by grouping I/Os based on the world ids


203
I/O Latency from NFS Volumes


•  vSphere 4.1 enables latency information for NFS based storage


204
                                                                   K
vScsiStats

!  Disk I/O characterization of applications is the first step in tuning disk
   subsystems; key questions:
   •  I/O block size
   •  Spatial locality
   •  I/O interarrival period
   •  Active queue depth
   •  Latency
   •  Read/Write Ratios
!  Our technique allows transparent and online collection of essential
   workload characteristics
   •  Applicable to arbitrary, unmodified operating systems running in virtual machines


 205
Workload Characterization Technique


"     Histograms of observed data values can be much more
      informative than single numbers like mean, median, and
      standard deviations from the mean
      "   E.g., multimodal behaviors are easily identified by plotting a histogram, but
           obfuscated by a mean
"     Histograms can actually be calculated efficiently online
"     Why take one number if you can have a distribution?


                                                         Made up Example
                       2500


                       2000


                       1500


                       1000


                         500
                       Frequency


                                   0

Mean is 5.3!
                                       1


                                           2


                                               3


                                                     4


                                                                5


                                                                           6


                                                                                      7


                                                                                            8


                                                                                                9


                                                                                                    10
                                                   Latency of an operation (microseconds)


206
Workload Characterization Technique

!  The ESX disk I/O workload
  characterization is on a per-virtual disk
  basis
  •  Allows us to separate out each different type
       of workload into its own container and observe         Data
                                                         collected
       trends
                                                        per-virtual
!  Histograms only collected if enabled; no                   disk
  overhead otherwise
!  Technique:
  •  For each virtual machine I/O request in ESX,
       we insert some values into histograms
       •  E.g., size of I/O request → 4KB


             6
             4
             2
             0
                  1024


                           2048


                                    4096


                                            8192


 207
Workload Characterization Technique
Full List of Histograms
!  Read/Write Distributions are available for         !  I/O Size
 our histograms
                                                        •  All, Reads, Writes
 •  Overall Read/Write ratio?
                                                      !  Seek Distance
 •  Are Writes smaller or larger than Reads in this
      workload?                                         •  All, Reads, Writes
 •  Are Reads more sequential than Writes?            !  Seek Distance Shortest
 •  Which type of I/O is incurring more latency?        Among Last 16

!  In reality, the problem is not knowing             !  Outstanding IOs
 which question to ask                                  •  All, Reads, Writes
 •  Collect data, see what you find
                                                      !  I/O Interarrival Times
                                                        •  All, Reads, Writes
                                                      !  Latency
                                                        •  All, Reads, Write


208
Workload Characterization Technique
Histograms Buckets
!  To make the histograms practical, bin sizes are on rather irregular scales
 •  E.g., the I/O length histogram bin ranges like this:
      •  …, 2048, 4095, 4096, 8191, 8192, … rather odd: some buckets are big and others are as small
       as just 1
      •  Certain block sizes are really special since the underlying storage subsystems may optimize for
       them; single those out from the start (else lose that precise information)
      •  E.g., important to know if the I/O was
       16KB or some other size in the
       interval (8KB,16KB)


                                                                                                                     I/O Length Histogram
                                                                     3500
                                                                     3000
                                                                     2500
                                                                     2000
                                                         Frequency   1500
                                                                     1000
                                                                      500
                                                                        0
                                                                            512
                                                                                  1024
                                                                                         2048
                                                                                                4095
                                                                                                       4096
                                                                                                              8191
                                                                                                                     8192
                                                                                                                            16383
                                                                                                                                    16384
                                                                                                                                            32768
                                                                                                                                                    49152
                                                                                                                                                            65535
                                                                                                                                                                    65536
                                                                                                                                                                            81920
                                                                                                                            Length (bytes)


209
Filebench OLTP (Solaris)

!  Filebench is a model-based workload generator for file systems
 developed by Sun Microsystems
 •  Input to this program is a model file that specifies processes, threads in a workflow
!  Filebench OLTP “personality” is a model to emulate an Oracle database
 server generating I/Os under an online transaction processing workload
 •  Other personalities include fileserver, webserver, etc.
!  Used two different filesystems (UFS and ZFS)
 •  To study what effect a filesystem can have on I/O characteristics
 •  Ran filebench on Solaris 5.11 (build 55)


210
I/O Length
Filebench OLTP
                                                                                               I/O Length Histogram
                                            3500
                                            3000
                                            2500
                                            2000


                               Frequency
                                            1500
                         UFS                1000
                                             500
                                               0


                                                   512
                                                         1024
                                                                2048
                                                                        4095
                                                                                4096
                                                                                       8191
                                                                                               8192
                                                                                                       16383
                                                                                                                16384
                                                                                                                         32768
                                                                                                                                  49152
                                                                                                                                           65535
                                                                                                                                                    65536
                                                                                                                                                             81920
                                                                                                                                                                      131072
                                                                                                                                                                                262144
                                                                                                                                                                                          524288
                                                                                                                                                                                                     >524288
"     4K and 8K I/O
      transformed into                                                                                 Length (bytes)
      128K by ZFS?                                                                            I/O Length Histogram
                                            1600
                                            1400
                                            1200
                                Frequency


                                            1000
                                             800

                         ZFS                 600
                                             400
                                             200
                                               0
                                                         1024
                                                                 2048
                                                                         4095
                                                                                4096
                                                                                        8191
                                                                                                8192
                                                   512


                                                                                                        16383
                                                                                                                 16384
                                                                                                                          32768
                                                                                                                                   49152
                                                                                                                                            65535
                                                                                                                                                     65536
                                                                                                                                                              81920
                                                                                                                                                                       131072
                                                                                                                                                                                 262144
                                                                                                                                                                                            524288
                                                                                                                                                                                                       >524288
                                                                                                         Length (bytes)


211
Seek Distance
Filebench OLTP
                                                                                                   Seek Distance Histogram
                                           1400
                                           1200
                                           1000
"     Seek distance: a


                               Frequency
                                            800
      measure of                            600
      sequentiality      UFS                400
      versus randomness                     200
      in a workload                           0


                                                                                                                     0
                                                                                                                          2
                                                                                                                               6
                                                                                                          -6
                                                                                                                -2


                                                                                                                                     16
                                                                                                                                           64
                                                                                            -64
                                                                                                   -16


                                                                                                                                                  500
                                                                                    -500


                                                                                                                                                          5000
                                                                           -5000


                                                                                                                                                                    50000
                                                                -50000


                                                                                                                                                                             500000
                                                    -500000
"     Somehow a random
      workload is                                                                                              Distance (sectors)
      transformed into a
                                                                                                   Seek Distance Histogram
      sequential one by                    300
      ZFS!                                 250

"     More details                         200
                               Frequency


      needed ...         ZFS               150

                                           100

                                            50

                                             0
                                                                                                         -6

                                                                                                               -2

                                                                                                                     0

                                                                                                                         2
                                                                                                                              6

                                                                                                                                    16

                                                                                                                                          64
                                                                                   -500

                                                                                           -64

                                                                                                  -16


                                                                                                                                                        5000
                                                                                                                                                500
                                                              -50000

                                                                         -5000


                                                                                                                                                                 50000
                                                                                                                                                                         500000
                                                  -500000


                                                                                                              Distance (sectors)


212
Seek Distance
Filebench OLTP—More Detailed

                                                                                                                                                                          Split out reads & writes

                                                                        Seek Distance Histogram (Writes)                                                                                                         Seek Distance Histogram (Reads)
                    1200                                                                                                                                           600

                    1000                                                                                                                                           500
                     800
       Frequency


                                                                                                                                                                   400


                                                                                                                                                    Frequency
                     600
                                                                                                                                                                   300
                     400
UFS                  200
                                                                                                                                                                   200

                                                                                                                                                                   100
                          0
                                                                                                                                                                     0
                                                                                              0
                                                                                                  2
                                                                                                       6
                                                                                  -6
                                                                                         -2


                                                                                                            16
                                                                                                                 64
                                                                      -64
                                                                            -16


                                                                                                                      500
                                                               -500


                                                                                                                            5000
                                                      -5000


                                                                                                                                   50000
                                            -50000


                                                                                                                                           500000
                                -500000


                                                                                                                                                                                                                                                          64
                                                                                                                                                                                                        -500


                                                                                                                                                                                                                                           2

                                                                                                                                                                                                                                                6
                                                                                                                                                                                                                                                     16
                                                                                                                                                                                                               -64
                                                                                                                                                                                                                     -16

                                                                                                                                                                                                                           -6

                                                                                                                                                                                                                                 -2
                                                                                                                                                                                                                                       0
                                                                                                                                                                                     -50000


                                                                                                                                                                                                                                                               500
                                                                                                                                                                                                                                                                     5000
                                                                                                                                                                                               -5000


                                                                                                                                                                                                                                                                            50000

                                                                                                                                                                                                                                                                                    500000
                                                                                                                                                                         -500000
                                                                                       Distance (sectors)                                                                                                                       Distance (sectors)


                                                                        Seek Distance Histogram (Writes)                                                                                                         Seek Distance Histogram (Reads)
                    300                                                                                                                                            300

                    250                                                                                                                                            250

                    200                                                                                                                                            200


                                                                                                                                                       Frequency
        Frequency


ZFS
                    150                                                                                                                                            150

                    100                                                                                                                                            100

                     50                                                                                                                                             50

                      0                                                                                                                                              0
                                                                                  -6
                                                                                        -2
                                                              -500


                                                                                              0
                                                                                                  2

                                                                                                      6

                                                                                                            16
                                                                                                                 64
                                                                      -64
                                                                            -16


                                                                                                                            5000
                                          -50000


                                                                                                                      500
                                                     -5000


                                                                                                                                   50000

                                                                                                                                           500000
                              -500000


                                                                                                                                                                                                                                                          64
                                                                                                                                                                                                        -500


                                                                                                                                                                                                                                       0
                                                                                                                                                                                                                                           2

                                                                                                                                                                                                                                                6
                                                                                                                                                                                                                                                     16
                                                                                                                                                                                                               -64
                                                                                                                                                                                                                     -16
                                                                                                                                                                                                                           -6

                                                                                                                                                                                                                                  -2


                                                                                                                                                                                                                                                               500
                                                                                                                                                                                                                                                                     5000
                                                                                                                                                                                      -50000

                                                                                                                                                                                                -5000


                                                                                                                                                                                                                                                                            50000

                                                                                                                                                                                                                                                                                    500000
                                                                                                                                                                           -500000
                                                                                       Distance (sectors)                                                                                                                       Distance (sectors)


 "    Transformation from Random to Sequential: primarily for Writes
 "    Reads: Seek distance is reduced (look at histogram shape & scales)


213
Filebench OLTP
Summary
!  So, what have we learnt about Filebench OLTP?
 •  I/O is primarily 4K but 8K isn’t uncommon (~30%)
 •  Access pattern is mostly random
      •  Reads are entirely random
      •  Writes do have a forward-leaning pattern
 •  ZFS is able to transform random Writes into sequential:
      •  Aggressive I/O scheduling
      •  Copy-on-write (COW) technique (blocks on disk not modified in place)
      •  Changes to blocks from app writes are written to alternate locations
      •  Stream otherwise random data writes to a sequential pattern on disk
!  Performed this detailed analysis in just a few minutes


214
vscsiStats

# vscsiStats -l


                       World group      Virtual Machine
                       leader id        Name


                  Virtual scsi disk
                  handle ids - unique
                  across virtual
                  machines


215
vscsiStats – latency histogram

 # vscsiStats -p latency -w 118739 -i 8205


                                             Latency in
                                             microseconds
I/O distribution
count


216
vscsiStats – iolength histogram

  # vscsiStats -p iolength -w 118739 -i 8205


                                               I/O block size


Distribution
Count


 217
Storage Recommendations


!  The fundamental relationship
  between consumption and supply
  has not changed
  •  Spindle count and RAID configuration
      still rule
  •  But host demand is an aggregate of
      VMs
!  What is the impact of virtual disk
  consolidation
  •  Full isolation
  •  Shared VMFS


                                            VMFS


218
                                                   K
Differences in VMs

!  VMware deployments
  •  Large set of physical machines consolidated
  •  Diverse set of applications
!  Workload characteristics
  •  Different IO patterns to the same volume, or
  •  IO from one app split to different volumes
  •  Provisioning operations along with applications (Create VM,
       Power On VM)
!  Hypervisor and the storage subsystem
  •  Clustered file system locking
  •  CPU and virtual device emulation can impact storage
       performance
!  System setup can affect performance
  •    Partition alignment affects performance.
  •    Raw Device Mapping or File system
  •    New Hardware Assist technology
  •    CPU and memory affinity settings


 219
Disk Fundamentals

!  Databases are mostly random I/O access patterns
!  Accesses to disk are dominated by seek/rotate
 •  10k RPM Disks: 150 IOPS max, ~80 IOPS Nominal
 •  15k RPM Disks: 250 IOPS max, ~120 IOPS Nominal
!  Database Storage Performance is controlled by two primary factors
 •  Size and configuration of cache(s)
 •  Number of physical disks at the
      back-end


220
Disk Performance

!  Higher sequential
 performance (bandwidth)
 on the outer tracks


221
Disk Arrays

!  Lowest level resource is disk
 •  150 IOPS, 70-150MByte/sec                      VMware ESX

!  Disks are aggregated into LUNS
                                            HBA1   HBA2    HBA3    HBA4
 •  Increase performance and availability
!  LUNS can be (should be) cached
                                                     FC Switch
 •  Read caches or write caches
 •  Write caches hide wait-for-write
                                               LUN               LUN
!  Disk arrays share FC Connections
 •  Typically 200 or 400MBytes/sec
                                              Read         Write
                                              Cache        Cache


222
LUN Sizing and Its Impact On Load

!  In example on the right, ESX B can
  generate twice as much IO as ESX A
!  Improved aggregate throughput of          VM a     VM b   VM c     VM d
  multiple LUNs is the primary reason
  for thinking RDM is faster
!  Implications for the array                   32           32      32
  •  Greater number of smaller LUNs             …            …       …
      increases burst intensity
                                                2            2       2
       •  Many HBA/LUN pairs could be used
        simultaneously                          1            1       1
  •  Smaller number of LUNs stabilizes
      demand
      •  Fewer HBA/LUN pairs will be used     ESX A          ESX B
        concurrently


                                             VMFS


223
                                                                             S
Storage – VMFS or RDM


                                                           Guest OS           Guest OS

                       Guest OS
                                                     /dev/hda                         /dev/hda

                              /dev/hda        VMFS              vm1.vmdk   vm2.vmdk


                                FC LUN                                         FC or iSCSI
                                                                               LUN
! RAW                                       ! VMFS
! RAW provides direct access to             ! Easier provisioning
a LUN from within the VM                    ! Snapshots, clones possible
! Allows portability between physical and   ! Leverage templates and quick
                                            provisioning
virtual
                                            ! Scales better with Consolidated Backup
! RAW means more LUNs
                                            ! Preferred Method
  •  More provisioning time
! Advanced features still work


  224
VMFS vs. RDM Performance


225
Creating VM: Disk Type?


      When to allocate disk space?
As needed                 Creation Time


 Thin Disk                  Zeroed?
                    No                    Yes


       Thick Disk                                When?
                                Creation Time            First Use


                            Eager Zeroed Thick           Zeroed Thick


226
Creating VM: Disk Type?

!  Speed Vs Space
 •  Thin disk is space efficient but higher per IO overhead
 •  Thick disk has lower per IO overhead but consumes space
 •  Zeroed thick disk pays extra write cost at the first write
 •  Eager zeroes thick disk or thick disk gives best performance
 •  Use vmkfstool to create or convert
!  RDM Vs VMFS
 •  Physical RDM disables VMotion
 •  VMFS performance is close to the RDM


227
VMDK Lazy Zeroing


!  Default VMDK allocation policy                                Effect of Zeroing on Storage
 “lazy zeroes” 1M VMFS blocks on                                         Performance
 first write
                                                           200
!  Writes on an untouched VMDK incur                       180
 a penalty
                                                           160
!  Difference usually not seen in                          140


                                       Throughput (MBps)
 production                                                120
 •  But common with benchmarks                             100

!  Zero offload capability in VAAI                          80
 improves zeroing in supported                              60
 arrays                                                     40
                                                            20
                                                             0
                                                                 1 host 2 hosts 4 hosts 8 hosts    16
                                                                                                  hosts


                                                                       "Post-zeroing"      "Zeroing"


228
                                                                                                          K
Thin Provisioning Performance


!  vSphere introduced thin                                              Thin Versus
  provisioned VMDKs                                                   Thick Scalability
!  In theory, LUN locking during                            200
  VMDK growth might hurt                                    180
  performance                                               160

!  In reality, zeroing more impactful


                                        Throughput (MBps)
                                                            140
  than locking                                              120

!  ATS and zero-offloading in VAAI                          100

  enabled arrays will speed up                               80
  “first-writes”                                             60
                                                             40
                                                             20
                                                              0
                                                                  1 host 2 hosts 4 hosts 8 hosts     16
                                                                                                    hosts

                                                            Thick post-zeroing       Thin post-zeroing
                                                            Thick zeroing            Thin zeroing


229
                                                                                                            K
Device Paravirtualization (4.0)


Device Paravirtualization places
                                                                                           File
A high performance virtualization-                                                        System
Aware device driver into the guest               Guest                     TCP/IP


                                                                                           pvscsi
                                                                            vmxnet
Paravirtualized drivers are more
CPU efficient (less CPU over-
head for virtualization)                                                Monitor


Paravirtualized drivers can                                                 vmxnet           pvscsi

also take advantage of HW
                                                            Memory
                                     VMkernel                            Virtual Switch
features, like partial offload                  Scheduler   Allocator                     File System
(checksum, large-segment)
                                                                         NIC Drivers      I/O Drivers
VMware ESX uses para-
virtualized network drivers

vSphere 4 now provides pvscsi
                                     Physical
                                     Hardware


230
PVSCSI Architecture

!  PVSCSI looks like a PCI-E device to the guest OS
!  Uses MSI or MSI-X interrupt delivery (instead of legacy INTx) to reduce the
 cost of interrupt virtualization
!  Boot capable
!  New Windows/Linux SCSI HBA drivers
!  Windows driver uses the Storport driver model
!  Exports itself as a Serial Attached SCSI adapter


231
Enabling the PVSCSI Driver


232
PVSCSI Efficiency


                    PVSCSI Efficiency Improvements for 4K Block IOs
        1.2


         1


        0.8


        0.6


        0.4


        0.2


         0
                        S/W iSCSI                           Fibre Channel
                                            Protocol


                                       LSI Logic   pvscsi


233
Benchmarks for I/O

!  Microbenchmarks
 •  Iometer          Macrobenchmarks
 •  Aiostress
                     "   TPC-C/E
 •  Filebench
                     "   MS Exchange
 •  Orion
 •  Sqliosim         "   Oracle
 •  Jetstress        "   SQLserver
                     "   Etc…


234
Storage Contention Problems

!  In vSphere 4, an isolated VM can
                                                  Without Storage IO Control
 dominate a shared LUN                            Actual Disk Resources utilized by each VM
                                                  are not in the correct ratio
 •  IO shares determine access to LUN
      relative to other VMs on the same host   VM A                            VM B                                   VM C
                                               1500                            500                                    500
 •  A VM can get uncontested access to the     Shares                          Shares                                 Shares


      device queue negatively affecting VMs     ESX Server                                     ESX Server
      that share the LUN but are running on
                                                   12                                             12
      other ESX hosts                                                   25 %
 •  Regardless of shares, VMs on the same


                                                                                                 device queue depth
                                                   device queue depth
      host contend for one queue
                                                                                                                      100 %
                                                                        75%

!  Existing storage resource
 management controls only affects                          0                                             0

 VMs on a single host

                                                  38%                                   12%   50 %

                                                                        Storage Array Queue


235
                                                                                                                               S
Storage Contention Solution: Storage IO Control

!  SIOC calculates data store latency           With Storage IO Control
                                                Actual disk resources utilized by each VM
 to identify storage contention                 are in the correct ratio even across ESX Hosts

 •  Latency is normalized, averaged across
      virtual machines                         VM A                            VM B                VM C
                                               1500                            500                 500
 •  IO size and IOPS included                  Shares                          Shares              Shares


                                                ESX Server                                 ESX Server
!  SIOC enforces fairness when data
 store latency crosses threshold                   24

                                                                        25 %
 •  Default of 30 ms
 •  Sustained for four seconds


                                                   device queue depth
 •  Fairness enforced by limiting VMs access
      to queue slots                                                    75%
                                                                                               6

!  Can have small detrimental effect                                                                100 %
 on throughput at LUN                                      0                                   0


                                                 60%                                           20% 20%

                                                                         Storage Array Queue


236
                                                                                                            S
Notes and Caveats on SIOC

!  SIOC is not a storage panacea
 •  Important VMs can be protected
 •  Poorly performing storage remains poorly performing, and the infrastructure suffers!
!  SIOC trades throughput for latency
 •  The feature is enabled when latency crosses a certain threshold, implying a storage
      bottleneck
 •  Throughput is throttled for less performance critical VMs to provide fast access to high
      priority VMs
!  SIOC may make some of your happy application owners unhappy
 •  Your current configuration may allow storage hogs to lock their neighbors out of the
      array
 •  When you enable SIOC, these “bad neighbors” will be throttled


237
                                                                                               S
NETWORKING


238
VMware ESX Networking Architecture


                                                        File
                                                       System
                                                                     Virtual NIC Device
                                         TCP/IP
               Guest                                                 •  Full Virt: e1000g
                                                                     •  Paravirt: vmxnet2,
                                                                     •  vSphere adds vmxnet3


                                     Monitor


                                      Virtual NIC     Virtual SCSI


  VMkernel
                         Memory
                                     Virtual Switch   iSCSI/NFS       TCP/IP Stack
             Scheduler   Allocator                                    •  For vMotion,iSCSI and NFS
                                                                      •  New v2 Stack for vSphere
                                                        TCP/IP
                                      NIC Drivers


  Physical
  Hardware


239
VM Network I/O Virtualization

!  Guest OS sees a virtual NIC
                                                                         VM
 •  AMD Lance, Intel e1000, or VMware vmxnet
      •  Virtual devices acting just like physical one (except vmxnet)
 •  Each virtual NIC has a unique MAC address
 •  Up to 4 virtual NICs per VM
!  Virtual NIC enhancements
 •  No physical crystal limiting transmit/receive
 •  Disallow promiscuous mode
 •  Disallow MAC address changes by the OS
 •  Disallow forged source MAC transmits


240
ESX Server Networking I/O


                                 VM   VM
                                                        Service
      Virtual NICs                                      Console


                                            VMkernel
                                           Networking
      vSwitches
                      VMkernel

        Uplinks

  Physical NICs
                      Physical
                      Hardware


241
Troubleshooting Networking

!  Troubleshoot one
 component at a time
 •  Physical NICs
                                         ESXi Server
 •  vNetwork Distributed Switch
 •  Virtual NICs
 •  Physical Network
!  Tools for troubleshooting
 •  vSphere Client (aka VI)
 •  Command Line Utilities                                           vNetwork Distributed
      •  vSphere CLI                                                              Switch

                                                           VSwitch
 •  Third party tools
                                          VMKernel
      •  Ping and traceroute
      •  Traffic sniffers and Protocol          Hardware
       Analyzers
         •  Wireshark
 •  Logs


242
Sniffing For Trouble

!  Sniff for packets at different
  layers for isolation                       ESX Server
                                                                                 Capture packet
                                                                                traces inside the
  •  Physical Switch Port Level (SPAN)                                                 VM
  •  VM Level (Promiscuous mode)
!  Look for
  •  Lost Packets
  •  Large number of packet
                                                                    VSwitch
       retransmissions
                                             VMKernel
  •  Anomalies reported by protocol
       analyzers like Wireshark etc.             Hardware


!  Look for patterns
  •  Are packets of a certain type causing
       problems?
                                                                Mirrored Port
  •  Are packets of a certain size causing    Physical Switch
       problems?


 243
Getting Information about the vnic i/o


                               Output of esxtop/resxtop


                               Output of esxcfg-info
                                                             Real time traffic
                                                              information
        Look for Rx/Tx
      information for the
         vNIC you are
         interested in

                                                          Cumulative Traffic
                                                            Information
        Search for the port
       ID of the vNIC in the
        esxcfg-info output


244
Check the physical NIC

!  Check that the right uplinks are connected
 •  Use vSphere client or esxcfg-vswitch –l
!  Check the Rx/Tx counters of the physical nic using esxcfg-info or resxtop
!  Check connected physical port
 •  Use Network Hint or CDP


                                                Information about Uplink Port (vmnic4)


245
VI Client Networking Statistics

!  Mostly high-level statistics
  •  Bandwidth
      •  KBps transmitted, received
      •  Network usage (KBps): sum of TX, RX over all NICs
  •  Operations/s
      •  Network packets received during sampling interval (real-time: 20s)
      •  Network packets transmitted during sampling interval
!  Per-adapter and aggregated statistics


246
Esxtop Networking Statistics

!  Bandwidth
  •  Receive (MbRX/s), Transmit (MbRX/s)
!  Operations/s
  •  Receive (PKTRX/s), Transmit (PKTTX/s)
!  Configuration info
  •  Duplex (FDUPLX), speed (SPEED)
!  Errors
  •  Packets dropped during transmit (%DRPTX), receive (%DRPRX)


 247
esxtop network screen (n)


 Service
 console NIC                         Physical NIC     PKTTX/s - Packets transmitted /sec
                    Virtual NICs                      PKTRX/s - Packets received /sec
                                                      MbTx/s - Transmit Throughput in Mbits/sec
                                                      MbRx/s - Receive throughput in Mbits/sec


  Port ID: every entity is attached to a port on the virtual switch
  DNAME - switch where the port belongs to


248
Multicast/Broadcast stats

 Multicast/Broadcast stats are new for 4.1


 PKTTXMUL/s – Multicast packets transmitted per second
 PKTRXMUL/s – Multicast packets received per second

 PKTTXBRD/s – Broadcast packets transmitted per second
 PKTRXBRD/s – Broadcast packets received per second


249
Platform Optimization: Network

!  Use a network adapter that supports:
 •  Checksum offload, TCP segmentation offload (TSO),
      Jumbo frames (JF)
 •  Enable JF when hardware is available (default is off!)
 •  Capability to handle high memory DMA (64-bit DMA addresses)
 •  Capability to handle multiple scatter/gather elements per Tx frame

!  Check configuration
 •  Ensure host NICs are running with highest supported speed
      and full-duplex
 •  NIC teaming distributes networking load across multiple NICs
      •  Better throughput and allows passive failover
!  Use separate NICs to avoid traffic contention
 •  For Console OS (host management traffic), VMKernel
      (vmotion, iSCSI, NFS traffic), and VMs


250
Jumbo Frames

!  Before transmitting, IP layer fragments data into MTU (Maximum
 Transmission Unit) sized packets
 •  Ethernet MTU is 1500 bytes
 •  Receive side reassembles the data


!  Jumbo Frames
 •  Ethernet frame with bigger MTU
 •  Typical MTU is 9000 bytes
 •  Reduces number of packets transmitted
 •  Reduces the CPU utilization on transmit and receive side


251
Jumbo Frames

                             !  Linux
       Guest (VM)
                               •  ifconfig eth0 mtu 9000
      TCP/IP Stack

                             !  Windows
           vNIC
                               •  Device Manager -> Network
                                adapters -> VMware PCI Ethernet       Client
                                Adapter -> Properties -> Advanced
                       ESX      -> MTU to 9000
                                                                    TCP/IP Stack

      Virtual Switch
                                                                    NIC Driver


                                         Switches/
                                          Routers


252
Jumbo Frames


       Guest (VM)

      TCP/IP Stack            !  esxcfg-vswitch -m 9000 vSwitch1

           vNIC


                                                             Client

                       ESX
                                                           TCP/IP Stack
                             Refer switch/router
      Virtual Switch         configuration guide
                                                           NIC Driver


                                   Switches/
                                   Routers


253
Jumbo Frames


       Guest (VM)            Linux
      TCP/IP Stack           !  ifconfig eth0 mtu 9000

           vNIC
                             Windows
                             !  Device Manager -> Network          Client

                       ESX      adapters -> VMware PCI
                                Ethernet Adapter -> Properties   TCP/IP Stack

      Virtual Switch
                                -> Advanced -> MTU to 9000
                                                                 NIC Driver


                                             Switches/
                                             Routers


254
MTU Size

!  Verify it is not a jumbo frame related issue
  •  Verify that the vnic MTU is the same as the vswitch MTU
  •  Run ping –s <packet size> from the guest


255
Network Traffic Management – Emergence of 10 GigE

                 1GigE NICs                                       10 GigE NICs


                        iSCSI   FT   vMotion   NFS                        iSCSI   FT   vMotion     NFS


                                 TCP/IP                                            TCP/IP


       vSwitch                                         vSwitch


                                                            10 GigE
                                               1GigE                                             Traffic Types compete.
                                                                                                 Who gets what share of
                                                                                                         the NIC?


  •    Dedicated NICs for different traffic types      •      Traffic typically converged to two 10 GigE
       e.g. vMotion, IP storage                               NICs

  •    Bandwidth assured by dedicated NICs             •      Some traffic flows could dominate others
                                                              through oversubscription


256
                                                                                                                     K
Network IO control – Protect your important bandwidth


                                                               !  Without Network IO Control
                                                                •  VM traffic can be impacted by less
                                                                  performance-critical traffic such as
                                                                  vMotion


 !  With Network IO Control
      •  VM traffic is protected and can
       maintain application SLAs
      •  vMotion is designated lower priority
       and can take longer


* Y-Axis shows number of User Sessions that meet SPECweb2005
latency requirements


257
                                                                                                         K
Network I/O Control Architecture

                                                                                   vMotion         FT


                                                                             Mgmt            NFS        iSCSI


                                          vNetwork Distributed Portgroup
                                                              Teaming Policy


                          Load balanced
                                                               Shaper
                             teaming

                                              Scheduler                       Scheduler

                                                          Shares enforcement per             Limit enforcement per
                                                                  uplink                              team


•          Note: NetIOC is only supported with vNetwork Distributed Switch (vDS)
•          Team: Group of NICs used for load balancing and fault tolerance

     258
                                                                                                                 K
CONFIGURING
      WORKLOADS


259
Enterprise Workload Demands vs. Capabilities


                      Workload Requires                vSphere 4

      Oracle 11g      8vcpus for 95% of DBs            8vcpus per VM
                      64GB for 95% of DBs              256GB per VM
                      60k IOPS max for OLTP @          120k IOPS per VM
                      8vcpus                           9900Mbits/sec per VM
                      77Mbits/sec for OLTP @ 8vcpus


      SQLserver       8vcpus for 95% of DBs            8vcpus per VM
                      64GB @ 8vcpus                    256GB per VM
                      25kIOPS max for OLTP @           120k IOPS per VM
                      8vcpus                           9900Mbits/sec per VM
                      115Mbits/sec for OLTP @ 8vcpus


      SAP SD          8vcpus for 90% of SAP Installs   8vcpus per VM
                      24GB @ 8vcpus                    256GB per VM
                      1k IOPS @ 8vcpus                 120k IOPS per VM
                      115Mbits/sec for OLTP @ 8vcpus   9900Mbits/sec per VM


      Exchange        4cpus per VM, Multiple VMs       8vcpus per VM
                      16GB @ 4vcpus                    256GB per VM
260                   1000 IOPS for 2000 users         120k IOPS per VM
                      8Mbits/sec for 2000 users        9900Mbits/sec per VM
Databases: Top Ten Tuning Recommendations

  1.    Optimize Storage Layout, # of Disk Spindles
  2.    Use 64-bit Database
  3.    Add enough memory to cache DB, reduce I/O
  4.    Optimize Storage Layout, # of Disk Spindles
  5.    Use Direct-IO high performance un-cached path in the Guest
        Operating System
  6.  Use Asynchronous I/O to reduce system calls
  7.  Optimize Storage Layout, # of Disk Spindles
  8.  Use Large MMU Pages
  9.  Use the latest H/W – with AMD RVI or Intel EPT
  10. Optimize Storage Layout, # of Disk Spindles


261
Databases: Workload Considerations

! OLTP                                         ! DSS

! Short Transactions                           Long Transactions
! Limited number of standardized queries       Complex queries
! Small amounts of data accessed               Large amounts of data accessed
                                               Combines data from different sources
! Uses data from only one source
                                               ! I/O Profile
! I/O Profile
                                                 •  Large, Sequential I/Os (up to 1MB)
  •  Small Synchronous reads/writes (2k->8k)
                                                 •  Extreme Bandwidth Required
  •  Heavy latency-sensitive log I/O             •  Heavy ready traffic against data volumes
! Memory and I/O intensive                       •  Little log traffic
                                               ! CPU, Memory and I/O intensive
                                               ! Indexing enables higher performance


 262
Databases: Storage Configuration

!  Storage considerations
 •  VMFS or RDM
 •  Fibre Channel, NFS or iSCSI
 •  Partition Alignment
 •  Multiple storage paths
!  OS/App, Data, Transaction Log and TempDB on separate physical
 spindles
!  RAID 10 or RAID5 for Data, RAID 1 for logs
!  Queue depth and Controller Cache Settings
!  TempDB optimization


263
Databases: Storage Hierarchy


                                    "   In a recent study, we scaled up to
             Database Cache             320,000 IOPS to an EMC array from
                                        a single ESX server.
          Guest OS                       "   8K Read/Write Mix
           Cache
                                    "   Cache as much as possible in caches
                         /dev/hda   "   Q: What’s the impact on the number
                Controller              of disks if we improve cache hit rates
                 Cache                  from 90% to 95%?
                                         "   10 in 100 => 5 in 100…
                                         "   #of disks reduced by 2x!


264
Databases: Typical I/O Architecture


                             Database Cache

                                      2k,8k,16k x n       2k, 8k, 16k x n

         512->1MB
                     Log               DB                  DB
                    Writes            Writes              Reads


                              File System


                                               FS Cache


265
Know your I/O: Use a top-down Latency analysis technique


                  Application

                                                           A = Application Latency
                    File
                   System                              A
      Guest
                                                           R = Perfmon
                  I/O Drivers     Windows
                                                   R       Physical Disk
                                Device Queue               “Disk Secs/transfer”

                                               S           S = Windows
                                                           Physical Disk Service Time

                 Virtual SCSI              G
                                                           G = Guest Latency

      VMkernel   File System
                                    K
                                                           K = ESX Kernel


                                    D                      D = Device Latency


266
Checking for Disk Bottlenecks

!  Disk latency issues are visible from Oracle stats
 •  Enable statspack
 •  Review top latency events


  Top 5 Timed Events
                                                           % Total

  Event                         Waits        Time (s)     Ela Time

  --------------------------- ------------ ----------- -----------
  db file sequential read       2,598        7,146           48.54
  db file scattered read       25,519        3,246           22.04
  library cache load lock         673        1,363            9.26
  CPU time                      2,154          934            7.83
  log file parallel write      19,157          837            5.68


267
Oracle File System Sync vs DIO


268
Oracle DIO vs. RAW


269
Direct I/O

      !  Guest-OS Level Option for Bypassing the guest cache
       •  Uncached access avoids multiple copies of data in memory
       •  Avoid read/modify/write module file system block size
       •  Bypasses many file-system level locks


      !  Enabling Direct I/O for Oracle and MySQL on Linux


  # vi init.ora                                   # vi my.cnf
  filesystemio_options=“setall”                   innodb_flush_method to O_DIRECT

  Check:                                          Check:

  # iostat 3                                      # iostat 3
  (Check for I/O size matching the                (Check for I/O size matching the
  DB block size…)                                 DB block size…)


270
Asynchronous I/O

      !  An API for single-threaded process to launch multiple outstanding I/Os
       •  Multi-threaded programs could just just multiple threads
       •  Oracle databases uses this extensively
       •  See aio_read(), aio_write() etc...
      !  Enabling AIO on Linux


  # rpm -Uvh aio.rpm
  # vi init.ora
  filesystemio_options=“setall”

  Check:

  # ps –aef |grep dbwr
  # strace –p <pid>
  io_submit()…                 <- Check for io_submit in syscall trace


271
Picking the size of each VM


 !  vCPUs from one VM stay
      on one socket*              Socket 0   Socket 1   VM Size   Options

 !  With two quad-core
      sockets, there are only                                        2
      two positions for a 4-way
      VM
 !  1- and 2-way VMs can be
      arranged many ways on
      quad core socket
                                                                   12
 !  Newer ESX schedulers
      more efficiency use fewer
      options
      •  Relaxed co-scheduling
                                                                    8

272
Use Large Pages

      !  Guest-OS Level Option to use Large MMU Pages
       •  Maps the large SGA region with fewer TLB entries
       •  Reduces MMU overheads
       •  ESX 3.5 Uniquely Supports Large Pages!
      !  Enabling Large Pages on Linux


  # vi /etc/sysctl.conf
  (add the following lines:)

  vm/nr_hugepages=2048
  vm/hugetlb_shm_group=55

  # cat /proc/vminfo |grep Huge
  HugePages_Total: 1024
  HugePages_Free:    940
  Hugepagesize:     2048 kB


273
Large Pages

!  Increases TLB memory coverage                    Performance Gains
 •  Removes TLB misses, improves efficiency
!  Improves performance of
 applications that are sensitive to           12%

 TLB miss costs
                                              10%
!  Configure OS and application to
 leverage large pages
                                              8%
 •  LP will not be enabled by default
                                              6%


                                              4%


                                              2%


                                              0%
                                                                    Gain (%)


274
Linux Versions

!  Some older Linux versions have a 1Khz timer to optimize desktop-style
 applications
 •  There is no reason to use such a high timer rate on server-class applications
 •  The timer rate on 4vcpu Linux guests is over 70,000 per second!
!  Use RHEL >5.1 or latest tickless timer kernels
 •  Install 2.6.18-53.1.4 kernel or later
 •  Put divider=10 on the end of the kernel line in grub.conf and reboot, or default on
      tickless kernel
 •  All the RHEL clones (CentOS, Oracle EL, etc.) work the same way


275
Java Requires Careful Memory Management


                                     Java/SPECjbb (Uses All Available Memory)

                              1.2                                                                             3000


                                                                                                                     Ballooned/Swapped Memory (MB)
                               1                                                                              2500


                              0.8                                                                             2000
      Normalized Throughput


                              0.6                                                                             1500


                              0.4                                                                             1000


                              0.2                                                                             500


                               0                                                                              0
                                    3072         2816       2560       2304      2048       1792       1536
                                                                 Memory limit (MB)

                                           Ballooned size                        Swapped size
                                           Throughout (Balloon only)             Throughput (Swapping only)

276
                                                                                                                                                     S
Managing Memory in Java Environments


!  Calculate OS memory
!  Estimate JVM needs
!  Specify heap exactly

!  Reservations =
 OS + JVM + heap


!  Also applies to other
 applications with static
 memory needs
 •  Oracle SGA


 277
                                       S
For More Information

!  VMware’s Performance Technology Pages
 •  http://vmware.com/technical-resources/performance
!  VMware’s Performance Blog
 •  http://blogs.vmware.com/performance
!  Performance Community
 •  http://communities.vmware.com/community/vmtn/general/performance
!  VMware Performance Class
 •  Check with VMware Education or VMware Authorized Training Center
!  VMware Performance Service Offering
 •  Ask VMware account team


278
                                                                       S
VMware Performance for Gurus
Richard McDougall
CTO of Application Infrastructure, VMware
rmc@vmware.com       twitter @richardmcdougll


                                                © 2010 VMware Inc. All rights reserved
Ad

More Related Content

What's hot (20)

VMware vSphere Networking deep dive
VMware vSphere Networking deep diveVMware vSphere Networking deep dive
VMware vSphere Networking deep dive
Sanjeev Kumar
 
VMware HCI solutions - 2020-01-16
VMware HCI solutions - 2020-01-16VMware HCI solutions - 2020-01-16
VMware HCI solutions - 2020-01-16
David Pasek
 
Building a Stretched Cluster using Virtual SAN 6.1
Building a Stretched Cluster using Virtual SAN 6.1Building a Stretched Cluster using Virtual SAN 6.1
Building a Stretched Cluster using Virtual SAN 6.1
Duncan Epping
 
SQL Server 2016 - Always On.pptx
SQL Server 2016 - Always On.pptxSQL Server 2016 - Always On.pptx
SQL Server 2016 - Always On.pptx
QuyVo27
 
VMware vSphere 6.0 - Troubleshooting Training - Day 1
VMware vSphere 6.0 - Troubleshooting Training - Day 1VMware vSphere 6.0 - Troubleshooting Training - Day 1
VMware vSphere 6.0 - Troubleshooting Training - Day 1
Sanjeev Kumar
 
VMware Advance Troubleshooting Workshop - Day 5
VMware Advance Troubleshooting Workshop - Day 5VMware Advance Troubleshooting Workshop - Day 5
VMware Advance Troubleshooting Workshop - Day 5
Vepsun Technologies
 
Presentation v mware virtual san 6.0
Presentation   v mware virtual san 6.0Presentation   v mware virtual san 6.0
Presentation v mware virtual san 6.0
solarisyougood
 
Esxi troubleshooting
Esxi troubleshootingEsxi troubleshooting
Esxi troubleshooting
Ovi Chis
 
Hci solution with VxRail
Hci solution with VxRailHci solution with VxRail
Hci solution with VxRail
Anton An
 
Linux PV on HVM
Linux PV on HVMLinux PV on HVM
Linux PV on HVM
The Linux Foundation
 
V mware v-sphere & vsa presentation
V mware   v-sphere & vsa presentationV mware   v-sphere & vsa presentation
V mware v-sphere & vsa presentation
Business Computer Associates, Inc
 
VMware Virtual SAN Presentation
VMware Virtual SAN PresentationVMware Virtual SAN Presentation
VMware Virtual SAN Presentation
virtualsouthwest
 
Ibm spectrum scale fundamentals workshop for americas part 4 spectrum scale_r...
Ibm spectrum scale fundamentals workshop for americas part 4 spectrum scale_r...Ibm spectrum scale fundamentals workshop for americas part 4 spectrum scale_r...
Ibm spectrum scale fundamentals workshop for americas part 4 spectrum scale_r...
xKinAnx
 
VMware
VMwareVMware
VMware
InstituteIBA
 
Hyper-Converged Infrastructure Vx Rail
Hyper-Converged Infrastructure Vx Rail Hyper-Converged Infrastructure Vx Rail
Hyper-Converged Infrastructure Vx Rail
Jürgen Ambrosi
 
HPE InfoSight for Servers
HPE InfoSight for ServersHPE InfoSight for Servers
HPE InfoSight for Servers
Xylos
 
VMware - Virtual SAN - IT Changes Everything
VMware - Virtual SAN - IT Changes EverythingVMware - Virtual SAN - IT Changes Everything
VMware - Virtual SAN - IT Changes Everything
VMUG IT
 
vSAN architecture components
vSAN architecture componentsvSAN architecture components
vSAN architecture components
David Pasek
 
Ceph as software define storage
Ceph as software define storageCeph as software define storage
Ceph as software define storage
Mahmoud Shiri Varamini
 
Intel & QLogic NIC performance test results v0.2
Intel & QLogic NIC performance test results v0.2Intel & QLogic NIC performance test results v0.2
Intel & QLogic NIC performance test results v0.2
David Pasek
 
VMware vSphere Networking deep dive
VMware vSphere Networking deep diveVMware vSphere Networking deep dive
VMware vSphere Networking deep dive
Sanjeev Kumar
 
VMware HCI solutions - 2020-01-16
VMware HCI solutions - 2020-01-16VMware HCI solutions - 2020-01-16
VMware HCI solutions - 2020-01-16
David Pasek
 
Building a Stretched Cluster using Virtual SAN 6.1
Building a Stretched Cluster using Virtual SAN 6.1Building a Stretched Cluster using Virtual SAN 6.1
Building a Stretched Cluster using Virtual SAN 6.1
Duncan Epping
 
SQL Server 2016 - Always On.pptx
SQL Server 2016 - Always On.pptxSQL Server 2016 - Always On.pptx
SQL Server 2016 - Always On.pptx
QuyVo27
 
VMware vSphere 6.0 - Troubleshooting Training - Day 1
VMware vSphere 6.0 - Troubleshooting Training - Day 1VMware vSphere 6.0 - Troubleshooting Training - Day 1
VMware vSphere 6.0 - Troubleshooting Training - Day 1
Sanjeev Kumar
 
VMware Advance Troubleshooting Workshop - Day 5
VMware Advance Troubleshooting Workshop - Day 5VMware Advance Troubleshooting Workshop - Day 5
VMware Advance Troubleshooting Workshop - Day 5
Vepsun Technologies
 
Presentation v mware virtual san 6.0
Presentation   v mware virtual san 6.0Presentation   v mware virtual san 6.0
Presentation v mware virtual san 6.0
solarisyougood
 
Esxi troubleshooting
Esxi troubleshootingEsxi troubleshooting
Esxi troubleshooting
Ovi Chis
 
Hci solution with VxRail
Hci solution with VxRailHci solution with VxRail
Hci solution with VxRail
Anton An
 
VMware Virtual SAN Presentation
VMware Virtual SAN PresentationVMware Virtual SAN Presentation
VMware Virtual SAN Presentation
virtualsouthwest
 
Ibm spectrum scale fundamentals workshop for americas part 4 spectrum scale_r...
Ibm spectrum scale fundamentals workshop for americas part 4 spectrum scale_r...Ibm spectrum scale fundamentals workshop for americas part 4 spectrum scale_r...
Ibm spectrum scale fundamentals workshop for americas part 4 spectrum scale_r...
xKinAnx
 
Hyper-Converged Infrastructure Vx Rail
Hyper-Converged Infrastructure Vx Rail Hyper-Converged Infrastructure Vx Rail
Hyper-Converged Infrastructure Vx Rail
Jürgen Ambrosi
 
HPE InfoSight for Servers
HPE InfoSight for ServersHPE InfoSight for Servers
HPE InfoSight for Servers
Xylos
 
VMware - Virtual SAN - IT Changes Everything
VMware - Virtual SAN - IT Changes EverythingVMware - Virtual SAN - IT Changes Everything
VMware - Virtual SAN - IT Changes Everything
VMUG IT
 
vSAN architecture components
vSAN architecture componentsvSAN architecture components
vSAN architecture components
David Pasek
 
Intel & QLogic NIC performance test results v0.2
Intel & QLogic NIC performance test results v0.2Intel & QLogic NIC performance test results v0.2
Intel & QLogic NIC performance test results v0.2
David Pasek
 

Viewers also liked (20)

VMware Performance Troubleshooting
VMware Performance TroubleshootingVMware Performance Troubleshooting
VMware Performance Troubleshooting
glbsolutions
 
VMware Advance Troubleshooting Workshop - Day 6
VMware Advance Troubleshooting Workshop - Day 6VMware Advance Troubleshooting Workshop - Day 6
VMware Advance Troubleshooting Workshop - Day 6
Vepsun Technologies
 
VMware Advance Troubleshooting Workshop - Day 4
VMware Advance Troubleshooting Workshop - Day 4VMware Advance Troubleshooting Workshop - Day 4
VMware Advance Troubleshooting Workshop - Day 4
Vepsun Technologies
 
VMware Advance Troubleshooting Workshop - Day 3
VMware Advance Troubleshooting Workshop - Day 3VMware Advance Troubleshooting Workshop - Day 3
VMware Advance Troubleshooting Workshop - Day 3
Vepsun Technologies
 
Developing a Progressive Mobile Strategy
Developing a Progressive Mobile StrategyDeveloping a Progressive Mobile Strategy
Developing a Progressive Mobile Strategy
Dave Olsen
 
Wi Vi technology
Wi Vi technology Wi Vi technology
Wi Vi technology
Liju Thomas
 
IIT - Bombay - Open General Quiz 2.0 - Finals (with Written Round and Long Vi...
IIT - Bombay - Open General Quiz 2.0 - Finals (with Written Round and Long Vi...IIT - Bombay - Open General Quiz 2.0 - Finals (with Written Round and Long Vi...
IIT - Bombay - Open General Quiz 2.0 - Finals (with Written Round and Long Vi...
Walnut Knowledge Solutions
 
Basic Principles Of Local Flap In Plastic Surgery
Basic Principles Of Local Flap In Plastic SurgeryBasic Principles Of Local Flap In Plastic Surgery
Basic Principles Of Local Flap In Plastic Surgery
Shamendra Sahu
 
Call flows
Call flowsCall flows
Call flows
Shweta Kumar PMP, ACC, CSM, CSPO
 
Decision making between anterior skull base & lateral skull base
Decision making between anterior skull base & lateral skull baseDecision making between anterior skull base & lateral skull base
Decision making between anterior skull base & lateral skull base
Murali Chand Nallamothu
 
Leading Without Seeing: managing distributed teams
Leading Without Seeing: managing distributed teamsLeading Without Seeing: managing distributed teams
Leading Without Seeing: managing distributed teams
Shane Pearlman
 
VMware vSphere technical presentation
VMware vSphere technical presentationVMware vSphere technical presentation
VMware vSphere technical presentation
aleyeldean
 
Benchmarking
BenchmarkingBenchmarking
Benchmarking
Farhad Zargari
 
Vietnam E-commerce Report 2016
Vietnam E-commerce Report 2016 Vietnam E-commerce Report 2016
Vietnam E-commerce Report 2016
Canada-Vietnam Entrepreneurs
 
How To Become... LORD OF THE SLIDES
How To Become... LORD OF THE SLIDESHow To Become... LORD OF THE SLIDES
How To Become... LORD OF THE SLIDES
Paul Brown
 
SAP FI - Account Payable (AP)
SAP FI - Account Payable (AP)SAP FI - Account Payable (AP)
SAP FI - Account Payable (AP)
saiprasadbagrecha
 
Thai tech startup ecosystem report 2017
Thai tech startup ecosystem report 2017Thai tech startup ecosystem report 2017
Thai tech startup ecosystem report 2017
Techsauce Media
 
Mri brain anatomy Dr Muhammad Bin Zulfiqar
Mri brain anatomy Dr Muhammad Bin ZulfiqarMri brain anatomy Dr Muhammad Bin Zulfiqar
Mri brain anatomy Dr Muhammad Bin Zulfiqar
Dr. Muhammad Bin Zulfiqar
 
Investment Planning
Investment PlanningInvestment Planning
Investment Planning
John Daniel
 
Grammar - Prepositions - Time
Grammar - Prepositions - TimeGrammar - Prepositions - Time
Grammar - Prepositions - Time
Evan Brammer
 
VMware Performance Troubleshooting
VMware Performance TroubleshootingVMware Performance Troubleshooting
VMware Performance Troubleshooting
glbsolutions
 
VMware Advance Troubleshooting Workshop - Day 6
VMware Advance Troubleshooting Workshop - Day 6VMware Advance Troubleshooting Workshop - Day 6
VMware Advance Troubleshooting Workshop - Day 6
Vepsun Technologies
 
VMware Advance Troubleshooting Workshop - Day 4
VMware Advance Troubleshooting Workshop - Day 4VMware Advance Troubleshooting Workshop - Day 4
VMware Advance Troubleshooting Workshop - Day 4
Vepsun Technologies
 
VMware Advance Troubleshooting Workshop - Day 3
VMware Advance Troubleshooting Workshop - Day 3VMware Advance Troubleshooting Workshop - Day 3
VMware Advance Troubleshooting Workshop - Day 3
Vepsun Technologies
 
Developing a Progressive Mobile Strategy
Developing a Progressive Mobile StrategyDeveloping a Progressive Mobile Strategy
Developing a Progressive Mobile Strategy
Dave Olsen
 
Wi Vi technology
Wi Vi technology Wi Vi technology
Wi Vi technology
Liju Thomas
 
IIT - Bombay - Open General Quiz 2.0 - Finals (with Written Round and Long Vi...
IIT - Bombay - Open General Quiz 2.0 - Finals (with Written Round and Long Vi...IIT - Bombay - Open General Quiz 2.0 - Finals (with Written Round and Long Vi...
IIT - Bombay - Open General Quiz 2.0 - Finals (with Written Round and Long Vi...
Walnut Knowledge Solutions
 
Basic Principles Of Local Flap In Plastic Surgery
Basic Principles Of Local Flap In Plastic SurgeryBasic Principles Of Local Flap In Plastic Surgery
Basic Principles Of Local Flap In Plastic Surgery
Shamendra Sahu
 
Decision making between anterior skull base & lateral skull base
Decision making between anterior skull base & lateral skull baseDecision making between anterior skull base & lateral skull base
Decision making between anterior skull base & lateral skull base
Murali Chand Nallamothu
 
Leading Without Seeing: managing distributed teams
Leading Without Seeing: managing distributed teamsLeading Without Seeing: managing distributed teams
Leading Without Seeing: managing distributed teams
Shane Pearlman
 
VMware vSphere technical presentation
VMware vSphere technical presentationVMware vSphere technical presentation
VMware vSphere technical presentation
aleyeldean
 
How To Become... LORD OF THE SLIDES
How To Become... LORD OF THE SLIDESHow To Become... LORD OF THE SLIDES
How To Become... LORD OF THE SLIDES
Paul Brown
 
SAP FI - Account Payable (AP)
SAP FI - Account Payable (AP)SAP FI - Account Payable (AP)
SAP FI - Account Payable (AP)
saiprasadbagrecha
 
Thai tech startup ecosystem report 2017
Thai tech startup ecosystem report 2017Thai tech startup ecosystem report 2017
Thai tech startup ecosystem report 2017
Techsauce Media
 
Investment Planning
Investment PlanningInvestment Planning
Investment Planning
John Daniel
 
Grammar - Prepositions - Time
Grammar - Prepositions - TimeGrammar - Prepositions - Time
Grammar - Prepositions - Time
Evan Brammer
 
Ad

Similar to VMware Performance for Gurus - A Tutorial (20)

Apache Hadoop on Virtual Machines
Apache Hadoop on Virtual MachinesApache Hadoop on Virtual Machines
Apache Hadoop on Virtual Machines
DataWorks Summit
 
Virtualization 101: Everything You Need To Know To Get Started With VMware
Virtualization 101: Everything You Need To Know To Get Started With VMwareVirtualization 101: Everything You Need To Know To Get Started With VMware
Virtualization 101: Everything You Need To Know To Get Started With VMware
Datapath Consulting
 
Openstack Diablo Survey
Openstack Diablo SurveyOpenstack Diablo Survey
Openstack Diablo Survey
Pjack Chen
 
Brief about Windows Azure Platform
Brief about Windows Azure Platform Brief about Windows Azure Platform
Brief about Windows Azure Platform
K.Mohamed Faizal
 
Virtualization: Hyper-V, VMM, App-V and MED-V.
Virtualization: Hyper-V, VMM, App-V and MED-V.Virtualization: Hyper-V, VMM, App-V and MED-V.
Virtualization: Hyper-V, VMM, App-V and MED-V.
Microsoft Iceland
 
CloudStack Architecture Future
CloudStack Architecture FutureCloudStack Architecture Future
CloudStack Architecture Future
Kimihiko Kitase
 
Net Optics' Virtualization Solutions Deployment Case Study
Net Optics' Virtualization Solutions Deployment Case StudyNet Optics' Virtualization Solutions Deployment Case Study
Net Optics' Virtualization Solutions Deployment Case Study
LiveAction Next Generation Network Management Software
 
Best Practices for Virtualizing Hadoop
Best Practices for Virtualizing HadoopBest Practices for Virtualizing Hadoop
Best Practices for Virtualizing Hadoop
DataWorks Summit
 
分会场二深入分析Veritas cluster server和storage foundation在aix高可用以及灾难恢复环境下如何对存储管理进行优化
分会场二深入分析Veritas cluster server和storage foundation在aix高可用以及灾难恢复环境下如何对存储管理进行优化分会场二深入分析Veritas cluster server和storage foundation在aix高可用以及灾难恢复环境下如何对存储管理进行优化
分会场二深入分析Veritas cluster server和storage foundation在aix高可用以及灾难恢复环境下如何对存储管理进行优化
ITband
 
Citrix CloudStack - Build Your Own Scalable Infrastructure Cloud with CloudStack
Citrix CloudStack - Build Your Own Scalable Infrastructure Cloud with CloudStackCitrix CloudStack - Build Your Own Scalable Infrastructure Cloud with CloudStack
Citrix CloudStack - Build Your Own Scalable Infrastructure Cloud with CloudStack
RightScale
 
An Introduction to Azure IaaS
An Introduction to Azure IaaSAn Introduction to Azure IaaS
An Introduction to Azure IaaS
Applied Information Sciences
 
Choosing Your Windows Azure Platform Strategy
Choosing Your Windows Azure Platform StrategyChoosing Your Windows Azure Platform Strategy
Choosing Your Windows Azure Platform Strategy
drmarcustillett
 
Scvmm 2012 (maarten wijsman)
Scvmm 2012 (maarten wijsman)Scvmm 2012 (maarten wijsman)
Scvmm 2012 (maarten wijsman)
hypervnu
 
SANsymphony V
SANsymphony VSANsymphony V
SANsymphony V
TTEC
 
Virtualization for Development
Virtualization for DevelopmentVirtualization for Development
Virtualization for Development
elliando dias
 
What is a virtual tap?
What is a virtual tap?What is a virtual tap?
What is a virtual tap?
LiveAction Next Generation Network Management Software
 
IT FUTURE 2011 - Fujitsu ror orchestration
IT FUTURE 2011 - Fujitsu ror orchestrationIT FUTURE 2011 - Fujitsu ror orchestration
IT FUTURE 2011 - Fujitsu ror orchestration
Fujitsu France
 
Exploration of eucalyptus_v2.0
Exploration of eucalyptus_v2.0Exploration of eucalyptus_v2.0
Exploration of eucalyptus_v2.0
huangwenjun310
 
Cloud Computing Tools
Cloud Computing ToolsCloud Computing Tools
Cloud Computing Tools
Jithin Parakka
 
Презентация RDS & App-V, VDI
Презентация RDS & App-V, VDIПрезентация RDS & App-V, VDI
Презентация RDS & App-V, VDI
Виталий Стародубцев
 
Apache Hadoop on Virtual Machines
Apache Hadoop on Virtual MachinesApache Hadoop on Virtual Machines
Apache Hadoop on Virtual Machines
DataWorks Summit
 
Virtualization 101: Everything You Need To Know To Get Started With VMware
Virtualization 101: Everything You Need To Know To Get Started With VMwareVirtualization 101: Everything You Need To Know To Get Started With VMware
Virtualization 101: Everything You Need To Know To Get Started With VMware
Datapath Consulting
 
Openstack Diablo Survey
Openstack Diablo SurveyOpenstack Diablo Survey
Openstack Diablo Survey
Pjack Chen
 
Brief about Windows Azure Platform
Brief about Windows Azure Platform Brief about Windows Azure Platform
Brief about Windows Azure Platform
K.Mohamed Faizal
 
Virtualization: Hyper-V, VMM, App-V and MED-V.
Virtualization: Hyper-V, VMM, App-V and MED-V.Virtualization: Hyper-V, VMM, App-V and MED-V.
Virtualization: Hyper-V, VMM, App-V and MED-V.
Microsoft Iceland
 
CloudStack Architecture Future
CloudStack Architecture FutureCloudStack Architecture Future
CloudStack Architecture Future
Kimihiko Kitase
 
Best Practices for Virtualizing Hadoop
Best Practices for Virtualizing HadoopBest Practices for Virtualizing Hadoop
Best Practices for Virtualizing Hadoop
DataWorks Summit
 
分会场二深入分析Veritas cluster server和storage foundation在aix高可用以及灾难恢复环境下如何对存储管理进行优化
分会场二深入分析Veritas cluster server和storage foundation在aix高可用以及灾难恢复环境下如何对存储管理进行优化分会场二深入分析Veritas cluster server和storage foundation在aix高可用以及灾难恢复环境下如何对存储管理进行优化
分会场二深入分析Veritas cluster server和storage foundation在aix高可用以及灾难恢复环境下如何对存储管理进行优化
ITband
 
Citrix CloudStack - Build Your Own Scalable Infrastructure Cloud with CloudStack
Citrix CloudStack - Build Your Own Scalable Infrastructure Cloud with CloudStackCitrix CloudStack - Build Your Own Scalable Infrastructure Cloud with CloudStack
Citrix CloudStack - Build Your Own Scalable Infrastructure Cloud with CloudStack
RightScale
 
Choosing Your Windows Azure Platform Strategy
Choosing Your Windows Azure Platform StrategyChoosing Your Windows Azure Platform Strategy
Choosing Your Windows Azure Platform Strategy
drmarcustillett
 
Scvmm 2012 (maarten wijsman)
Scvmm 2012 (maarten wijsman)Scvmm 2012 (maarten wijsman)
Scvmm 2012 (maarten wijsman)
hypervnu
 
SANsymphony V
SANsymphony VSANsymphony V
SANsymphony V
TTEC
 
Virtualization for Development
Virtualization for DevelopmentVirtualization for Development
Virtualization for Development
elliando dias
 
IT FUTURE 2011 - Fujitsu ror orchestration
IT FUTURE 2011 - Fujitsu ror orchestrationIT FUTURE 2011 - Fujitsu ror orchestration
IT FUTURE 2011 - Fujitsu ror orchestration
Fujitsu France
 
Exploration of eucalyptus_v2.0
Exploration of eucalyptus_v2.0Exploration of eucalyptus_v2.0
Exploration of eucalyptus_v2.0
huangwenjun310
 
Ad

More from Richard McDougall (13)

Making of the Burner Board
Making of the Burner BoardMaking of the Burner Board
Making of the Burner Board
Richard McDougall
 
Is your cloud ready for Big Data? Strata NY 2013
Is your cloud ready for Big Data? Strata NY 2013Is your cloud ready for Big Data? Strata NY 2013
Is your cloud ready for Big Data? Strata NY 2013
Richard McDougall
 
Big Data/Hadoop Infrastructure Considerations
Big Data/Hadoop Infrastructure ConsiderationsBig Data/Hadoop Infrastructure Considerations
Big Data/Hadoop Infrastructure Considerations
Richard McDougall
 
Building Big Data Applications
Building Big Data ApplicationsBuilding Big Data Applications
Building Big Data Applications
Richard McDougall
 
Hadoop I/O Analysis
Hadoop I/O AnalysisHadoop I/O Analysis
Hadoop I/O Analysis
Richard McDougall
 
Apachecon Euro 2012: Elastic, Multi-tenant Hadoop on Demand
Apachecon Euro 2012: Elastic, Multi-tenant Hadoop on DemandApachecon Euro 2012: Elastic, Multi-tenant Hadoop on Demand
Apachecon Euro 2012: Elastic, Multi-tenant Hadoop on Demand
Richard McDougall
 
Solaris Internals Preso circa 2009
Solaris Internals Preso circa 2009Solaris Internals Preso circa 2009
Solaris Internals Preso circa 2009
Richard McDougall
 
Inside the Hadoop Machine @ VMworld
Inside the Hadoop Machine @ VMworldInside the Hadoop Machine @ VMworld
Inside the Hadoop Machine @ VMworld
Richard McDougall
 
Hadoop on Virtual Machines
Hadoop on Virtual MachinesHadoop on Virtual Machines
Hadoop on Virtual Machines
Richard McDougall
 
Virtualizing Oracle Databases with VMware
Virtualizing Oracle Databases with VMwareVirtualizing Oracle Databases with VMware
Virtualizing Oracle Databases with VMware
Richard McDougall
 
Virtualization Primer for Java Developers
Virtualization Primer for Java DevelopersVirtualization Primer for Java Developers
Virtualization Primer for Java Developers
Richard McDougall
 
Hadoop on VMware
Hadoop on VMwareHadoop on VMware
Hadoop on VMware
Richard McDougall
 
Architecting Virtualized Infrastructure for Big Data
Architecting Virtualized Infrastructure for Big DataArchitecting Virtualized Infrastructure for Big Data
Architecting Virtualized Infrastructure for Big Data
Richard McDougall
 
Is your cloud ready for Big Data? Strata NY 2013
Is your cloud ready for Big Data? Strata NY 2013Is your cloud ready for Big Data? Strata NY 2013
Is your cloud ready for Big Data? Strata NY 2013
Richard McDougall
 
Big Data/Hadoop Infrastructure Considerations
Big Data/Hadoop Infrastructure ConsiderationsBig Data/Hadoop Infrastructure Considerations
Big Data/Hadoop Infrastructure Considerations
Richard McDougall
 
Building Big Data Applications
Building Big Data ApplicationsBuilding Big Data Applications
Building Big Data Applications
Richard McDougall
 
Apachecon Euro 2012: Elastic, Multi-tenant Hadoop on Demand
Apachecon Euro 2012: Elastic, Multi-tenant Hadoop on DemandApachecon Euro 2012: Elastic, Multi-tenant Hadoop on Demand
Apachecon Euro 2012: Elastic, Multi-tenant Hadoop on Demand
Richard McDougall
 
Solaris Internals Preso circa 2009
Solaris Internals Preso circa 2009Solaris Internals Preso circa 2009
Solaris Internals Preso circa 2009
Richard McDougall
 
Inside the Hadoop Machine @ VMworld
Inside the Hadoop Machine @ VMworldInside the Hadoop Machine @ VMworld
Inside the Hadoop Machine @ VMworld
Richard McDougall
 
Virtualizing Oracle Databases with VMware
Virtualizing Oracle Databases with VMwareVirtualizing Oracle Databases with VMware
Virtualizing Oracle Databases with VMware
Richard McDougall
 
Virtualization Primer for Java Developers
Virtualization Primer for Java DevelopersVirtualization Primer for Java Developers
Virtualization Primer for Java Developers
Richard McDougall
 
Architecting Virtualized Infrastructure for Big Data
Architecting Virtualized Infrastructure for Big DataArchitecting Virtualized Infrastructure for Big Data
Architecting Virtualized Infrastructure for Big Data
Richard McDougall
 

Recently uploaded (20)

HCL Nomad Web – Best Practices and Managing Multiuser Environments
HCL Nomad Web – Best Practices and Managing Multiuser EnvironmentsHCL Nomad Web – Best Practices and Managing Multiuser Environments
HCL Nomad Web – Best Practices and Managing Multiuser Environments
panagenda
 
Andrew Marnell: Transforming Business Strategy Through Data-Driven Insights
Andrew Marnell: Transforming Business Strategy Through Data-Driven InsightsAndrew Marnell: Transforming Business Strategy Through Data-Driven Insights
Andrew Marnell: Transforming Business Strategy Through Data-Driven Insights
Andrew Marnell
 
DevOpsDays Atlanta 2025 - Building 10x Development Organizations.pptx
DevOpsDays Atlanta 2025 - Building 10x Development Organizations.pptxDevOpsDays Atlanta 2025 - Building 10x Development Organizations.pptx
DevOpsDays Atlanta 2025 - Building 10x Development Organizations.pptx
Justin Reock
 
Special Meetup Edition - TDX Bengaluru Meetup #52.pptx
Special Meetup Edition - TDX Bengaluru Meetup #52.pptxSpecial Meetup Edition - TDX Bengaluru Meetup #52.pptx
Special Meetup Edition - TDX Bengaluru Meetup #52.pptx
shyamraj55
 
Linux Professional Institute LPIC-1 Exam.pdf
Linux Professional Institute LPIC-1 Exam.pdfLinux Professional Institute LPIC-1 Exam.pdf
Linux Professional Institute LPIC-1 Exam.pdf
RHCSA Guru
 
AI Changes Everything – Talk at Cardiff Metropolitan University, 29th April 2...
AI Changes Everything – Talk at Cardiff Metropolitan University, 29th April 2...AI Changes Everything – Talk at Cardiff Metropolitan University, 29th April 2...
AI Changes Everything – Talk at Cardiff Metropolitan University, 29th April 2...
Alan Dix
 
How Can I use the AI Hype in my Business Context?
How Can I use the AI Hype in my Business Context?How Can I use the AI Hype in my Business Context?
How Can I use the AI Hype in my Business Context?
Daniel Lehner
 
Quantum Computing Quick Research Guide by Arthur Morgan
Quantum Computing Quick Research Guide by Arthur MorganQuantum Computing Quick Research Guide by Arthur Morgan
Quantum Computing Quick Research Guide by Arthur Morgan
Arthur Morgan
 
Dev Dives: Automate and orchestrate your processes with UiPath Maestro
Dev Dives: Automate and orchestrate your processes with UiPath MaestroDev Dives: Automate and orchestrate your processes with UiPath Maestro
Dev Dives: Automate and orchestrate your processes with UiPath Maestro
UiPathCommunity
 
#StandardsGoals for 2025: Standards & certification roundup - Tech Forum 2025
#StandardsGoals for 2025: Standards & certification roundup - Tech Forum 2025#StandardsGoals for 2025: Standards & certification roundup - Tech Forum 2025
#StandardsGoals for 2025: Standards & certification roundup - Tech Forum 2025
BookNet Canada
 
Complete Guide to Advanced Logistics Management Software in Riyadh.pdf
Complete Guide to Advanced Logistics Management Software in Riyadh.pdfComplete Guide to Advanced Logistics Management Software in Riyadh.pdf
Complete Guide to Advanced Logistics Management Software in Riyadh.pdf
Software Company
 
UiPath Community Berlin: Orchestrator API, Swagger, and Test Manager API
UiPath Community Berlin: Orchestrator API, Swagger, and Test Manager APIUiPath Community Berlin: Orchestrator API, Swagger, and Test Manager API
UiPath Community Berlin: Orchestrator API, Swagger, and Test Manager API
UiPathCommunity
 
ThousandEyes Partner Innovation Updates for May 2025
ThousandEyes Partner Innovation Updates for May 2025ThousandEyes Partner Innovation Updates for May 2025
ThousandEyes Partner Innovation Updates for May 2025
ThousandEyes
 
Mobile App Development Company in Saudi Arabia
Mobile App Development Company in Saudi ArabiaMobile App Development Company in Saudi Arabia
Mobile App Development Company in Saudi Arabia
Steve Jonas
 
Enhancing ICU Intelligence: How Our Functional Testing Enabled a Healthcare I...
Enhancing ICU Intelligence: How Our Functional Testing Enabled a Healthcare I...Enhancing ICU Intelligence: How Our Functional Testing Enabled a Healthcare I...
Enhancing ICU Intelligence: How Our Functional Testing Enabled a Healthcare I...
Impelsys Inc.
 
Noah Loul Shares 5 Steps to Implement AI Agents for Maximum Business Efficien...
Noah Loul Shares 5 Steps to Implement AI Agents for Maximum Business Efficien...Noah Loul Shares 5 Steps to Implement AI Agents for Maximum Business Efficien...
Noah Loul Shares 5 Steps to Implement AI Agents for Maximum Business Efficien...
Noah Loul
 
Massive Power Outage Hits Spain, Portugal, and France: Causes, Impact, and On...
Massive Power Outage Hits Spain, Portugal, and France: Causes, Impact, and On...Massive Power Outage Hits Spain, Portugal, and France: Causes, Impact, and On...
Massive Power Outage Hits Spain, Portugal, and France: Causes, Impact, and On...
Aqusag Technologies
 
Into The Box Conference Keynote Day 1 (ITB2025)
Into The Box Conference Keynote Day 1 (ITB2025)Into The Box Conference Keynote Day 1 (ITB2025)
Into The Box Conference Keynote Day 1 (ITB2025)
Ortus Solutions, Corp
 
How analogue intelligence complements AI
How analogue intelligence complements AIHow analogue intelligence complements AI
How analogue intelligence complements AI
Paul Rowe
 
Procurement Insights Cost To Value Guide.pptx
Procurement Insights Cost To Value Guide.pptxProcurement Insights Cost To Value Guide.pptx
Procurement Insights Cost To Value Guide.pptx
Jon Hansen
 
HCL Nomad Web – Best Practices and Managing Multiuser Environments
HCL Nomad Web – Best Practices and Managing Multiuser EnvironmentsHCL Nomad Web – Best Practices and Managing Multiuser Environments
HCL Nomad Web – Best Practices and Managing Multiuser Environments
panagenda
 
Andrew Marnell: Transforming Business Strategy Through Data-Driven Insights
Andrew Marnell: Transforming Business Strategy Through Data-Driven InsightsAndrew Marnell: Transforming Business Strategy Through Data-Driven Insights
Andrew Marnell: Transforming Business Strategy Through Data-Driven Insights
Andrew Marnell
 
DevOpsDays Atlanta 2025 - Building 10x Development Organizations.pptx
DevOpsDays Atlanta 2025 - Building 10x Development Organizations.pptxDevOpsDays Atlanta 2025 - Building 10x Development Organizations.pptx
DevOpsDays Atlanta 2025 - Building 10x Development Organizations.pptx
Justin Reock
 
Special Meetup Edition - TDX Bengaluru Meetup #52.pptx
Special Meetup Edition - TDX Bengaluru Meetup #52.pptxSpecial Meetup Edition - TDX Bengaluru Meetup #52.pptx
Special Meetup Edition - TDX Bengaluru Meetup #52.pptx
shyamraj55
 
Linux Professional Institute LPIC-1 Exam.pdf
Linux Professional Institute LPIC-1 Exam.pdfLinux Professional Institute LPIC-1 Exam.pdf
Linux Professional Institute LPIC-1 Exam.pdf
RHCSA Guru
 
AI Changes Everything – Talk at Cardiff Metropolitan University, 29th April 2...
AI Changes Everything – Talk at Cardiff Metropolitan University, 29th April 2...AI Changes Everything – Talk at Cardiff Metropolitan University, 29th April 2...
AI Changes Everything – Talk at Cardiff Metropolitan University, 29th April 2...
Alan Dix
 
How Can I use the AI Hype in my Business Context?
How Can I use the AI Hype in my Business Context?How Can I use the AI Hype in my Business Context?
How Can I use the AI Hype in my Business Context?
Daniel Lehner
 
Quantum Computing Quick Research Guide by Arthur Morgan
Quantum Computing Quick Research Guide by Arthur MorganQuantum Computing Quick Research Guide by Arthur Morgan
Quantum Computing Quick Research Guide by Arthur Morgan
Arthur Morgan
 
Dev Dives: Automate and orchestrate your processes with UiPath Maestro
Dev Dives: Automate and orchestrate your processes with UiPath MaestroDev Dives: Automate and orchestrate your processes with UiPath Maestro
Dev Dives: Automate and orchestrate your processes with UiPath Maestro
UiPathCommunity
 
#StandardsGoals for 2025: Standards & certification roundup - Tech Forum 2025
#StandardsGoals for 2025: Standards & certification roundup - Tech Forum 2025#StandardsGoals for 2025: Standards & certification roundup - Tech Forum 2025
#StandardsGoals for 2025: Standards & certification roundup - Tech Forum 2025
BookNet Canada
 
Complete Guide to Advanced Logistics Management Software in Riyadh.pdf
Complete Guide to Advanced Logistics Management Software in Riyadh.pdfComplete Guide to Advanced Logistics Management Software in Riyadh.pdf
Complete Guide to Advanced Logistics Management Software in Riyadh.pdf
Software Company
 
UiPath Community Berlin: Orchestrator API, Swagger, and Test Manager API
UiPath Community Berlin: Orchestrator API, Swagger, and Test Manager APIUiPath Community Berlin: Orchestrator API, Swagger, and Test Manager API
UiPath Community Berlin: Orchestrator API, Swagger, and Test Manager API
UiPathCommunity
 
ThousandEyes Partner Innovation Updates for May 2025
ThousandEyes Partner Innovation Updates for May 2025ThousandEyes Partner Innovation Updates for May 2025
ThousandEyes Partner Innovation Updates for May 2025
ThousandEyes
 
Mobile App Development Company in Saudi Arabia
Mobile App Development Company in Saudi ArabiaMobile App Development Company in Saudi Arabia
Mobile App Development Company in Saudi Arabia
Steve Jonas
 
Enhancing ICU Intelligence: How Our Functional Testing Enabled a Healthcare I...
Enhancing ICU Intelligence: How Our Functional Testing Enabled a Healthcare I...Enhancing ICU Intelligence: How Our Functional Testing Enabled a Healthcare I...
Enhancing ICU Intelligence: How Our Functional Testing Enabled a Healthcare I...
Impelsys Inc.
 
Noah Loul Shares 5 Steps to Implement AI Agents for Maximum Business Efficien...
Noah Loul Shares 5 Steps to Implement AI Agents for Maximum Business Efficien...Noah Loul Shares 5 Steps to Implement AI Agents for Maximum Business Efficien...
Noah Loul Shares 5 Steps to Implement AI Agents for Maximum Business Efficien...
Noah Loul
 
Massive Power Outage Hits Spain, Portugal, and France: Causes, Impact, and On...
Massive Power Outage Hits Spain, Portugal, and France: Causes, Impact, and On...Massive Power Outage Hits Spain, Portugal, and France: Causes, Impact, and On...
Massive Power Outage Hits Spain, Portugal, and France: Causes, Impact, and On...
Aqusag Technologies
 
Into The Box Conference Keynote Day 1 (ITB2025)
Into The Box Conference Keynote Day 1 (ITB2025)Into The Box Conference Keynote Day 1 (ITB2025)
Into The Box Conference Keynote Day 1 (ITB2025)
Ortus Solutions, Corp
 
How analogue intelligence complements AI
How analogue intelligence complements AIHow analogue intelligence complements AI
How analogue intelligence complements AI
Paul Rowe
 
Procurement Insights Cost To Value Guide.pptx
Procurement Insights Cost To Value Guide.pptxProcurement Insights Cost To Value Guide.pptx
Procurement Insights Cost To Value Guide.pptx
Jon Hansen
 

VMware Performance for Gurus - A Tutorial

  • 1. VMware Performance for Gurus Richard McDougall Principal Engineer, VMware, Inc [email protected] @richardmcdougll Usenix Tutorial, December, 2010 © 2010 VMware Inc. All rights reserved
  • 2. Abstract !  This class teaches the fundamentals of performance and observability for vSphere virtualization technology. !  The objective of the class is to learn how to be a practitioner of performance diagnosis and capacity planning with vSphere. !  We use a combination of introductory vSphere internals and performance analysis techniques to expose what’s going on under the covers, learn how to interpret metrics, and how to triage performance problems. !  We’ll learn how to interpret load measurements, to perform accurate capacity planning. 2
  • 3. Credits !  Thank you to the many contributors of slides and drawings, including: •  Ravi Soundararajan – VC and esxtop •  Andrei Dorofeev – Scheduling •  Patrick Tullmann – Architecture •  Bing Tsai – Storage •  Howie Xu - Networking •  Scott Drummonds – Performance •  Devaki Kulkarni - Tuning •  Jeff Buell – Tuning •  Irfan Ahmad – Storage & IO •  Krishna Raj Raja – Performance •  Kit Colbert – Memory •  Ole Agesen – Monitor Overview •  Sreekanth Setty - Networking •  Ajay Gulati - Storage •  Wei Zhang - Networking •  Amar Padmanabhan – Networking 3
  • 4. Agenda/Topics !  Introduction !  Performance Monitoring !  CPU !  Memory !  I/O and Storage !  Networking !  Applications 4
  • 5. INTRODUCTION TO VIRTUALIZATION AND VMWARE VI/ESX 5
  • 6. Traditional Architecture Operating system performs various roles •  Application Runtime Libraries •  Resource Management (CPU, Memory etc) •  Hardware + Driver management " Performance & Scalability of the OS was paramount " Performance Observability tools are a feature of the OS 6
  • 7. The Virtualized World The OS takes on the role of a Library, Virtualization layer grows Application Run-time Libraries and Services Application-Level Service Management Application-decomposition of performance Run-time or Deployment OS Local Scheduling and Memory Management Local File System Infrastructure OS (Virtualization Layer) Scheduling Resource Management Device Drivers I/O Stack File System Volume Management Network QoS Firewall Power Management Fault Management Performance Observability of System Resources 7
  • 8. vShere Platform Delegated Administration Developers Application Desktop DBAs get their QA Owners Managers Own per-DB Sandbox Test/Dev Pre-Production Desktop Rapid, Templated Process DB Provisioning Automation/Control Resource Management Distributed Availability, DR Virtualization DRS HA DR Virtual, Portable Distributed DB Instances Management Hypervisor High Performance Scalable Consolidation Physical Storage Virtualization 8
  • 9. Hypervisor Architectures Virtual Virtual Virtual Virtual Virtual General Dom0 (Linux) Machine Machine Purpose OS or Machine Machine Machine Parent VM Drivers Drivers (Windows) Drivers Drivers Drivers Drivers Drivers Dom0 or Parent Xen/Viridian Partition Model Vmware ESX Very Small Hypervisor ESX Server General purpose OS in parent partition for I/O and management "   Small Hypervisor < 24 mb "   Specialized Virtualization Kernel All I/O driver traffic going thru parent OS "   Direct driver model Extra Latency, Less control of I/O "   Management VMs " Remote CLI, CIM, VI API 9
  • 10. VMware ESX Architecture CPU is controlled by scheduler and virtualized by monitor File TCP/IP System Monitor supports: Guest Guest ! BT (Binary Translation) ! HW (Hardware assist) ! PV (Paravirtualization) Monitor Monitor (BT, HW, PV) Virtual NIC Virtual SCSI Memory is allocated by the VMkernel Memory Virtual Switch File System VMkernel and virtualized by the Scheduler Allocator monitor NIC Drivers I/O Drivers Network and I/O devices are emulated and proxied though Physical Hardware native device drivers 10
  • 11. Inside the Monitor: Classical Instruction Virtualization Trap-and-emulate !  Nonvirtualized (“native”) system •  OS runs in privileged mode •  OS “owns” the hardware •  Application code has less privilege Apps Ring 3 OS Ring 0 !  Virtualized •  VMM most privileged (for isolation) •  Classical “ring compression” or “de-privileging” •  Run guest OS kernel in Ring 1 •  Privileged instructions trap; emulated by VMM Apps Ring 3 •  But: does not work for x86 (lack of traps) Guest OS Ring 1 VMM Ring 0 11
  • 12. Classical VM performance !  Native speed except for traps •  Overhead = trap frequency * average trap cost !  Trap sources: •  Privileged instructions •  Page table updates (to support memory virtualization) •  Memory-mapped devices !  Back-of-the-envelope numbers: •  Trap cost is high on deeply pipelined CPUs: ~1000 cycles •  Trap frequency is high for “tough” workloads: 50 kHz or greater •  Bottom line: substantial overhead 12
  • 13. Binary Translation of Guest Code !  Translate guest kernel code !  Replace privileged instrs with safe “equivalent” instruction sequences !  No need for traps !  BT is an extremely powerful technology •  Permits any unmodified x86 OS to run in a VM •  Can virtualize any instruction set 13
  • 14. BT Mechanics !  Each translator invocation •  Consume one input basic block (guest code) •  Produce one output basic block !  Store output in translation cache •  Future reuse •  Amortize translation costs •  Guest-transparent: no patching “in place” input translated basic block basic block Guest translator Translation cache 14
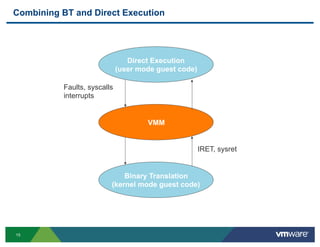
  • 15. Combining BT and Direct Execution Direct Execution (user mode guest code) Faults, syscalls interrupts VMM IRET, sysret Binary Translation (kernel mode guest code) 15
  • 16. Performance of a BT-based VMM !  Costs •  Running the translator •  Path lengthening: output is sometimes longer than input •  System call overheads: DE/BT transition !  Benefits •  Avoid costly traps •  Most instructions need no change (“identical” translation) •  Adaptation: adjust translation in response to guest behavior •  Online profile-guided optimization •  User-mode code runs at full speed (“direct execution”) 16
  • 17. Speeding Up Virtualization Technologies for optimizing performance Privileged instruction Binary Translation, Paravirt. CPU virtualization Hardware Virtualization Assist Binary translation Paravirt. Memory Memory virtualization Hardware Guest Page Tables Device and I/O Paravirtualized Devices virtualization Stateless offload, Direct Mapped I/O 17
  • 18. Multi-mode Monitors Guest Guest Guest There are different types of Monitors for different Workloads and CPU types Binary Para- Hardware VMware ESX provides a Translation Virtualization Assist dynamic framework to allow the best Monitor for the Virtual NIC Virtual SCSI workload Memory VMkernel Virtual Switch File System Scheduler Allocator Let’s look at some of the charactersitics of the NIC Drivers I/O Drivers different monitors Physical Hardware 18
  • 19. Virtualization Hardware Assist More recent CPUs have features to reduce some of the overhead at the monitor level 1st Gen: Intel VT and AMD-V Guest •  doesn’t remove all virtualization overheads: scheduling, memory management and I/O are still virtualized with a software layer Monitor 2ndGen: AMD Barcelona RVI and Intel EPT Virtual NIC Virtual SCSI •  Helps with memory virtualization Memory overheads VMkernel Virtual Switch File System Scheduler Allocator •  Most workloads run with less than 10% overhead •  EPT provides performance gains of up to NIC Drivers I/O Drivers 30% for MMU intensive benchmarks (Kernel Compile, Citrix etc) •  EPT provides performance gains of up to 500% for MMU intensive micro- benchmarks •  Far fewer “outlier” workloads Physical Hardware 19
  • 20. vSphere 4 Monitor Enhancements !  8-VCPU virtual Machines •  Impressive scalability from 1-8 vCPUs !  Monitor type chosen based on Guest OS and CPU model •  UI option to override the default !  Support for upcoming processors with hardware memory virtualization •  Rapid Virtualization Indexing from AMD already supported •  Extended Page Table from Intel •  Improvements to software memory virtualization !  Better Large Page Support (Unique to VMware ESX) •  (Includes enhancements in VMkernel) 20
  • 21. Intel VT-x / AMD-V: 1st Generation HW Support !  Key feature: root vs. guest CPU mode •  VMM executes in root mode Apps Ring 3 Guest mode •  Guest (OS, apps) execute in guest mode Guest OS !  VMM and Guest run as Ring 0 “co-routines” Root mode VM VM •  VM enter exit enter •  Guest runs VMM •  A while later: VM exit •  VMM runs •  ... 21
  • 22. How VMM Controls Guest Execution !  Hardware-defined structure •  Intel: VMCS (virtual machine control structure) •  AMD: VMCB (virtual machine control block) !  VMCB/VMCS contains •  Guest state •  Control bits that define conditions for exit •  Exit on IN, OUT, CPUID, ... VMM Guest VMCB •  Exit on write to control register CR3 physical CPU •  Exit on page fault, pending interrupt, ... •  VMM uses control bits to “confine” and observe guest 22
  • 23. Performance of a VT-x/AMD-V Based VMM !  VMM only intervenes to handle exits !  Same performance equation as classical trap-and-emulate: •  overhead = exit frequency * average exit cost !  VMCB/VMCS can avoid simple exits (e.g., enable/disable interrupts), but many exits remain •  Page table updates •  Context switches •  In/out •  Interrupts 23
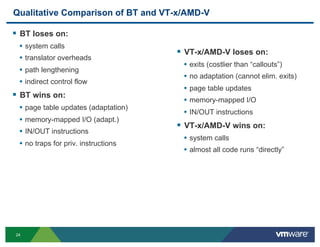
  • 24. Qualitative Comparison of BT and VT-x/AMD-V !  BT loses on: •  system calls !  VT-x/AMD-V loses on: •  translator overheads •  exits (costlier than “callouts”) •  path lengthening •  no adaptation (cannot elim. exits) •  indirect control flow •  page table updates !  BT wins on: •  memory-mapped I/O •  page table updates (adaptation) •  IN/OUT instructions •  memory-mapped I/O (adapt.) !  VT-x/AMD-V wins on: •  IN/OUT instructions •  system calls •  no traps for priv. instructions •  almost all code runs “directly” 24
  • 25. Qualitative Comparison of BT and VT-x/AMD-V !  BT loses on: •  system calls !  VT-x/AMD-V loses on: •  translator overheads •  exits (costlier than “callouts”) •  path lengthening •  no adaptation (cannot elim. exits) •  indirect control flow •  page table updates !  BT wins on: •  memory-mapped I/O •  page table updates (adaptation) •  IN/OUT instructions •  memory-mapped I/O (adapt.) !  VT-x/AMD-V wins on: •  IN/OUT instructions •  system calls •  no traps for priv. instructions •  almost all code runs “directly” 25
  • 26. Qualitative Comparison of BT and VT-x/AMD-V !  BT loses on: •  system calls !  VT-x/AMD-V loses on: •  translator overheads •  exits (costlier than “callouts”) •  path lengthening •  no adaptation (cannot elim. exits) •  indirect control flow •  page table updates !  BT wins on: •  memory-mapped I/O •  page table updates (adaptation) •  IN/OUT instructions •  memory-mapped I/O (adapt.) !  VT-x/AMD-V wins on: •  IN/OUT instructions •  system calls •  no traps for priv. instructions •  almost all code runs “directly” 26
  • 27. VMexit Latencies are getting lower… Intel Architecture VMexit Latencies 1600 1400 1200 Latency (cycles) 1000 800 600 400 200 0 Prescott Cedar Mill Merom Penryn Nehalem (Estimated) !  VMexit performance is critical to hardware assist-based virtualization !  In additional to generational performance improvements, Intel is improving VMexit latencies 27
  • 28. Virtual Memory in a Native OS Process 1 Process 2 0 4GB 0 4GB Virtual VA Memory Physical PA Memory !  Applications see contiguous virtual address space, not physical memory !  OS defines VA -> PA mapping •  Usually at 4 KB granularity: a page at a time •  Mappings are stored in page tables 28
  • 29. Virtual Memory (ctd) Process 1 Process 2 0 4GB 0 4GB Virtual VA Memory Physical PA Memory !  Applications see contiguous virtual address space, not physical memory !  OS defines VA -> PA mapping TLB VA→PA mapping •  Usually at 4 KB granularity VA PA •  Mappings are stored in page tables !  HW memory management unit (MMU) %cr3 ... •  Page table walker TLB fill hardware •  TLB (translation look-aside buffer) 29
  • 30. Virtualizing Virtual Memory VM 1 VM 2 Process 1 Process 2 Process 1 Process 2 Virtual VA Memory Physical PA Memory Machine MA Memory !  To run multiple VMs on a single system, another level of memory virtualization must be done •  Guest OS still controls virtual to physical mapping: VA -> PA •  Guest OS has no direct access to machine memory (to enforce isolation) !  VMM maps guest physical memory to actual machine memory: PA -> MA 30
  • 31. Virtualizing Virtual Memory Shadow Page Tables VM 1 VM 2 Process 1 Process 2 Process 1 Process 2 Virtual VA Memory Physical PA Memory Machine MA Memory !  VMM builds “shadow page tables” to accelerate the mappings •  Shadow directly maps VA -> MA •  Can avoid doing two levels of translation on every access •  TLB caches VA->MA mapping •  Leverage hardware walker for TLB fills (walking shadows) •  When guest changes VA -> PA, the VMM updates shadow page tables 31
  • 32. 3-way Performance Trade-off in Shadow Page Tables !  1. Trace costs •  VMM must intercept Guest writes to primary page tables •  Propagate change into shadow page table (or invalidate) !  2. Page fault costs •  VMM must intercept page faults •  Validate shadow page table entry (hidden page fault), or forward fault to Guest (true page fault) !  3. Context switch costs •  VMM must intercept CR3 writes •  Activate new set of shadow page tables !  Finding good trade-off is crucial for performance !  VMware has 9 years of experience here 32
  • 33. !  VMware currently supports and Scaling to Wide vSMP Shadow Page Tables up to 4-way vSMP !  Problems lurk in scaling to higher numbers of vCPUs •  Per-vcpu shadow page tables •  High memory overhead •  Process migration costs (cold shadows/lack of shadows) •  Remote trace events costlier than local events •  vcpu-shared shadow page tables •  Higher synchronization costs in VMM !  Can already see this in extreme cases •  forkwait is slower on vSMP than a uniprocessor VM 33
  • 34. 2nd Generation Hardware Assist Nested/Extended Page Tables VA→PA mapping Guest PT ptr ... TLB VA MA TLB fill guest hardware VMM Nested PT ptr PA→MA mapping 34
  • 35. Analysis of NPT !  MMU composes VA->PA and PA->MA mappings on the fly at TLB fill time !  Benefits •  Significant reduction in “exit frequency” •  No trace faults (primary page table modifications as fast as native) •  Page faults require no exits •  Context switches require no exits •  No shadow page table memory overhead •  Better scalability to wider vSMP •  Aligns with multi-core: performance through parallelism !  Costs •  More expensive TLB misses: O(n2) cost for page table walk, where n is the depth of the page table tree 35
  • 36. Analysis of NPT !  MMU composes VA->PA and PA->MA mappings on the fly at TLB fill time !  Benefits •  Significant reduction in “exit frequency” •  No trace faults (primary page table modifications as fast as native) •  Page faults require no exits •  Context switches require no exits •  No shadow page table memory overhead •  Better scalability to wider vSMP •  Aligns with multi-core: performance through parallelism !  Costs •  More expensive TLB misses: O(n2) cost for page table walk, where n is the depth of the page table tree 36
  • 37. Improving NPT Performance Large pages !  2 MB today, 1 GB in the future •  In part guest’s responsibility: “inner” page tables •  For most guests/workloads this requires explicit setup •  In part VMM’s responsibility: “outer” page tables •  ESX will take care of it !  1st benefit: faster page walks (fewer levels to traverse) !  2nd benefit: fewer page walks (increased TLB capacity) TLB MMU 37
  • 38. Hardware-assisted Memory Virtualization Efficiency Improvement 60% 50% 40% 30% 20% 10% 0% Apache Compile SQL Server Citrix XenApp Efficiency Improvement 38
  • 40. Performance Help from the Hypervisor !  Take advantage of new Hardware •  Utilize multi-core systems easily without changing the app or OS •  Leverage 64-bit memory hardware sizes with existing 32-bit VMs •  Take advantage of newer high performance I/O + networking asynchronously from guest-OS changes/revs. !  More flexible Storage •  More options for distributed, reliable boot •  Leverage low-cost, high performance NFS, iSCSI I/O for boot or data without changing the guest OS !  Distributed Resource Management •  Manage Linux, Solaris, Windows with one set of metrics and tools •  Manage horizontal apps with cluster-aware resource management 40
  • 41. CPU and Memory Paravirtualization Paravirtualization extends the File guest to allow direct interaction System with the underlying hypervisor Guest TCP/IP Paravirtualization reduces the monitor cost including memory and System call operations. Monitor Monitor Gains from paravirtualization Virtual NIC Virtual SCSI are workload specific Memory VMkernel Virtual Switch File System Scheduler Allocator Hardware virtualization mitigates the need for some of NIC Drivers I/O Drivers the paravirtualization calls VMware approach: VMI and paravirt-ops Physical Hardware 41
  • 42. Device Paravirtualization Device Paravirtualization places File A high performance virtualization- System Aware device driver into the guest Guest TCP/IP pvdriver Paravirtualized drivers are more CPU efficient (less CPU over- head for virtualization) Monitor pvdevice Virtual SCSI Paravirtualized drivers can Memory also take advantage of HW VMkernel Scheduler Allocator Virtual Switch File System features, like partial offload (checksum, large-segment) NIC Drivers I/O Drivers VMware ESX uses para- virtualized network drivers Physical Hardware 42
  • 43. Storage – Fully virtualized via VMFS and Raw Paths Guest OS Guest OS Guest OS /dev/hda /dev/hda /dev/hda VMFS database1.vmdk database2.vmdk FC LUN FC or iSCSI LUN ! RAW ! VMFS ! RAW provides direct access to ! Leverage templates and quick provisioning a LUN from within the VM ! Fewer LUNs means you don’t have to ! Allows portability between physical and watch Heap virtual ! Scales better with Consolidated Backup ! RAW means more LUNs ! Preferred Method •  More provisioning time ! Advanced features still work 43
  • 44. Optimized Network Performance Network stack and drivers ere implemented in ESX layer (not in the guest) File TCP/IP System VMware’s strategy is to Guest optimize the network stack in the ESX layer, and keep the guest 100% agnostic of the underlying hardware Monitor This enables full-virtualization Virtual NIC Virtual SCSI capabilities (vmotion etc) Memory VMkernel Scheduler Allocator Virtual Switch File System ESX Stack is heavily Performance optimized NIC Drivers I/O Drivers ESX Focus: stateless offload; including LSO (large segment Offload), Checksum offload, 10Gbe perf, Multi-ring NICs Physical Hardware 44
  • 45. Guest-Transparent NFS and iSCSI iSCSI and NFS Virtualization in VMware ESX iSCSI and NFS are growing File To be popular, due to their TCP/IP System Guest low port/switch/fabric costs Virtualization provides the ideal mechanism to transparently adopt iSCSI/NFS Monitor Guests don’t need iSCSI/NFS Virtual NIC Virtual SCSI Drivers: they continue to see VMkernel Memory SCSI Virtual Switch Scheduler Allocator iSCSI Or NFS VMware ESX 3 provides high NIC Drivers Performance NFS and iSCSI Stacks Futher emphasis on 1Gbe/ Physical 10Gbe performance Hardware 45
  • 46. INTRODUCTION TO PERFORMANCE MONITORING 46
  • 47. Traditional Architecture Operating system performs various roles •  Application Runtime Libraries •  Resource Management (CPU, Memory etc) •  Hardware + Driver management " Performance & Scalability of the OS was paramount " Performance Observability tools are a feature of the OS 47
  • 48. Performance in a Virtualized World The OS takes on the role of a Library, Virtualization layer grows Application Run-time Libraries and Services Application-Level Service Management Application-decomposition of performance Run-time or Deployment OS Local Scheduling and Memory Management Local File System Infrastructure OS (Virtualization Layer) Scheduling Resource Management Device Drivers I/O Stack File System Volume Management Network QoS Firewall Power Management Fault Management Performance Observability of System Resources 48
  • 49. Performance Management Trends Partitioning Distributed Resource Service-Oriented/ Management Service-Level Driven Web App DB ESX 1.x vSphere PaaS, Appspeed 49
  • 50. Performance Measurement !  Three basic performance measurement metrics: •  Throughput: Transactions per/Sec, Instructions Retired per sec, MB/sec, IOPS, etc, … •  Latency: How long does it take •  e.g., Response time •  Utilization: How much resource is consumed to perform a unit of work !  Latency and throughput are often inter-related, latency becomes important for smaller jobs 50
  • 51. Throughput, Queues and Latency Customers Serviced Arriving (throughput is Queue Customers customers (how many people in (arrivals per minute) Checkout service per queue) Utilization = percentage minute) of time busy serving customers queue time service time response time 51
  • 52. Mathematical Representation, terms Arriving Queue Customers Checkout Utilization = busy-time at server / time elapsed input output server queue time service time response time 52
  • 53. Throughput,Utilization and Response time are connected The Buzen and Denning Method 53
  • 54. Relationship between Utilization and Response Time 54
  • 55. Summary of Queuing and Measurements !  Utilization is a measure of the resources, not quality of service •  We can measure utilization (e.g. CPU), but don’t assume good response time •  Measuring service time and queuing (Latency) is much more important !  Throughput shows how much work is completed only •  Quality of service (response time) may be compromised if there is queuing or slow service times. !  Make sure your key measurement indicators represent what constitutes good performance for your users •  Measure end-user latency of users •  Measure throughput and latency of a system !  Common mistakes •  Measure something which has little to do with end-user happiness/performance •  Measure utilization only •  Measure throughput of an overloaded system with a simple benchmark, resulting in artificially high results since response times are bad 55
  • 56. Potential Impacts to Performance !  Virtual Machine Contributors Latency: •  CPU Overhead can contribute to latency •  Scheduling latency (VM runnable, but waiting…) •  Waiting for a global memory paging operation •  Disk Reads/Writes taking longer !  Virtual machine impacts to Throughput: •  Longer latency, but only if the application is thread-limited •  Sub-systems not scaling (e.g. I/O) !  Virtual machine Utilization: •  Longer latency, but only if the application is thread-limited 56
  • 57. Comparing Native to Virtualized Performance !  Pick the key measure •  Not always Utilization •  User response-time and throughput might be more important !  It’s sometimes possible to get better virtual performance •  Higher throughput: Can use multiple-VMs to scale up higher than native •  Memory sharing can reduce total memory footprint !  Pick the right benchmark •  The best one is your real application •  Avoid micro-benchmarks: they often emphasize the wrong metric •  especially in virtualized environments 57
  • 58. Performance Tricks and Catches !  Can trade-off utilization for latency •  Offloading to other CPUs can improve latency of running job at the cost of more utilization •  A good thing in light of multi-core !  Latency and Throughput may be skewed by time •  If the time measurement is inaccurate, so will be the latency or throughput measurements •  Ensure that latency and throughput are measured from a stable time source 58
  • 59. Time keeping in Native World !  OS time keeping •  OS programs the timer hardware to deliver timer interrupts at specified frequency •  Time tracked by counting timer interrupts •  Interrupts are masked in critical section of the OS code •  Time loss is inevitable however rate of progress of time is nearly constant !  Hardware time keeping •  TSC: Processor maintains Time Stamp Counter. Applications can query TSC (RDTSC instruction) for high precision time •  Not accurate when processor frequency varies (e.g. Intel’s Speedstep) 59
  • 60. Time keeping in Virtualized World !  OS time keeping •  Time progresses in the guest with the delivery of virtual timer interrupts •  Under CPU over commitment timer interrupts may not be delivered to the guest at the requested rate •  Lost ticks are compensated with fast delivery of timer interrupts •  Rate of progress of time is not constant (Time sync does not address this issue) !  Hardware time keeping •  TSC: Guest OSes see pseudo-TSC that is based on physical CPU TSC •  TSC’s may not be synchronized between physical CPUs •  RDTSC is unreliable if the VM migrates between physical CPUs or across host (Vmotion) 60
  • 61. Native-VM Comparison Pitfalls (1 of 3) !  Guest reports clock speed of the underlying physical processor •  Resource pool settings may limit the CPU clock cycles •  Guest may not get to use the CPU all the time under contention with other virtual machines !  Guest reports total memory allocated by the user •  This doesn’t have to correspond to the actual memory currently allocated by the hypervisor 61
  • 62. Native-VM Comparison Pitfalls (2 of 3) !  Processor Utilization accounting •  Single threaded application can ping pong between CPUs •  CPU utilization reported in task manager is normalized per CPU •  Windows does not account idle loop spinning !  Available Memory •  Available memory inside the guest may come from swap on the host 62
  • 63. Native-VM Comparison Pitfalls (3 of 3) !  Hardware setup and configuration differences •  Processor: Architecture, cache, clock speed •  Performance difference between different architecture is quite substantial •  L2, L3 cache size impacts performance of some workload •  Clock speed becomes relevant only when the architecture is the same •  Disk : Local dedicated disk versus shared SAN •  Incorrect SAN configuration could impact performance •  File system: Local file system versus Distributed VMFS •  Distributed file systems (VMFS) have locking overhead for metadata updates •  Network: NIC adapter class, driver, speed/duplex " Slower hardware can outperform powerful hardware when the latter shares resources with more than one OS/Application 63
  • 64. Virtualized World Implications !  Guest OS metrics •  Performance metrics in the guest could be skewed when the rate of progress of time is skewed •  Guest OS resource availability can give incorrect picture !  Resource availability •  Resources are shared, hypervisors control the allocation •  Virtual machines may not get all the hardware resources !  Performance Profiling •  Hardware performance counters are not virtualized •  Applications cannot use hardware performance counters for performance profiling in the guest !  Virtualization moves performance measurement and management to the hypervisor layer 64
  • 65. Approaching Performance Issues •  Make sure it is an apples-to-apples comparison •  Check guest tools & guest processes •  Check host configurations & host processes •  Check VirtualCenter client for resource issues •  Check esxtop for obvious resource issues •  Examine log files for errors •  If no suspects, run microbenchmarks (e.g., Iometer, netperf) to narrow scope •  Once you have suspects, check relevant configurations •  If all else fails…discuss on the Performance Forum 65
  • 66. Tools for Performance Analysis !  VirtualCenter client (VI client): •  Per-host and per-cluster stats •  Graphical Interface •  Historical and Real-time data !  esxtop: per-host statistics •  Command-line tool found in the console-OS !  SDK •  Allows you to collect only the statistics they want !  All tools use same mechanism to retrieve data (special vmkernel calls) 66
  • 67. Important Terminology File TCP/IP System Service vCPU Console Guest Virtual Disk cCPU VMHBA Monitor Monitor vNIC Virtual NIC Virtual SCSI Memory VMkernel Virtual Switch File System Scheduler Allocator NIC Drivers I/O Drivers HBA Physical Hardware pCPU Physical Disk pNIC 67
  • 68. VI Client Chart Type Real-time vs. Historical Object Counter type Rollup Stats type 68
  • 69. VI Client !  Real-time vs. archived statistics (past hour vs. past day) !  Rollup: representing different stats intervals !  Stats Type: rate vs. number !  Objects (e.g., vCPU0, vCPU1, all CPUs) !  Counters (e.g., which stats to collect for a given device) !  Stacked vs. Line charts 69
  • 70. Real-time vs. Historical stats !  VirtualCenter stores statistics at different granularities Time Interval Data frequency Number of samples Past Hour (real-time) 20s 180 Past Day 5 minutes 288 Past Week 15 minutes 672 Past Month 1 hour 720 Past Year 1 day 365 70
  • 71. Stats Infrastructure in vSphere 4. Rollups DB ESX 3. Send 5-min stats to DB ESX vCenter Server (vpxd, tomcat) 1. Collect 2. Send 5-min stats 20s and to vCenter ESX 5-min host and VM stats 71
  • 72. Rollups 1.  Past-Day (5-minutes) " Past-Week 2.  Past-Week (30-minutes) " Past-Month 3.  Past-Month (2-hours) " Past-Year 4.  (Past-Year = 1 data point per day) DB DB only archives historical data •  Real-time (i.e., Past hour) NOT archived at DB •  Past-day, Past-week, etc. " Stats Interval •  Stats Levels ONLY APPLY TO HISTORICAL DATA 72
  • 73. Anatomy of a Stats Query: Past-Hour (“RealTime”) Stats DB ESX 1. Query Client ESX vCenter Server (vpxd, tomcat) 3. Response 2. Get stats from host ESX No calls to DB Note: Same code path for past-day stats within last 30 minutes 73
  • 74. Anatomy of a Stats Query: Archived Stats DB ESX 2. Get stats 1. Query Client ESX vCenter Server (vpxd, tomcat) 3. Response ESX No calls to ESX host (caveats apply) Stats Level = Store this stat in the DB 74
  • 75. Stats type !  Statistics type: rate vs. delta vs. absolute Statistics type Description Example Rate Value over the CPU Usage (MHz) current interval Delta Change from CPU Ready time previous interval Absolute Absolute value Memory Active (independent of interval) 75
  • 76. Objects and Counters !  Objects: instances or aggregations of devices •  Examples: VCPU0, VCPU1, vmhba1:1:2, aggregate over all NICs !  Counters: which stats to collect •  Examples: •  CPU: used time, ready time, usage (%) •  NIC: network packets received •  Memory: memory swapped 76
  • 77. Stacked vs. Line charts !  Line •  Each instance shown separately !  Stacked •  Graphs are stacked on top of each other •  Only applies to certain kinds of charts, e.g.: •  Breakdown of Host CPU MHz by Virtual Machine •  Breakdown of Virtual Machine CPU by VCPU 77
  • 78. esxtop !  What is esxtop ? •  Performance troubleshooting tool for ESX host •  Displays performance statistics in rows and column format Fields Entities -running worlds in this case 78
  • 79. esxtop FAQ !  Where to get it? •  Comes pre-installed with ESX service console •  Remote version of esxtop (resxtop) ships with the Remote Command Line interface (RCLI) package !  What are its intended use cases? •  Get a quick overview of the system •  Spot performance bottlenecks !  What it is not meant for ? •  Not meant for long term performance monitoring, data mining, reporting, alerting etc. Use VI client or the SDK for those use cases 79
  • 80. esxtop FAQ !  What is the difference between esxtop and resxtop esxtop VMKernel Service Console ESX resxtop Network hostd VMKernel Linux client machine ESXi / ESX 80
  • 81. Introduction to esxtop !  Performance statistics •  Some are static and don’t change during runtime, for example MEMSZ (memsize), VM Name etc •  Some are computed dynamically, for example CPU load average, memory over-commitment load average etc •  Some are calculated from the delta between two successive snapshots. Refresh interval (-d) determines the time between successive snapshots •  for example %CPU used = ( CPU used time at snapshot 2 - CPU used time at snapshot 1 ) / time elapsed between snapshots 81
  • 82. esxtop modes !  Interactive mode (default) •  Shows data in the screen and accepts keystrokes •  Requires TERM=xterm !  Batch mode (-b) •  Dumps data to stdout in CSV format •  Dumps default fields or fields stored in the configuration file !  Replay mode (-R) •  Replays data from vm-support performance snapshot 82
  • 83. esxtop interactive mode !  Global commands •  space - update display •  s - set refresh interval (default 5 secs) •  f - select fields (context sensitive) •  W - save configuration file (~/.esxtop3rc) •  V - view VM only •  oO - Change the order of displayed fields (context sensitive) •  ? - help (context sensitive) •  ^L - redraw screen •  q - quit 83
  • 84. esxtop screens ! Screens •  c: cpu (default) •  m: memory •  n: network VM VM VM VM •  d: disk adapter •  u: disk device (added in ESX 3.5) •  v: disk VM (added in ESX 3.5) CPU Memory Virtual vSCSI Scheduler Scheduler Switch •  i: Interrupts (new in ESX 4.0) •  p: power management (new in ESX 4.1) c, i, p m n d, u, v VMkernel 84
  • 85. Using screen Time Uptime running worlds fields hidden from the view… • Worlds = VMKernel processes • ID = world identifier • GID = world group identifier • NWLD = number of worlds 85
  • 86. Using screen - expanding groups press ‘e’ key • In rolled up view stats are cumulative of all the worlds in the group • Expanded view gives breakdown per world • VM group consists of mks, vcpu, vmx worlds. SMP VMs have additional vcpu and vmm worlds • vmm0, vmm1 = Virtual machine monitors for vCPU0 and vCPU1 respectively 86
  • 87. esxtop replay mode !  To record esxtop data •  vm-support -S -d <duration> !  To replay •  tar xvzf vm-support-dump.tgz •  cd vm-support-*/ •  esxtop -R ./ (esxtop version should match) 87
  • 88. esxtop replay mode Current time 88
  • 89. esxtop batch mode !  Batch mode (-b) •  Produces windows perfmon compatible CSV file •  CSV file compatibility requires fixed number of columns on every row - statistics of VMs/worlds instances that appear after starting the batch mode are not collected because of this reason •  Only counters that are specified in the configuration file are collected, (-a) option collects all counters •  Counters are named slightly differently 89
  • 90. esxtop batch mode !  To use batch mode •  esxtop -b > esxtop_output.csv !  To select fields •  Run esxtop in interactive mode •  Select the fields •  Save configuration file (‘w’ key) !  To dump all fields •  esxtop -b -a > esxtop_output.csv 90
  • 91. esxtop batch mode – importing data into perfmon 91
  • 92. esxtop batch mode – viewing data in perfmon 92
  • 93. esxtop batch mode – trimming data Trimming data Saving data after trim 93
  • 95. SDK !  Use the VIM API to access statistics relevant to a particular user !  Can only access statistics that are exported by the VIM API (and thus are accessible via esxtop/VI client) 95
  • 96. Conclusions !  Always Analyze with a Latency approach •  Response time of user •  Queuing for resources in the guest •  Queuing for resources in vSphere •  Queing for resources outside of the host (SAN, NAS etc) !  These tools are useful in different contexts •  Real-time data: esxtop •  Historical data: VirtualCenter •  Coarse-grained resource/cluster usage: VirtualCenter •  Fine-grained resource usage: esxtop 96
  • 98. CPUs and Scheduling o  Schedule virtual CPUs on physical CPUs o  Virtual time based proportional- share CPU scheduler Guest Guest Guest o  Flexible and accurate rate-based controls over CPU time allocations o  NUMA/processor/cache topology Monitor Monitor Monitor aware o  Provide graceful degradation in over-commitment situations VMkernel Scheduler o  High scalability with low scheduling latencies o  Fine-grain built-in accounting for workload observability o  Support for VSMP virtual machines Physical CPUs 98
  • 99. Resource Controls !  Reservation •  Minimum service level guarantee (in MHz) Total Mhz •  Even when system is overcommitted •  Needs to pass admission control Limit !  Shares •  CPU entitlement is directly proportional to VM's shares and depends on the total number of Shares shares issued apply here •  Abstract number, only ratio matters !  Limit Reservation •  Absolute upper bound on CPU entitlement (in MHz) •  Even when system is not overcommitted 0 Mhz 99
  • 100. Resource Control Example Add 2nd VM Add 3rd VM 100% ► with same 50% ► with same number number 33.3% of shares of shares ▼ Set 3rd VM’s limit to 25% of total capacity FAILED Add 4th VM Set 1st VM’s with reservation reservation to ADMISSION ◄ set to 75% of 50% of total ◄ 37.5% CONTROL total capacity 50% capacity 100
  • 101. Resource Pools !  Motivation •  Allocate aggregate resources for sets of VMs •  Isolation between pools, sharing within pools •  Flexible hierarchical organization •  Access control and delegation Admin !  What is a resource pool? •  Abstract object with permissions •  Reservation, limit, and shares L: not set Pool A Pool B L: 2000Mhz R: 600Mhz R: not set •  Parent pool, child pools and VMs S: 60 shares S: 40 shares •  Can be used on a stand-alone host or in a cluster (group of hosts) VM1 VM2 VM3 VM4 60% 40% 101
  • 102. Example migration scenario 4_4_0_0 with DRS vCenter HP HP 1 2 ProLiant 1 2 ProLiant OVER DL380G6 OVER DL380G6 1 2 TEMP 1 5 1 2 TEMP 1 5 POWER POWER POWER POWER SUPPLY SUPPLY INTER PL A Y ER SUPPLY SUPPLY INTER PL A Y ER LOCK LOCK POWER CAP POWER CAP DIMMS DIMMS 1A 3G 5E 7C 9i 9i 7C 5E 3G 1A 1A 3G 5E 7C 9i 9i 7C 5E 3G 1A 2 6 2 6 2D 4B 6H 8F 8F 6H 4B 2D 2D 4B 6H 8F 8F 6H 4B 2D ONLINE ONLINE 1 SPARE 2 1 SPARE 2 PROC PROC PROC PROC MIRROR MIRROR FANS FANS 3 7 3 7 1 2 3 4 5 6 1 2 3 4 5 6 4 8 4 8 Imbalanced Balanced Cluster Cluster 1 1 2 2 OVER TEMP 1 5 HP ProLiant DL380G6 Heavy Load POWER SUPPLY 1 POWER SUPPLY 1 2 2 OVER TEMP INTER LOCK 1 5 PL A Y ER HP ProLiant DL380G6 POWER POWER POWER CAP SUPPLY SUPPLY INTER PL A Y ER DIMMS LOCK 1A 3G 5E 7C 9i 9i 7C 5E 3G 1A POWER CAP DIMMS 1A 3G 5E 7C 9i 9i 7C 5E 3G 1A 2 6 2 6 2D 4B 6H 8F 8F 6H 4B 2D ONLINE 1 SPARE 2 2D 4B 6H 8F 8F 6H 4B 2D ONLINE PROC PROC 1 2 MIRROR SPARE FANS PROC PROC 3 7 MIRROR 1 2 3 4 5 6 FANS 3 7 1 2 3 4 5 6 4 8 4 8 Lighter Load 102
  • 103. DRS Scalability – Transactions per minute (Higher the better) Transactions per minute - DRS vs. No DRS No DRS DRS Already balanced So, fewer gains Higher gains (> 40%) with more imbalance 140000 130000 120000 Transaction per minute 110000 100000 90000 80000 70000 60000 50000 40000 2_2_2_2 3_2_2_1 3_3_1_1 3_3_2_0 4_2_1_1 4_2_2_0 4_3_1_0 4_4_0_0 5_3_0_0 Run Scenario 103
  • 104. DRS Scalability – Application Response Time (Lower the better) Transaction Response Time - DRS vs. No DRS No DRS DRS 70.00 60.00 Transaction Response time (ms) 50.00 40.00 30.00 20.00 10.00 0.00 2_2_2_2 3_2_2_1 3_3_1_1 3_3_2_0 4_2_1_1 4_2_2_0 4_3_1_0 4_4_0_0 5_3_0_0 Run Scenario 104
  • 105. ESX CPU Scheduling States !  World states (simplified view): •  ready = ready-to-run but no physical CPU free •  run = currently active and running •  wait = blocked on I/O !  Multi-CPU Virtual Machines => gang scheduling •  Co-run (latency to get vCPUs running) •  Co-stop (time in “stopped” state) 105
  • 106. Ready Time (1 of 2) !  VM state Run •  running (%used) •  waiting (%twait) •  ready to run (%ready) Ready Wait !  When does a VM go to “ready to run” state •  Guest wants to run or need to be woken up (to deliver an interrupt) •  CPU unavailable for scheduling the VM 106
  • 107. Ready Time (2 of 2) !  Factors affecting CPU availability •  CPU overcommitment •  Even Idle VMs have to be scheduled periodically to deliver timer interrupts •  NUMA constraints •  NUMA node locality gives better performance •  Burstiness – Inter-related workloads •  Tip: Use host anti affinity rules to place inter related workloads on different hosts •  Co-scheduling constraints •  CPU affinity restrictions Fact: Ready time could exist even when CPU usage is low 107
  • 108. Different Metrics for Different Reasons !  Problem Indication •  Response Times, Latency contributors •  Queuing !  Headroom Calculation •  Measure Utilization, predict headroom !  Capacity Prediction •  If I have n users today, how much resource is needed in the future? !  Service Level Prediction •  Predict the effect of response time changes •  Resource or Load changes 108
  • 109. Myths and Fallacies !  High CPU utilization is an indicator of a problem •  Not always: Single threaded compute intensive jobs operate quite happily at 100% !  Less than 100% CPU means service is good (false) •  Not always: Bursty transaction oriented workloads follow littles-law curve, which limits effective utilization to a lower number 109
  • 110. Consider these two workloads 5 5 4 4 3 3 2 2 1 1 0 0 Period 1 Period 2 Period 3 Period 4 Period 1 Period 2 Period 3 Period 4 Utilization is 25% Utilization is 25% Average Response time is high Average Response time is low 110
  • 111. The Buzen and Denning Method 111
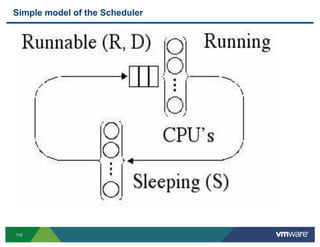
  • 112. Simple model of the Scheduler 112
  • 113. CPU and Queuing Metrics !  How much CPU is too much? •  It’s workload dependent. •  The only reliable metrics is to calculate how much time a workload waits in a queue for CPU •  This must be a measure of guest-level threads (not VMkernel) !  Which is better – a faster CPU or more CPUs? •  Typical question in the physical world •  Question for us: will additional vCPUs help? 113
  • 114. Relationship between Utilization and Response Time 114
  • 115. Tools for diagnosing CPU performance: VI Client !  Basic stuff •  CPU usage (percent) •  CPU ready time (but ready time by itself can be misleading) !  Advanced stuff •  CPU wait time: time spent blocked on IO •  CPU extra time: time given to virtual machine over reservation •  CPU guaranteed: min CPU for virtual machine !  Cluster-level statistics •  Percent of entitled resources delivered •  Utilization percent •  Effective CPU resources: MHz for cluster 115
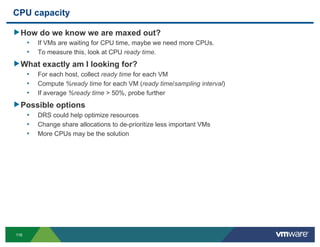
  • 116. CPU capacity ! How do we know we are maxed out? •  If VMs are waiting for CPU time, maybe we need more CPUs. •  To measure this, look at CPU ready time. ! What exactly am I looking for? •  For each host, collect ready time for each VM •  Compute %ready time for each VM (ready time/sampling interval) •  If average %ready time > 50%, probe further ! Possible options •  DRS could help optimize resources •  Change share allocations to de-prioritize less important VMs •  More CPUs may be the solution 116
  • 117. CPU capacity (screenshot from VI Client) Some caveats on ready time Used time !  Used time ~ ready time: may signal contention. However, might not be overcommitted due to workload variability !  In this example, we have periods of activity and idle Ready time ~ used time periods: CPU isn’t overcommitted all the time Ready time < used time 117
  • 118. VI Client CPU screenshot Note CPU milliseconds and percent are on the same chart but use different axes 118
  • 119. Cluster-level information in the VI Client !  Utilization % describes available capacity on hosts (here: CPU usage low, memory usage medium) "  % Entitled resources delivered: best if all 90-100+. 119
  • 120. CPU performance analysis: esxtop !  PCPU(%): CPU utilization !  Per-group stats breakdown •  %USED: Utilization •  %RDY: Ready Time •  %TWAIT: Wait and idling time !  Co-Scheduling stats (multi-CPU Virtual Machines) •  %CRUN: Co-run state •  %CSTOP: Co-stop state !  Nmem: each member can consume 100% (expand to see breakdown) !  Affinity !  HTSharing 120
  • 121. esxtop CPU screen (c) PCPU = Physical CPU CCPU = Console CPU (CPU 0) Press ‘f’ key to choose fields 121
  • 122. New metrics in CPU screen %LAT_C : %time the VM was not scheduled due to CPU resource issue %LAT_M : %time the VM was not scheduled due to memory resource issue %DMD : Moving CPU utilization average in the last one minute EMIN : Minimum CPU resources in MHZ that the VM is guaranteed to get when there is CPU contention 122
  • 123. Troubleshooting CPU related problems !  CPU constrained SMP VM High CPU utilization Both the virtual CPUs CPU constrained 123
  • 124. Troubleshooting CPU related problems !  CPU limit Max Limited CPU Limit AMAX = -1 : Unlimited 124
  • 125. Troubleshooting CPU related problems !  CPU contention VMs don’t get 4 CPUs, all at 3 SMP VMs to run all the %ready 100% time accumulates 125
  • 126. Further ready time examination High Ready Time High MLMTD: there is a limit on this VM… "High ready time not always because of overcommitment "When you see high ready time, double-check if limit is set 126
  • 127. Troubleshooting CPU related problems !  SMP VM running UP HAL/Kernel It is also possible that you are running a single threaded application in a SMP VM vCPU 1 not used by the VM 127
  • 128. Troubleshooting CPU related problems !  High CPU activity in the Service Console Some process in the service console is hogging CPU Not much activity in the service console VMKernel is doing some activity on behalf of the console OS - cloning in this case 128
  • 129. VI Client and Ready Time Used time "   Usedtime ~ ready time: may signal contention. However, might not be overcommitted due to workload variability "   In this example, we have periods of activity and idle periods: CPU isn’t overcommitted all the time Ready time ~ used time Ready time < used time 129
  • 130. CPU Performance !  vSphere supports eight virtual processors per VM •  Use UP VMs for single-threaded applications •  Use UP HAL or UP kernel •  For SMP VMs, configure only as many VCPUs as needed •  Unused VCPUs in SMP VMs: •  Impose unnecessary scheduling constraints on ESX Server •  Waste system resources (idle looping, process migrations, etc.) 130
  • 131. CPU Performance !  For threads/processes that migrate often between VCPUs •  Pin the guest thread/process to a particular VCPU •  Pinning guest VCPUs to PCPUs rarely needed !  Guest OS timer interrupt rate •  Most Windows, Linux 2.4: 100 Hz •  Most Linux 2.6: 1000 Hz •  Recent Linux: 250 Hz •  Upgrade to newer distro, or rebuild kernel with lower rate 131
  • 132. Performance Tips !  Idling VMs •  Consider overhead of delivering guest timer interrupts •  Lowering guest periodic timer interrupt rate should help !  VM CPU Affinity •  Constrains the scheduler: can cause imbalances •  Reservations may not be met – use on your own risk !  Multi-core processors with shared caches •  Performance characteristics heavily depend on the workload •  Constructive/destructive cache interference 132
  • 133. Performance Tips !  SMP VMs •  Use as few virtual CPUs as possible •  Consider timer interrupt overhead of idling CPUs •  Co-scheduling overhead increases with more VCPUs •  Use SMP kernels in SMP VMs •  Pinning guest threads to VCPUs may help to reduce migrations for some workloads !  Interactive Workloads (VDI, etc) •  Assign more shares, increase reservations to achieve faster response times 133
  • 134. vSphere Scheduler and HT !  Intel Hyper-threading provides the The default: more CPU appearance of two logical cores for each physical core •  They are somewhat faster than one core but not as fast as two !  Threads sharing cores less CPU than threads with their own cores v v v v !  Threads accessing common v v v v memory will benefit from running on the same socket Physical core !  So, 5+ vCPU VMs must choose between more CPU and faster v Running vCPU memory 134
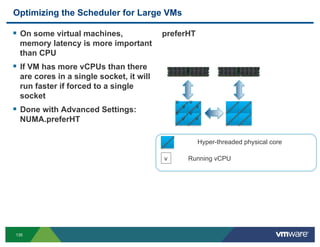
  • 135. Optimizing the Scheduler for Large VMs !  On some virtual machines, preferHT memory latency is more important than CPU !  If VM has more vCPUs than there are cores in a single socket, it will run faster if forced to a single socket v v v v !  Done with Advanced Settings: v v NUMA.preferHT v v Hyper-threaded physical core v Running vCPU 135
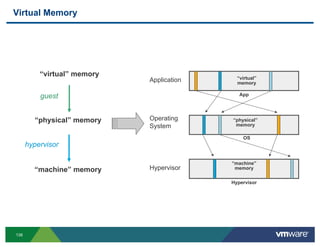
  • 137. Virtual Memory !  Creates uniform memory address space “virtual” memory •  Operating system maps application virtual addresses to physical addresses •  Gives operating system memory management abilities guest transparent to application “physical” memory hypervisor Hypervisor adds extra level of indirection " Maps guest’s physical addresses to machine “machine” memory addresses " Gives hypervisor memory management abilities transparent to guest 137
  • 138. Virtual Memory “virtual” memory guest “virtual” Application memory guest App “physical” memory Operating “physical” System memory hypervisor OS hypervisor “machine” “machine” memory Hypervisor memory Hypervisor 138
  • 139. Application Memory Management •  Starts with no memory •  Allocates memory through syscall to operating system •  Often frees memory voluntarily through syscall •  Explicit memory allocation interface with App operating system OS Hypervi sor 139
  • 140. Operating System Memory Management •  Assumes it owns all physical memory •  No memory allocation interface with hardware •  Does not explicitly allocate or free physical memory •  Defines semantics of “allocated” and “free” App memory •  Maintains “free” list and “allocated” lists of physical memory •  Memory is “free” or “allocated” depending on which list it resides OS Hypervi sor 140
  • 141. Hypervisor Memory Management •  Very similar to operating system memory management •  Assumes it owns all machine memory •  No memory allocation interface with hardware •  Maintains lists of “free” and “allocated” memory App OS Hypervis or 141
  • 142. VM Memory Allocation •  VM starts with no physical memory allocated to it •  Physical memory allocated on demand •  Guest OS will not explicitly allocate •  Allocate on first VM access to App memory (read or write) OS Hyperv isor 142
  • 143. VM Memory Reclamation •  Guest physical memory not “freed” in typical sense •  Guest OS moves memory to its “free” list •  Data in “freed” memory may not have been modified App Guest free list OS "  Hypervisor isn’t aware when guest frees memory " Freed memory state unchanged Hypervi " No access to guest’s “free” list sor " Unsure when to reclaim “freed” guest memory 143
  • 144. VM Memory Reclamation Cont’d !  Guest OS (inside the VM) •  Allocates and frees… •  And allocates and frees… Inside the VM App •  And allocates and frees… VM "  VM Guest free list OS " Allocates… " And allocates… " And allocates… Hyperv isor "  Hypervisor needs some way of reclaiming memory! 144
  • 145. Memory Resource Management !  ESX must balance memory usage •  Page sharing to reduce memory footprint of Virtual Machines •  Ballooning to relieve memory pressure in a graceful way •  Host swapping to relieve memory pressure when ballooning insufficient •  Compression to relieve memory pressure without host-level swapping !  ESX allows overcommitment of memory •  Sum of configured memory sizes of virtual machines can be greater than physical memory if working sets fit !  Memory also has limits, shares, and reservations !  Host swapping can cause performance degradation 145
  • 146. New in vSphere 4.1 – Memory Compression !  Compress memory as a last resort before swapping !  Kicks in after ballooning has failed to maintain free memory !  Reclaims part of the performance lost when ESX is forced to induce swapping 1.20 3.6 1.00 0.99 1.00 0.95 3 Normalized Throughput 1.00 0.99 Swap Read (MB/sec) 0.94 0.80 0.80 0.70 2.4 0.60 0.66 1.8 0.40 1.2 0.42 0.20 0.6 0.00 0 96 80 70 60 50 Host Memory Size (GB) Swap Read with Memory Compression Swap Read w/o Memory Compression Throughput with Memory Compression Throughput w/o Memory Compression 146 K
  • 147. Ballooning, Compression, and Swapping (1) !  Ballooning: Memctl driver grabs pages and gives to ESX •  Guest OS choose pages to give to memctl (avoids “hot” pages if possible): either free pages or pages to swap •  Unused pages are given directly to memctl •  Pages to be swapped are first written to swap partition within guest OS and then given to memctl VM1 VM2 F memctl 2. Reclaim 3. Redistribute Swap partition w/in Guest OS 1. Balloon ESX 147
  • 148. Ballooning, Swapping, and Compression (2) !  Swapping: ESX reclaims pages forcibly •  Guest doesn’t pick pages…ESX may inadvertently pick “hot” pages ("possible VM performance implications) •  Pages written to VM swap file VM1 VM2 Swap Partition (w/in 1. Force Swap ESX VSWP guest) 2. Reclaim (external to guest) 3. Redistribute 148
  • 149. Ballooning, Swapping and Compression (3) !  Compression: ESX reclaims pages, writes to in-memory cache •  Guest doesn’t pick pages…ESX may inadvertently pick “hot” pages ("possible VM performance implications) •  Pages written in-memory cache " faster than host-level swapping VM1 VM2 Swap Partition (w/in 1. Write to Compression Cache ESX guest) 2. Give pages to VM2 Compression Cache 149
  • 150. Ballooning, Swapping, and Compression (4) !  Bottom line: •  Ballooning may occur even when no memory pressure just to keep memory proportions under control •  Ballooning is preferable to compression and vastly preferable to swapping •  Guest can surrender unused/free pages •  With host swapping, ESX cannot tell which pages are unused or free and may accidentally pick “hot” pages •  Even if balloon driver has to swap to satisfy the balloon request, guest chooses what to swap •  Can avoid swapping “hot” pages within guest •  Compression: reading from compression cache is faster than reading from disk 150
  • 151. Transparent Page Sharing !  Simple idea: why maintain many VM 1 VM 2 VM 3 copies of the same thing? •  If 4 Windows VMs running, there are 4 copies of Windows code •  Only one copy needed Hypervi !  Share memory between VMs when sor possible •  Background hypervisor thread identifies identical sets of memory VM 1 VM 2 VM 3 •  Points all VMs at one set of memory, frees the others •  VMs unaware of change Hypervi sor 151
  • 152. Page Sharing in XP XP Pro SP2: 4x1GB 4500 4000 3500 Memory (MB) 3000 Non-Zero 2500 Zero 2000 Backing 1500 Private 1000 500 0 1 5 9 13 17 21 25 29 33 37 41 45 49 53 57 Time (min) Memory footprint of four idle VMs quickly decreased to 300MB due to aggressive page sharing. 152
  • 153. Page Sharing in Vista Vista32: 4x1GB 4500 4000 3500 Memory (MB) 3000 Non-Zero 2500 Zero 2000 Backing 1500 Private 1000 500 0 1 5 9 13 17 21 25 29 33 37 41 45 49 53 57 Time (min) Memory footprint of four idle VMs quickly decreased to 800MB. (Vista has larger memory footprint.) 153
  • 154. Memory capacity ! How do we identify host memory contention? •  Host-level swapping (e.g., robbing VM A to satify VM B). •  Active memory for all VMs > physical memory on host This could mean possible memory over-commitment ! What do I do? •  Check swapin (cumulative), swapout (cumulative) and swapused (“instantaneous”) for the host. Ballooning (vmmemctl) is also useful. •  If swapin and swapout are increasing, it means that there is possible memory over- commitment •  Another possibility: sum up active memory for each VM. See if it exceeds host physical memory. 154
  • 155. Memory Terminology memory size total amount of memory presented to guest allocated memory unallocated memory memory assigned to memory not assigned applications Host memory usage measures this, sorta… active memory inactive memory allocated memory recently allocated memory not accessed or used by recently accessed or used applications Guest memory usage measures this 155
  • 156. Differences Between Memory Statistics ! Biggest difference is physical memory vs. machine memory •  Accounting very different between the two layers! App Physical memory statistics " Active, Balloon, Granted, Shared, OS Swapped, Usage Machine memory statistics Hyperv " Consumed, Overhead, Shared isor Common 156
  • 157. Memory Shared vs. Shared Common ! Memory Shared •  Amount of physical memory whose mapped machine memory has multiple pieces of physical memory mapped to it •  6 pieces of memory (VM 1 & 2) VM 1 VM 2 Memory Shared Common " Amount of machine memory with Hyperv isor multiple pieces of physical memory mapped to it " 3 pieces of memory 157
  • 158. Memory Granted vs. Consumed ! Memory Granted •  Amount of physical memory mapped to machine memory •  9 pieces of memory (VM 1 & 2) VM 1 VM 2 Memory Consumed " Amount of machine memory that has physical memory mapped to it Hyperv isor " 6 pieces of memory Difference due to page sharing! 158
  • 159. Memory Active vs. Host Memory ! Memory Active/Consumed/Shared •  All measure physical memory VM 1 VM 2 Host Memory " Total machine memory on host Hyperv isor Be careful to not mismatch physical and machine statistics! " Guest physical memory can/will be greater than machine memory due to memory overcommitment and page sharing 159
  • 160. Memory Metric Diagram * VM VM memsize granted vmmemctl <unallocated> swapped active active (ballooned) (no stat) zipped write shared guest physical memory zipped - zipSaved shared savings (no stat) <unallocated or <unallocated or used by other used by other overhead consumed VMs> (no stat) VMs> (no stat) host physical memory clusterServices.effectivemem (aggregated over all hosts in cluster) Host sysUsage consumed shared common Service console unreserved (no stat) reserved host physical memory * Figure not to scale! 160
  • 161. Using Host and Guest Memory Usage !  Useful for quickly analyzing VM’s status •  Coarse-grained information •  Important for prompting further investigation !  Requires understanding of memory management concepts •  Many aspects of host/guest memory interaction not obvious 161
  • 162. VI Client: VM list summary Host CPU: avg. CPU utilization for Virtual Machine Host Memory: consumed memory for Virtual Machine Guest Memory: active memory for guest 162
  • 163. Host and Guest Memory Usage 163
  • 164. VI Client !  Main page shows “consumed” memory (formerly “active” memory) !  Performance charts show important statistics for virtual machines •  Consumed memory •  Granted memory •  Ballooned memory •  Shared memory •  Swapped memory •  Swap in •  Swap out 164
  • 165. VI Client: Memory example for Virtual Machine Increase in swap activity No swap activity Swap in Balloon & target Swap out Consumed & granted Active memory Swap usage 165
  • 166. esxtop memory screen (m) Possible states: High, Soft, hard and low PCI Hole COS VMKMEM Physical Memory (PMEM) VMKMEM - Memory managed by VMKernel COSMEM - Memory used by Service Console 166
  • 167. esxtop memory screen (m) Swapping activity in Service Console VMKernel Swapping activity SZTGT : determined by reservation, limit and memory shares SWCUR = 0 : no swapping in the past SWTGT = 0 : no swapping pressure SZTGT = Size target SWR/S, SWR/W = 0 : No swapping activity currently SWTGT = Swap target SWCUR = Currently swapped MEMCTL = Balloon driver SWR/S = Swap read /sec SWW/S = Swap write /sec 167
  • 168. Compression stats (new for 4.1) COWH : Copy on Write Pages hints – amount of memory in MB that are potentially shareable CACHESZ: Compression Cache size CACHEUSD: Compression Cache currently used ZIP/s, UNZIP/s: Memory compression/decompression rate 168
  • 169. Troubleshooting memory related problems (using 4.1 latencies) %LAT_C : %time the VM was not scheduled due to CPU resource issue %LAT_M : %time the VM was not scheduled due to memory resource issue %DMD : Moving CPU utilization average in the last one minute EMIN : Minimum CPU resources in MHZ that the VM is guaranteed to get when there is CPU contention 169
  • 170. Troubleshooting memory related problems !  Swapping VM with Swapped in MCTL: N - Balloon driver Balloon driver the past but Swap target is more Memory not active, tools probably not actively for the VM without the Hog VMs swaps less not installed swapping now balloon driver 170
  • 171. Additional Diagnostic Screens for ESXTOP !  CPU Screen •  PCPU USED(%) – the CPU utilization per physical core or SMT •  PCPU UTIL(%) – the CPU utilization per physical core or SMT thread •  CORE UTIL(%) - GRANT (MB): Amount of guest physical memory mapped to a resource pool or virtual machine. Only used when hyperthreading is enabled. •  SWPWT (%) - Percentage of time the Resource Pool/World was waiting for the ESX VMKernel swapping memory. The %SWPWT (swap wait) time is included in the %WAIT time. !  Memory Screen •  GRANT (MB) - Amount of guest physical memory mapped to a resource pool or virtual machine. The consumed host machine memory can be computed as "GRANT - SHRDSVD". !  Interrupt Screen (new) •  Interrupt statistics for physical devices 171
  • 172. Memory Performance !  Increasing a VM’s memory on a NUMA machine •  Will eventually force some memory to be allocated from a remote node, which will decrease performance •  Try to size the VM so both CPU and memory fit on one node Node 0 Node 1 172
  • 173. Memory Performance !  NUMA scheduling and memory placement policies in ESX 3 manages all VMs transparently •  No need to manually balance virtual machines between nodes •  NUMA optimizations available when node interleaving is disabled !  Manual override controls available •  Memory placement: 'use memory from nodes' •  Processor utilization: 'run on processors' •  Not generally recommended !  For best performance of VMs on NUMA systems •  # of VCPUs + 1 <= # of cores per node •  VM memory <= memory of one node 173
  • 174. Memory Performance !  Page tables •  ESX cannot use guest page tables •  ESX Server maintains shadow page tables •  Translate memory addresses from virtual to machine VA •  Per process, per VCPU •  VMM maintains physical (per VM) to machine maps •  No overhead from “ordinary” memory references !  Overhead PA •  Page table initialization and updates •  Guest OS context switching MA 174
  • 175. Large Pages !  Increases TLB memory coverage Performance Gains •  Removes TLB misses, improves efficiency !  Improves performance of applications that are sensitive to 12% TLB miss costs 10% !  Configure OS and application to leverage large pages 8% •  LP will not be enabled by default 6% 4% 2% 0% Gain (%) 175
  • 176. Large Pages and ESX Version !  ESX 3.5: Large pages enabled manually for guest operations only !  ESX 4.0: •  With EPT/RVI: all memory backed by large pages •  Without EPT/RVI: manually enabled, liked ESX 3.5 Host Small Pages Host Large Pages Guest Small Pages Baseline Performance Efficient kernel operations, improved TLB for guest operations Guest Large Pages Improved page table Improved page table, performance improved TLB 176
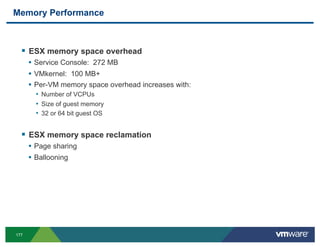
  • 177. Memory Performance !  ESX memory space overhead •  Service Console: 272 MB •  VMkernel: 100 MB+ •  Per-VM memory space overhead increases with: •  Number of VCPUs •  Size of guest memory •  32 or 64 bit guest OS !  ESX memory space reclamation •  Page sharing •  Ballooning 177
  • 178. Memory Performance !  Avoid high active host memory over-commitment •  Total memory demand = active working sets of all VMs + memory overhead – page sharing •  No ESX swapping: total memory demand < physical memory !  Right-size guest memory •  Define adequate guest memory to avoid guest swapping •  Per-VM memory space overhead grows with guest memory 178
  • 179. Memory Space Overhead !  Additional memory required to run a guest •  Increases with guest memory size •  Increases with the virtual CPU count •  Increases with the number of running processes inside the guest max Swap reservation Guest memory min Guest Touched memory Fixed memory overhead used during Overhead memory admission control Variable overhead, grows with active processes in the guest 179
  • 180. Memory Space Overhead: Reservation !  Memory Reservation •  Reservation guarantees that memory is not swapped •  Overhead memory is non-swappable and therefore it is reserved •  Unused guest reservation cannot be used for another reservation •  Larger guest memory reservation could restrict overhead memory growth •  Performance could be impacted when overhead memory is restricted max unused Swap reservation min Guest memory unused Guest reservation Guest Overhead memory Overhead reservation 180
  • 181. Reducing Memory Virtualization Overhead !  Basic idea •  Smaller is faster (but do not undersize the VM) # !  Recommendations •  Right size VM •  avoids overhead of accessing HIGHMEM (>786M) and PAE pages (>4G) in 32-bit VMs •  Smaller memory overhead provides room for variable memory overhead growth •  UP VM •  Memory virtualization overhead is generally lesser •  Smaller memory space overhead •  Tune Guest OS/applications •  Prevent/reduce application soft/hard page faults •  Pre-allocate memory for applications if possible 181
  • 183. Introduction iSCSI and NFS are growing File To be popular, due to their TCP/IP System Guest low port/switch/fabric costs Virtualization provides the ideal mechanism to transparently adopt iSCSI/NFS Monitor Guests don’t need iSCSI/NFS Virtual NIC Virtual SCSI Drivers: they continue to see SCSI Memory VMkernel Virtual Switch iSCSI Scheduler Allocator Or NFS VMware ESX 3 provides high NIC Drivers Performance NFS and iSCSI Stacks Futher emphasis on 1Gbe/ 10Gbe performance Physical Hardware 183
  • 184. Asynchronous I/O (4.0) Application On-loads I/O processing to additional cores File OS Sched System Guest Guest VM issues I/O and continues to run immediately vCPUs pvscsi VMware ESX asynchronously Monitor issues I/Os and notifies the VM upon completion pvscsi VMware ESX can process VMkernel Scheduler Multiple I/Os in parallel on File System separate cpus I/O Drivers Significantly Improves IOPs and CPU efficiency Physical CPUs 184
  • 185. Device Paravirtualization (4.0) Device Paravirtualization places File A high performance virtualization- System Aware device driver into the guest Guest TCP/IP pvscsi vmxnet Paravirtualized drivers are more CPU efficient (less CPU over- head for virtualization) Monitor Paravirtualized drivers can vmxnet pvscsi also take advantage of HW Memory VMkernel Virtual Switch features, like partial offload Scheduler Allocator File System (checksum, large-segment) NIC Drivers I/O Drivers VMware ESX uses para- virtualized network drivers vSphere 4 now provides pvscsi Physical Hardware 185
  • 186. Storage – Fully virtualized via VMFS and Raw Paths Guest OS Guest OS Guest OS /dev/hda /dev/hda /dev/hda VMFS vm1.vmdk vm2.vmdk FC LUN FC or iSCSI LUN ! RAW ! VMFS ! RAW provides direct access to ! Easier provisioning a LUN from within the VM ! Snapshots, clones possible ! Allows portability between physical and ! Leverage templates and quick provisioning virtual ! Scales better with Consolidated Backup ! RAW means more LUNs ! Preferred Method •  More provisioning time ! Advanced features still work 186
  • 187. How VMFS Works VM#1#(Alice)# VM#2#(Bob)# Microsoft Office Microsoft Office outlook.exe outlook.exe Guest Filesystem Guest Filesystem /vms/vm1 /vms/vm2 VMFS Files VMFS Physical Disk FC or iSCSI LUN 187
  • 188. VMFS Clones and Snapshots VM#1#(Alice)# VM#2#(Bob)# Microsoft Office Microsoft Office outlook.exe outlook.exe Guest Filesystem Guest Filesystem Linked Clone Specialized Blocks (Redo Logs) Common OS Base Disk Physical Disk 188
  • 189. I/O Performance !  Disk performance is dependent on many factors: •  Filesystem performance •  Disk subsystem configuration (SAN, NAS, iSCSI, local disk) •  Disk caching •  Disk formats (thick, sparse, thin) !  ESX is tuned for Virtual Machine I/O !  VMFS clustered filesystem => keeping consistency imposes some overheads 189
  • 190. Disk Fundamentals !  Disk performance is impacted by Bandwidth and I/O demands !  Sequential accesses to disk are bandwidth limited •  ~70MBytes/sec for a SATA disk •  ~150Mbytes/sec for a 15k RPM FC disk !  Random Accesses to disk are dominated by seek/rotate •  10k RPM Disks: 150 IOPS max, ~80 IOPS Nominal •  15k RPM Disks: 250 IOPS max, ~120 IOPS Nominal !  Typically hidden behind an array •  ESX sees LUN latency •  Exception is local-disk 190
  • 191. Disk Arrays !  Lowest level resource is disk •  150 IOPS, 70-150MByte/sec VMware ESX !  Disks are aggregated into LUNS HBA1 HBA2 HBA3 HBA4 •  Increase performance and availability !  LUNS can be (should be) cached FC Switch •  Read caches or write caches •  Write caches hide wait-for-write LUN LUN !  Disk arrays share FC Connections •  Typically 200 or 400MBytes/sec Read Write Cache Cache 191
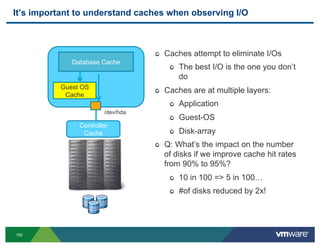
  • 192. It’s important to understand caches when observing I/O " Caches attempt to eliminate I/Os Database Cache " The best I/O is the one you don’t do Guest OS " Caches are at multiple layers: Cache " Application /dev/hda " Guest-OS Controller Cache " Disk-array " Q: What’s the impact on the number of disks if we improve cache hit rates from 90% to 95%? " 10 in 100 => 5 in 100… " #of disks reduced by 2x! 192
  • 193. Observing I/O Performance: Important I/O Terminology File TCP/IP System Service Guest Console Virtual Disk VMHBA Monitor Monitor vNIC (e1000..) SCSI (LSI etc) Memory VMkernel Allocator Virtual Switch VMFS Scheduler NIC Drivers I/O Drivers Physical Hardware HBA Physical Disk 193
  • 194. Disk Latencies Explained Application A = Application Latency File System A Guest R = Perfmon I/O Drivers Windows R Physical Disk Device Queue “Disk Secs/transfer” S S = Windows Physical Disk Service Time Virtual SCSI G G = Guest Latency VMkernel VMFS K K = ESX Kernel Drivers D D = Device Latency 194
  • 195. Let’s look at the vSphere client… Rule of thumb: latency > 20ms is Bad. Here: 1,100ms REALLY BAD!!! 195
  • 196. A Word About Units in vSphere Operation throughput: commands per refresh interval (not IOPS) Bandwidth in KBps (not MBps) 255.46 MBps = 258971 KBps Real-time chart: refresh 20s. 16349 IOPS = 323745 commands/20s 196
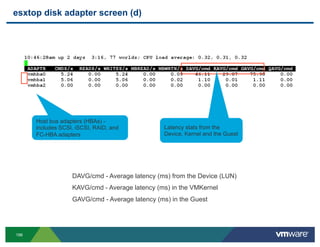
  • 197. Disk Latencies (screenshot of esxtop) Latency seems high After enabling cache, latency is much better 197
  • 198. esxtop disk adapter screen (d) Host bus adapters (HBAs) - includes SCSI, iSCSI, RAID, and Latency stats from the FC-HBA adapters Device, Kernel and the Guest DAVG/cmd - Average latency (ms) from the Device (LUN) KAVG/cmd - Average latency (ms) in the VMKernel GAVG/cmd - Average latency (ms) in the Guest 198
  • 199. esxtop disk device screen (u) LUNs in C:T:L format C:T:L - Controller: Target: Lun 199
  • 200. esxtop disk VM screen (v) running VMs 200
  • 201. Disk screen (d) !  SCSI Reservation stats (new in 4.1) RESV/s : SCSI reservations per second CONS/s: SCSI reservation conflicts per second 201
  • 202. LUN screen (u)  VAAI (vStorage API for Array Integration) Stats (new in 4.1) CLONE_RD, CLONE_WR: Number of Clone read/write requests CLONE_F: Number of Failed clone operations MBC_RD/s, MBC_WR/s – Clone read/write MBs/sec ATS – Number of ATS commands ATSF – Number of failed ATS commands ZERO – Number of Zero requests ZEROF – Number of failed zero requests MBZERO/s – Megabytes Zeroed per second 202
  • 203. VM disk screen  VM disk screen now reports stats using vScsistats (new in 4.1) ESX 3.x and 4.x provides this stats by grouping I/Os based on the world ids 203
  • 204. I/O Latency from NFS Volumes •  vSphere 4.1 enables latency information for NFS based storage 204 K
  • 205. vScsiStats !  Disk I/O characterization of applications is the first step in tuning disk subsystems; key questions: •  I/O block size •  Spatial locality •  I/O interarrival period •  Active queue depth •  Latency •  Read/Write Ratios !  Our technique allows transparent and online collection of essential workload characteristics •  Applicable to arbitrary, unmodified operating systems running in virtual machines 205
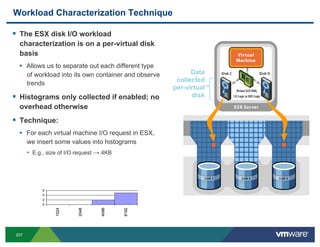
  • 206. Workload Characterization Technique "  Histograms of observed data values can be much more informative than single numbers like mean, median, and standard deviations from the mean " E.g., multimodal behaviors are easily identified by plotting a histogram, but obfuscated by a mean "  Histograms can actually be calculated efficiently online "  Why take one number if you can have a distribution? Made up Example 2500 2000 1500 1000 500 Frequency 0 Mean is 5.3! 1 2 3 4 5 6 7 8 9 10 Latency of an operation (microseconds) 206
  • 207. Workload Characterization Technique !  The ESX disk I/O workload characterization is on a per-virtual disk basis •  Allows us to separate out each different type of workload into its own container and observe Data collected trends per-virtual !  Histograms only collected if enabled; no disk overhead otherwise !  Technique: •  For each virtual machine I/O request in ESX, we insert some values into histograms •  E.g., size of I/O request → 4KB 6 4 2 0 1024 2048 4096 8192 207
  • 208. Workload Characterization Technique Full List of Histograms !  Read/Write Distributions are available for !  I/O Size our histograms •  All, Reads, Writes •  Overall Read/Write ratio? !  Seek Distance •  Are Writes smaller or larger than Reads in this workload? •  All, Reads, Writes •  Are Reads more sequential than Writes? !  Seek Distance Shortest •  Which type of I/O is incurring more latency? Among Last 16 !  In reality, the problem is not knowing !  Outstanding IOs which question to ask •  All, Reads, Writes •  Collect data, see what you find !  I/O Interarrival Times •  All, Reads, Writes !  Latency •  All, Reads, Write 208
  • 209. Workload Characterization Technique Histograms Buckets !  To make the histograms practical, bin sizes are on rather irregular scales •  E.g., the I/O length histogram bin ranges like this: •  …, 2048, 4095, 4096, 8191, 8192, … rather odd: some buckets are big and others are as small as just 1 •  Certain block sizes are really special since the underlying storage subsystems may optimize for them; single those out from the start (else lose that precise information) •  E.g., important to know if the I/O was 16KB or some other size in the interval (8KB,16KB) I/O Length Histogram 3500 3000 2500 2000 Frequency 1500 1000 500 0 512 1024 2048 4095 4096 8191 8192 16383 16384 32768 49152 65535 65536 81920 Length (bytes) 209
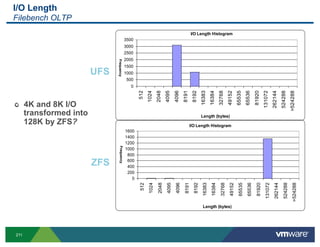
  • 210. Filebench OLTP (Solaris) !  Filebench is a model-based workload generator for file systems developed by Sun Microsystems •  Input to this program is a model file that specifies processes, threads in a workflow !  Filebench OLTP “personality” is a model to emulate an Oracle database server generating I/Os under an online transaction processing workload •  Other personalities include fileserver, webserver, etc. !  Used two different filesystems (UFS and ZFS) •  To study what effect a filesystem can have on I/O characteristics •  Ran filebench on Solaris 5.11 (build 55) 210
  • 211. I/O Length Filebench OLTP I/O Length Histogram 3500 3000 2500 2000 Frequency 1500 UFS 1000 500 0 512 1024 2048 4095 4096 8191 8192 16383 16384 32768 49152 65535 65536 81920 131072 262144 524288 >524288 "  4K and 8K I/O transformed into Length (bytes) 128K by ZFS? I/O Length Histogram 1600 1400 1200 Frequency 1000 800 ZFS 600 400 200 0 1024 2048 4095 4096 8191 8192 512 16383 16384 32768 49152 65535 65536 81920 131072 262144 524288 >524288 Length (bytes) 211
  • 212. Seek Distance Filebench OLTP Seek Distance Histogram 1400 1200 1000 "  Seek distance: a Frequency 800 measure of 600 sequentiality UFS 400 versus randomness 200 in a workload 0 0 2 6 -6 -2 16 64 -64 -16 500 -500 5000 -5000 50000 -50000 500000 -500000 "  Somehow a random workload is Distance (sectors) transformed into a Seek Distance Histogram sequential one by 300 ZFS! 250 "  More details 200 Frequency needed ... ZFS 150 100 50 0 -6 -2 0 2 6 16 64 -500 -64 -16 5000 500 -50000 -5000 50000 500000 -500000 Distance (sectors) 212
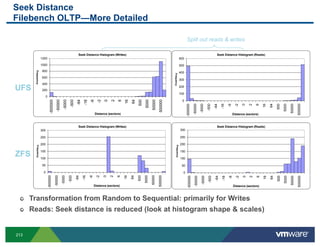
  • 213. Seek Distance Filebench OLTP—More Detailed Split out reads & writes Seek Distance Histogram (Writes) Seek Distance Histogram (Reads) 1200 600 1000 500 800 Frequency 400 Frequency 600 300 400 UFS 200 200 100 0 0 0 2 6 -6 -2 16 64 -64 -16 500 -500 5000 -5000 50000 -50000 500000 -500000 64 -500 2 6 16 -64 -16 -6 -2 0 -50000 500 5000 -5000 50000 500000 -500000 Distance (sectors) Distance (sectors) Seek Distance Histogram (Writes) Seek Distance Histogram (Reads) 300 300 250 250 200 200 Frequency Frequency ZFS 150 150 100 100 50 50 0 0 -6 -2 -500 0 2 6 16 64 -64 -16 5000 -50000 500 -5000 50000 500000 -500000 64 -500 0 2 6 16 -64 -16 -6 -2 500 5000 -50000 -5000 50000 500000 -500000 Distance (sectors) Distance (sectors) "  Transformation from Random to Sequential: primarily for Writes "  Reads: Seek distance is reduced (look at histogram shape & scales) 213
  • 214. Filebench OLTP Summary !  So, what have we learnt about Filebench OLTP? •  I/O is primarily 4K but 8K isn’t uncommon (~30%) •  Access pattern is mostly random •  Reads are entirely random •  Writes do have a forward-leaning pattern •  ZFS is able to transform random Writes into sequential: •  Aggressive I/O scheduling •  Copy-on-write (COW) technique (blocks on disk not modified in place) •  Changes to blocks from app writes are written to alternate locations •  Stream otherwise random data writes to a sequential pattern on disk !  Performed this detailed analysis in just a few minutes 214
  • 215. vscsiStats # vscsiStats -l World group Virtual Machine leader id Name Virtual scsi disk handle ids - unique across virtual machines 215
  • 216. vscsiStats – latency histogram # vscsiStats -p latency -w 118739 -i 8205 Latency in microseconds I/O distribution count 216
  • 217. vscsiStats – iolength histogram # vscsiStats -p iolength -w 118739 -i 8205 I/O block size Distribution Count 217
  • 218. Storage Recommendations !  The fundamental relationship between consumption and supply has not changed •  Spindle count and RAID configuration still rule •  But host demand is an aggregate of VMs !  What is the impact of virtual disk consolidation •  Full isolation •  Shared VMFS VMFS 218 K
  • 219. Differences in VMs !  VMware deployments •  Large set of physical machines consolidated •  Diverse set of applications !  Workload characteristics •  Different IO patterns to the same volume, or •  IO from one app split to different volumes •  Provisioning operations along with applications (Create VM, Power On VM) !  Hypervisor and the storage subsystem •  Clustered file system locking •  CPU and virtual device emulation can impact storage performance !  System setup can affect performance •  Partition alignment affects performance. •  Raw Device Mapping or File system •  New Hardware Assist technology •  CPU and memory affinity settings 219
  • 220. Disk Fundamentals !  Databases are mostly random I/O access patterns !  Accesses to disk are dominated by seek/rotate •  10k RPM Disks: 150 IOPS max, ~80 IOPS Nominal •  15k RPM Disks: 250 IOPS max, ~120 IOPS Nominal !  Database Storage Performance is controlled by two primary factors •  Size and configuration of cache(s) •  Number of physical disks at the back-end 220
  • 221. Disk Performance !  Higher sequential performance (bandwidth) on the outer tracks 221
  • 222. Disk Arrays !  Lowest level resource is disk •  150 IOPS, 70-150MByte/sec VMware ESX !  Disks are aggregated into LUNS HBA1 HBA2 HBA3 HBA4 •  Increase performance and availability !  LUNS can be (should be) cached FC Switch •  Read caches or write caches •  Write caches hide wait-for-write LUN LUN !  Disk arrays share FC Connections •  Typically 200 or 400MBytes/sec Read Write Cache Cache 222
  • 223. LUN Sizing and Its Impact On Load !  In example on the right, ESX B can generate twice as much IO as ESX A !  Improved aggregate throughput of VM a VM b VM c VM d multiple LUNs is the primary reason for thinking RDM is faster !  Implications for the array 32 32 32 •  Greater number of smaller LUNs … … … increases burst intensity 2 2 2 •  Many HBA/LUN pairs could be used simultaneously 1 1 1 •  Smaller number of LUNs stabilizes demand •  Fewer HBA/LUN pairs will be used ESX A ESX B concurrently VMFS 223 S
  • 224. Storage – VMFS or RDM Guest OS Guest OS Guest OS /dev/hda /dev/hda /dev/hda VMFS vm1.vmdk vm2.vmdk FC LUN FC or iSCSI LUN ! RAW ! VMFS ! RAW provides direct access to ! Easier provisioning a LUN from within the VM ! Snapshots, clones possible ! Allows portability between physical and ! Leverage templates and quick provisioning virtual ! Scales better with Consolidated Backup ! RAW means more LUNs ! Preferred Method •  More provisioning time ! Advanced features still work 224
  • 225. VMFS vs. RDM Performance 225
  • 226. Creating VM: Disk Type? When to allocate disk space? As needed Creation Time Thin Disk Zeroed? No Yes Thick Disk When? Creation Time First Use Eager Zeroed Thick Zeroed Thick 226
  • 227. Creating VM: Disk Type? !  Speed Vs Space •  Thin disk is space efficient but higher per IO overhead •  Thick disk has lower per IO overhead but consumes space •  Zeroed thick disk pays extra write cost at the first write •  Eager zeroes thick disk or thick disk gives best performance •  Use vmkfstool to create or convert !  RDM Vs VMFS •  Physical RDM disables VMotion •  VMFS performance is close to the RDM 227
  • 228. VMDK Lazy Zeroing !  Default VMDK allocation policy Effect of Zeroing on Storage “lazy zeroes” 1M VMFS blocks on Performance first write 200 !  Writes on an untouched VMDK incur 180 a penalty 160 !  Difference usually not seen in 140 Throughput (MBps) production 120 •  But common with benchmarks 100 !  Zero offload capability in VAAI 80 improves zeroing in supported 60 arrays 40 20 0 1 host 2 hosts 4 hosts 8 hosts 16 hosts "Post-zeroing" "Zeroing" 228 K
  • 229. Thin Provisioning Performance !  vSphere introduced thin Thin Versus provisioned VMDKs Thick Scalability !  In theory, LUN locking during 200 VMDK growth might hurt 180 performance 160 !  In reality, zeroing more impactful Throughput (MBps) 140 than locking 120 !  ATS and zero-offloading in VAAI 100 enabled arrays will speed up 80 “first-writes” 60 40 20 0 1 host 2 hosts 4 hosts 8 hosts 16 hosts Thick post-zeroing Thin post-zeroing Thick zeroing Thin zeroing 229 K
  • 230. Device Paravirtualization (4.0) Device Paravirtualization places File A high performance virtualization- System Aware device driver into the guest Guest TCP/IP pvscsi vmxnet Paravirtualized drivers are more CPU efficient (less CPU over- head for virtualization) Monitor Paravirtualized drivers can vmxnet pvscsi also take advantage of HW Memory VMkernel Virtual Switch features, like partial offload Scheduler Allocator File System (checksum, large-segment) NIC Drivers I/O Drivers VMware ESX uses para- virtualized network drivers vSphere 4 now provides pvscsi Physical Hardware 230
  • 231. PVSCSI Architecture !  PVSCSI looks like a PCI-E device to the guest OS !  Uses MSI or MSI-X interrupt delivery (instead of legacy INTx) to reduce the cost of interrupt virtualization !  Boot capable !  New Windows/Linux SCSI HBA drivers !  Windows driver uses the Storport driver model !  Exports itself as a Serial Attached SCSI adapter 231
  • 232. Enabling the PVSCSI Driver 232
  • 233. PVSCSI Efficiency PVSCSI Efficiency Improvements for 4K Block IOs 1.2 1 0.8 0.6 0.4 0.2 0 S/W iSCSI Fibre Channel Protocol LSI Logic pvscsi 233
  • 234. Benchmarks for I/O !  Microbenchmarks •  Iometer Macrobenchmarks •  Aiostress " TPC-C/E •  Filebench " MS Exchange •  Orion •  Sqliosim " Oracle •  Jetstress " SQLserver " Etc… 234
  • 235. Storage Contention Problems !  In vSphere 4, an isolated VM can Without Storage IO Control dominate a shared LUN Actual Disk Resources utilized by each VM are not in the correct ratio •  IO shares determine access to LUN relative to other VMs on the same host VM A VM B VM C 1500 500 500 •  A VM can get uncontested access to the Shares Shares Shares device queue negatively affecting VMs ESX Server ESX Server that share the LUN but are running on 12 12 other ESX hosts 25 % •  Regardless of shares, VMs on the same device queue depth device queue depth host contend for one queue 100 % 75% !  Existing storage resource management controls only affects 0 0 VMs on a single host 38% 12% 50 % Storage Array Queue 235 S
  • 236. Storage Contention Solution: Storage IO Control !  SIOC calculates data store latency With Storage IO Control Actual disk resources utilized by each VM to identify storage contention are in the correct ratio even across ESX Hosts •  Latency is normalized, averaged across virtual machines VM A VM B VM C 1500 500 500 •  IO size and IOPS included Shares Shares Shares ESX Server ESX Server !  SIOC enforces fairness when data store latency crosses threshold 24 25 % •  Default of 30 ms •  Sustained for four seconds device queue depth •  Fairness enforced by limiting VMs access to queue slots 75% 6 !  Can have small detrimental effect 100 % on throughput at LUN 0 0 60% 20% 20% Storage Array Queue 236 S
  • 237. Notes and Caveats on SIOC !  SIOC is not a storage panacea •  Important VMs can be protected •  Poorly performing storage remains poorly performing, and the infrastructure suffers! !  SIOC trades throughput for latency •  The feature is enabled when latency crosses a certain threshold, implying a storage bottleneck •  Throughput is throttled for less performance critical VMs to provide fast access to high priority VMs !  SIOC may make some of your happy application owners unhappy •  Your current configuration may allow storage hogs to lock their neighbors out of the array •  When you enable SIOC, these “bad neighbors” will be throttled 237 S
  • 239. VMware ESX Networking Architecture File System Virtual NIC Device TCP/IP Guest •  Full Virt: e1000g •  Paravirt: vmxnet2, •  vSphere adds vmxnet3 Monitor Virtual NIC Virtual SCSI VMkernel Memory Virtual Switch iSCSI/NFS TCP/IP Stack Scheduler Allocator •  For vMotion,iSCSI and NFS •  New v2 Stack for vSphere TCP/IP NIC Drivers Physical Hardware 239
  • 240. VM Network I/O Virtualization !  Guest OS sees a virtual NIC VM •  AMD Lance, Intel e1000, or VMware vmxnet •  Virtual devices acting just like physical one (except vmxnet) •  Each virtual NIC has a unique MAC address •  Up to 4 virtual NICs per VM !  Virtual NIC enhancements •  No physical crystal limiting transmit/receive •  Disallow promiscuous mode •  Disallow MAC address changes by the OS •  Disallow forged source MAC transmits 240
  • 241. ESX Server Networking I/O VM VM Service Virtual NICs Console VMkernel Networking vSwitches VMkernel Uplinks Physical NICs Physical Hardware 241
  • 242. Troubleshooting Networking !  Troubleshoot one component at a time •  Physical NICs ESXi Server •  vNetwork Distributed Switch •  Virtual NICs •  Physical Network !  Tools for troubleshooting •  vSphere Client (aka VI) •  Command Line Utilities vNetwork Distributed •  vSphere CLI Switch VSwitch •  Third party tools VMKernel •  Ping and traceroute •  Traffic sniffers and Protocol Hardware Analyzers •  Wireshark •  Logs 242
  • 243. Sniffing For Trouble !  Sniff for packets at different layers for isolation ESX Server Capture packet traces inside the •  Physical Switch Port Level (SPAN) VM •  VM Level (Promiscuous mode) !  Look for •  Lost Packets •  Large number of packet VSwitch retransmissions VMKernel •  Anomalies reported by protocol analyzers like Wireshark etc. Hardware !  Look for patterns •  Are packets of a certain type causing problems? Mirrored Port •  Are packets of a certain size causing Physical Switch problems? 243
  • 244. Getting Information about the vnic i/o Output of esxtop/resxtop Output of esxcfg-info Real time traffic information Look for Rx/Tx information for the vNIC you are interested in Cumulative Traffic Information Search for the port ID of the vNIC in the esxcfg-info output 244
  • 245. Check the physical NIC !  Check that the right uplinks are connected •  Use vSphere client or esxcfg-vswitch –l !  Check the Rx/Tx counters of the physical nic using esxcfg-info or resxtop !  Check connected physical port •  Use Network Hint or CDP Information about Uplink Port (vmnic4) 245
  • 246. VI Client Networking Statistics !  Mostly high-level statistics •  Bandwidth •  KBps transmitted, received •  Network usage (KBps): sum of TX, RX over all NICs •  Operations/s •  Network packets received during sampling interval (real-time: 20s) •  Network packets transmitted during sampling interval !  Per-adapter and aggregated statistics 246
  • 247. Esxtop Networking Statistics !  Bandwidth •  Receive (MbRX/s), Transmit (MbRX/s) !  Operations/s •  Receive (PKTRX/s), Transmit (PKTTX/s) !  Configuration info •  Duplex (FDUPLX), speed (SPEED) !  Errors •  Packets dropped during transmit (%DRPTX), receive (%DRPRX) 247
  • 248. esxtop network screen (n) Service console NIC Physical NIC PKTTX/s - Packets transmitted /sec Virtual NICs PKTRX/s - Packets received /sec MbTx/s - Transmit Throughput in Mbits/sec MbRx/s - Receive throughput in Mbits/sec Port ID: every entity is attached to a port on the virtual switch DNAME - switch where the port belongs to 248
  • 249. Multicast/Broadcast stats  Multicast/Broadcast stats are new for 4.1 PKTTXMUL/s – Multicast packets transmitted per second PKTRXMUL/s – Multicast packets received per second PKTTXBRD/s – Broadcast packets transmitted per second PKTRXBRD/s – Broadcast packets received per second 249
  • 250. Platform Optimization: Network !  Use a network adapter that supports: •  Checksum offload, TCP segmentation offload (TSO), Jumbo frames (JF) •  Enable JF when hardware is available (default is off!) •  Capability to handle high memory DMA (64-bit DMA addresses) •  Capability to handle multiple scatter/gather elements per Tx frame !  Check configuration •  Ensure host NICs are running with highest supported speed and full-duplex •  NIC teaming distributes networking load across multiple NICs •  Better throughput and allows passive failover !  Use separate NICs to avoid traffic contention •  For Console OS (host management traffic), VMKernel (vmotion, iSCSI, NFS traffic), and VMs 250
  • 251. Jumbo Frames !  Before transmitting, IP layer fragments data into MTU (Maximum Transmission Unit) sized packets •  Ethernet MTU is 1500 bytes •  Receive side reassembles the data !  Jumbo Frames •  Ethernet frame with bigger MTU •  Typical MTU is 9000 bytes •  Reduces number of packets transmitted •  Reduces the CPU utilization on transmit and receive side 251
  • 252. Jumbo Frames !  Linux Guest (VM) •  ifconfig eth0 mtu 9000 TCP/IP Stack !  Windows vNIC •  Device Manager -> Network adapters -> VMware PCI Ethernet Client Adapter -> Properties -> Advanced ESX -> MTU to 9000 TCP/IP Stack Virtual Switch NIC Driver Switches/ Routers 252
  • 253. Jumbo Frames Guest (VM) TCP/IP Stack !  esxcfg-vswitch -m 9000 vSwitch1 vNIC Client ESX TCP/IP Stack Refer switch/router Virtual Switch configuration guide NIC Driver Switches/ Routers 253
  • 254. Jumbo Frames Guest (VM) Linux TCP/IP Stack !  ifconfig eth0 mtu 9000 vNIC Windows !  Device Manager -> Network Client ESX adapters -> VMware PCI Ethernet Adapter -> Properties TCP/IP Stack Virtual Switch -> Advanced -> MTU to 9000 NIC Driver Switches/ Routers 254
  • 255. MTU Size !  Verify it is not a jumbo frame related issue •  Verify that the vnic MTU is the same as the vswitch MTU •  Run ping –s <packet size> from the guest 255
  • 256. Network Traffic Management – Emergence of 10 GigE 1GigE NICs 10 GigE NICs iSCSI FT vMotion NFS iSCSI FT vMotion NFS TCP/IP TCP/IP vSwitch vSwitch 10 GigE 1GigE Traffic Types compete. Who gets what share of the NIC? •  Dedicated NICs for different traffic types •  Traffic typically converged to two 10 GigE e.g. vMotion, IP storage NICs •  Bandwidth assured by dedicated NICs •  Some traffic flows could dominate others through oversubscription 256 K
  • 257. Network IO control – Protect your important bandwidth !  Without Network IO Control •  VM traffic can be impacted by less performance-critical traffic such as vMotion !  With Network IO Control •  VM traffic is protected and can maintain application SLAs •  vMotion is designated lower priority and can take longer * Y-Axis shows number of User Sessions that meet SPECweb2005 latency requirements 257 K
  • 258. Network I/O Control Architecture vMotion FT Mgmt NFS iSCSI vNetwork Distributed Portgroup Teaming Policy Load balanced Shaper teaming Scheduler Scheduler Shares enforcement per Limit enforcement per uplink team •  Note: NetIOC is only supported with vNetwork Distributed Switch (vDS) •  Team: Group of NICs used for load balancing and fault tolerance 258 K
  • 259. CONFIGURING WORKLOADS 259
  • 260. Enterprise Workload Demands vs. Capabilities Workload Requires vSphere 4 Oracle 11g 8vcpus for 95% of DBs 8vcpus per VM 64GB for 95% of DBs 256GB per VM 60k IOPS max for OLTP @ 120k IOPS per VM 8vcpus 9900Mbits/sec per VM 77Mbits/sec for OLTP @ 8vcpus SQLserver 8vcpus for 95% of DBs 8vcpus per VM 64GB @ 8vcpus 256GB per VM 25kIOPS max for OLTP @ 120k IOPS per VM 8vcpus 9900Mbits/sec per VM 115Mbits/sec for OLTP @ 8vcpus SAP SD 8vcpus for 90% of SAP Installs 8vcpus per VM 24GB @ 8vcpus 256GB per VM 1k IOPS @ 8vcpus 120k IOPS per VM 115Mbits/sec for OLTP @ 8vcpus 9900Mbits/sec per VM Exchange 4cpus per VM, Multiple VMs 8vcpus per VM 16GB @ 4vcpus 256GB per VM 260 1000 IOPS for 2000 users 120k IOPS per VM 8Mbits/sec for 2000 users 9900Mbits/sec per VM
  • 261. Databases: Top Ten Tuning Recommendations 1.  Optimize Storage Layout, # of Disk Spindles 2.  Use 64-bit Database 3.  Add enough memory to cache DB, reduce I/O 4.  Optimize Storage Layout, # of Disk Spindles 5.  Use Direct-IO high performance un-cached path in the Guest Operating System 6.  Use Asynchronous I/O to reduce system calls 7.  Optimize Storage Layout, # of Disk Spindles 8.  Use Large MMU Pages 9.  Use the latest H/W – with AMD RVI or Intel EPT 10. Optimize Storage Layout, # of Disk Spindles 261
  • 262. Databases: Workload Considerations ! OLTP ! DSS ! Short Transactions Long Transactions ! Limited number of standardized queries Complex queries ! Small amounts of data accessed Large amounts of data accessed Combines data from different sources ! Uses data from only one source ! I/O Profile ! I/O Profile •  Large, Sequential I/Os (up to 1MB) •  Small Synchronous reads/writes (2k->8k) •  Extreme Bandwidth Required •  Heavy latency-sensitive log I/O •  Heavy ready traffic against data volumes ! Memory and I/O intensive •  Little log traffic ! CPU, Memory and I/O intensive ! Indexing enables higher performance 262
  • 263. Databases: Storage Configuration !  Storage considerations •  VMFS or RDM •  Fibre Channel, NFS or iSCSI •  Partition Alignment •  Multiple storage paths !  OS/App, Data, Transaction Log and TempDB on separate physical spindles !  RAID 10 or RAID5 for Data, RAID 1 for logs !  Queue depth and Controller Cache Settings !  TempDB optimization 263
  • 264. Databases: Storage Hierarchy " In a recent study, we scaled up to Database Cache 320,000 IOPS to an EMC array from a single ESX server. Guest OS " 8K Read/Write Mix Cache " Cache as much as possible in caches /dev/hda " Q: What’s the impact on the number Controller of disks if we improve cache hit rates Cache from 90% to 95%? " 10 in 100 => 5 in 100… " #of disks reduced by 2x! 264
  • 265. Databases: Typical I/O Architecture Database Cache 2k,8k,16k x n 2k, 8k, 16k x n 512->1MB Log DB DB Writes Writes Reads File System FS Cache 265
  • 266. Know your I/O: Use a top-down Latency analysis technique Application A = Application Latency File System A Guest R = Perfmon I/O Drivers Windows R Physical Disk Device Queue “Disk Secs/transfer” S S = Windows Physical Disk Service Time Virtual SCSI G G = Guest Latency VMkernel File System K K = ESX Kernel D D = Device Latency 266
  • 267. Checking for Disk Bottlenecks !  Disk latency issues are visible from Oracle stats •  Enable statspack •  Review top latency events Top 5 Timed Events % Total Event Waits Time (s) Ela Time --------------------------- ------------ ----------- ----------- db file sequential read 2,598 7,146 48.54 db file scattered read 25,519 3,246 22.04 library cache load lock 673 1,363 9.26 CPU time 2,154 934 7.83 log file parallel write 19,157 837 5.68 267
  • 268. Oracle File System Sync vs DIO 268
  • 269. Oracle DIO vs. RAW 269
  • 270. Direct I/O !  Guest-OS Level Option for Bypassing the guest cache •  Uncached access avoids multiple copies of data in memory •  Avoid read/modify/write module file system block size •  Bypasses many file-system level locks !  Enabling Direct I/O for Oracle and MySQL on Linux # vi init.ora # vi my.cnf filesystemio_options=“setall” innodb_flush_method to O_DIRECT Check: Check: # iostat 3 # iostat 3 (Check for I/O size matching the (Check for I/O size matching the DB block size…) DB block size…) 270
  • 271. Asynchronous I/O !  An API for single-threaded process to launch multiple outstanding I/Os •  Multi-threaded programs could just just multiple threads •  Oracle databases uses this extensively •  See aio_read(), aio_write() etc... !  Enabling AIO on Linux # rpm -Uvh aio.rpm # vi init.ora filesystemio_options=“setall” Check: # ps –aef |grep dbwr # strace –p <pid> io_submit()… <- Check for io_submit in syscall trace 271
  • 272. Picking the size of each VM !  vCPUs from one VM stay on one socket* Socket 0 Socket 1 VM Size Options !  With two quad-core sockets, there are only 2 two positions for a 4-way VM !  1- and 2-way VMs can be arranged many ways on quad core socket 12 !  Newer ESX schedulers more efficiency use fewer options •  Relaxed co-scheduling 8 272
  • 273. Use Large Pages !  Guest-OS Level Option to use Large MMU Pages •  Maps the large SGA region with fewer TLB entries •  Reduces MMU overheads •  ESX 3.5 Uniquely Supports Large Pages! !  Enabling Large Pages on Linux # vi /etc/sysctl.conf (add the following lines:) vm/nr_hugepages=2048 vm/hugetlb_shm_group=55 # cat /proc/vminfo |grep Huge HugePages_Total: 1024 HugePages_Free: 940 Hugepagesize: 2048 kB 273
  • 274. Large Pages !  Increases TLB memory coverage Performance Gains •  Removes TLB misses, improves efficiency !  Improves performance of applications that are sensitive to 12% TLB miss costs 10% !  Configure OS and application to leverage large pages 8% •  LP will not be enabled by default 6% 4% 2% 0% Gain (%) 274
  • 275. Linux Versions !  Some older Linux versions have a 1Khz timer to optimize desktop-style applications •  There is no reason to use such a high timer rate on server-class applications •  The timer rate on 4vcpu Linux guests is over 70,000 per second! !  Use RHEL >5.1 or latest tickless timer kernels •  Install 2.6.18-53.1.4 kernel or later •  Put divider=10 on the end of the kernel line in grub.conf and reboot, or default on tickless kernel •  All the RHEL clones (CentOS, Oracle EL, etc.) work the same way 275
  • 276. Java Requires Careful Memory Management Java/SPECjbb (Uses All Available Memory) 1.2 3000 Ballooned/Swapped Memory (MB) 1 2500 0.8 2000 Normalized Throughput 0.6 1500 0.4 1000 0.2 500 0 0 3072 2816 2560 2304 2048 1792 1536 Memory limit (MB) Ballooned size Swapped size Throughout (Balloon only) Throughput (Swapping only) 276 S
  • 277. Managing Memory in Java Environments !  Calculate OS memory !  Estimate JVM needs !  Specify heap exactly !  Reservations = OS + JVM + heap !  Also applies to other applications with static memory needs •  Oracle SGA 277 S
  • 278. For More Information !  VMware’s Performance Technology Pages •  http://vmware.com/technical-resources/performance !  VMware’s Performance Blog •  http://blogs.vmware.com/performance !  Performance Community •  http://communities.vmware.com/community/vmtn/general/performance !  VMware Performance Class •  Check with VMware Education or VMware Authorized Training Center !  VMware Performance Service Offering •  Ask VMware account team 278 S
  • 279. VMware Performance for Gurus Richard McDougall CTO of Application Infrastructure, VMware [email protected] twitter @richardmcdougll © 2010 VMware Inc. All rights reserved