Using Graph Algorithms for Advanced Analytics - Part 2 Centrality
0 likes183 views

What does finding the best location for a warehouse/office/retail store have in common with finding the most influential person in a referral network? Answer: they are both Centrality problems and can be solved with graph algorithms.


Ad
More Related Content
What's hot (20)
Similar to Using Graph Algorithms for Advanced Analytics - Part 2 Centrality (20)


Ad
More from TigerGraph (20)


Ad
Recently uploaded (20)


Using Graph Algorithms for Advanced Analytics - Part 2 Centrality
- 1. Graph Gurus 27 Using Graph Algorithms for Advanced Analytics Part 2 - Centrality 1
- 2. © 2020 TigerGraph. All Rights Reserved Some Housekeeping Items ● Although your phone is muted we do want to answer your questions - submit your questions at any time using the Q&A tab in the menu ● The webinar is being recorded and will uploaded to our website shortly (https://www.tigergraph.com/webinars/) and the URL will be emailed you ● If you have issues with Zoom please contact the panelists via chat 2
- 3. © 2020 TigerGraph. All Rights Reserved Today's Presenter 3 Victor Lee Head of Product Strategy ● BS in Electrical Engineering and Computer Science from UC Berkeley, MS in Electrical Engineering from Stanford University ● PhD in Computer Science from Kent State University focused on graph data mining ● 20+ years in tech industry
- 4. © 2020 TigerGraph. All Rights Reserved Move Faster with TigerGraph Cloud Built for agile teams who would rather build innovative applications than procure hardware or configure and manage databases 4 NEW Cloud Clusters for HA Replication & Distributed Data now available
- 5. © 2020 TigerGraph. All Rights Reserved Today’s Outline 5 1 3 2 Recap of Part 1: The What and Why of Graph Algorithms Demo Running and modifying GSQL Centrality Algorithms Centrality Algorithms How to select and use the right one
- 6. © 2020 TigerGraph. All Rights Reserved Graph algorithms are functions for measuring characteristics of graphs, vertices, or relationships. A graph algorithm library serves as a toolkit and as building blocks for analyzing your data. Specialized functions Combine to make something greater Graph Algorithms 6
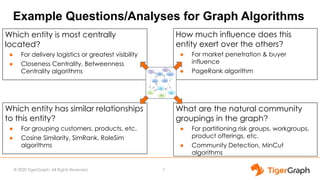
- 7. © 2020 TigerGraph. All Rights Reserved Example Questions/Analyses for Graph Algorithms Which entity is most centrally located? ● For delivery logistics or greatest visibility ● Closeness Centrality, Betweenness Centrality algorithms 7 How much influence does this entity exert over the others? ● For market penetration & buyer influence ● PageRank algorithm Which entity has similar relationships to this entity? ● For grouping customers, products, etc. ● Cosine Similarity, SimRank, RoleSim algorithms What are the natural community groupings in the graph? ● For partitioning risk groups, workgroups, product offerings, etc. ● Community Detection, MinCut algorithms
- 8. © 2020 TigerGraph. All Rights Reserved GSQL Graph Algorithm Library ● Written in GSQL - high-level, parallelized ● Open-source, user-extensible ● Well-documented 8 docs.tigergraph.com/graph-algorithm-library
- 9. © 2020 TigerGraph. All Rights Reserved TigerGraph GSQL Graph Algorithm Library ✓ Call each algorithm as a GSQL query or as a RESTful endpoint ✓ Run the algorithms in-database (don't export the data) ✓ Option to update the graph with the algorithm results ✓ Able to modify/customize the algorithms. Turing-complete language. ✓ Massively parallel processing to handle big graphs 9
- 10. © 2020 TigerGraph. All Rights Reserved Review: Analytics with Graph Algorithms ● Graph Algorithms answer fundamental questions about connected data ● Each algorithm in a library is tool in an analytics toolkit. ● Building Blocks for more complex business questions ● Some questions/algorithms are faster or slower than others 10
- 11. © 2020 TigerGraph. All Rights Reserved Picking the Right Algorithm for the Job To become a master graph craftsperson: ● Learn what each tool can do ● Learn to combine building blocks to solve complex issues This webinar series is designed to show you what each tool can do. We'll also show you some application examples. 11
- 12. © 2020 TigerGraph. All Rights Reserved Some Types of Graph Algorithms ● Search ● Path Finding & Analytics ● Centrality / Ranking ● Clustering / Community Detection ● Similarity ● Classification 12
- 13. © 2020 TigerGraph. All Rights Reserved Centrally Located A B C D E F H G In a network, which node is the most centrally located? ● Location might not be physical ● Edges = road segment, cables who-knows-whom Abstract concept of Travel ● Something (goods, info) is moving across the network 13
- 14. © 2020 TigerGraph. All Rights Reserved Example Questions for Centrality A B C D E F H G Logistics: ● Where to locate a Distribution Center? ● Where to locate a Starbucks or gas station? Social Dynamics: ● Which entity in a social group is the most influential? What do we mean by influence? 14
- 15. © 2020 TigerGraph. All Rights Reserved Centrality for a Distribution Center ● Truck deliveries ● Deliveries might be to any destination in the service area. ● Complications: ○ Some destinations are more popular than others. ○ Multi-delivery route with several stops 15 https://www.mdpi.com/1999-4893/12/2/45/htm
- 16. © 2020 TigerGraph. All Rights Reserved Centrality for Airline Hubs 16
- 17. © 2018 TigerGraph. All Rights Reserved Influence as Centrality ● Who are the most influential medical providers, for a given region, for a given specialty? ○ If you change the behavior of this provider, it will have great impact. ○ Influence through referral from one provider to another? ● Which seller in a interrelated market has the most pricing power? ○ Or player in a game → game theory
- 18. © 2020 TigerGraph. All Rights Reserved Some Centrality Measures 18 Degree # of neighbors (in, out, or both) CD (v) = degree(v) Closeness inverse of sum of shortest path distances CC (v) = (n-1) / ∑z d(v,z) Harmonic sum of inverse of shortest path distances CH (v) = 1/(n-1) * ∑z 1/d(v,z) Betweenness On the most shortest paths CB (v) = ∑A ≠ B {v on path(A,B)} Eigenvector A*c = ƛ* c, A = Adjacency matrix PageRank CP (v) = (1-d)/N + d∑(x,v) CP (x)/deg(x) Percolation https://en.wikipedia.org/wiki/Centrality#Percolation _centrality
- 19. © 2020 TigerGraph. All Rights Reserved Closeness Centrality Compute average distance from a vertex to every other vertex. Closeness = inverse of distance. 19 A B C D E F H G 1 2 1 1 22 2 ● Weighted paths: need to run SSSP, e.g. Dijkstra's ● Directed: What if there no path between 2 vertices? ○ distance is infinite, so closeness = 0? ● Unweighted paths: count hops ○ For F, avg distance = (2+2+1+2+1+2+1)/7 = 11/7 ■ Closeness = inverse(11/7) = 0.636 ○ For A, avg distance = (1+1+1+2+2+3+3)/7 = 13/7 ■ Closeness = inverse(13/7) = 0.538
- 20. © 2020 TigerGraph. All Rights Reserved Betweenness Centrality Count how often a vertex is on a shortest path, for APSP (All Pairs Shortest Path) ● n(n-1)/2 ~ n2 /2 pairs, if undirected ● n(n-1) ~ n2 pairs, if directed ○ But some pairs might not have a directed path ● Even for this small graph, it's too hard to compute all the paths by inspection. ● Betweenness is harder (slower) to compute than Closeness. 20 A B C D E F H G ?
- 21. © 2020 TigerGraph. All Rights Reserved PageRank Centrality Original purpose: find the most "authoritative" page in the Web. Search engine Ranking problem: Engine finds many (millions) of pages which match your search terms. Too many! Which pages to list at the top, in what order? 21
- 22. © 2020 TigerGraph. All Rights Reserved PageRank's Principles A page's authority increases if more pages point to it. A page is more authoritative if the pages that point to it are more authoritative. (Recursive!) A B Rank(B) > Rank(A) C D C1 C2 D1 D2 If Rank(D1),Rank(D2) > Rank(C1),Rank(C2), then Rank(D) > Rank(C) 22
- 23. © 2020 TigerGraph. All Rights Reserved Formulating PageRank PageRank ○ "A node is authoritative if several authoritative nodes point to it." ○ Authority by Referral: ■ PRV = Authority of V = sum(Referrals). ■ Referral by X = (Authority of X)/outdegree(X) ○ Random network surfer: Start anywhere. Pick a random out-edge to go to a neighboring node. Repeat "forever." ■ PRV = Fraction of time that the random surfer spends on node V. Does it fit your need? ○ For directed graphs with one type of node (e.g., social network) ○ # Computational steps ~ (# connections)*(#iterations) 23
- 24. © 2020 TigerGraph. All Rights Reserved PageRank Computation by Iteration Initialization: At time t0, set Rank(V,t0) = 1, for every node V. V0 V1 V5 V3 V2 V4 ? Rank(V0, t0)/3 Rank(V0,t0) Rank(V0, t0)/3 Rank(V0, t0)/3 Iteration - 1. Consider your paths. At time t, Surfer at V0 "gives" to out-neighbor V1 Rank(V0,t)/out-degree(V0) 24
- 25. © 2020 TigerGraph. All Rights Reserved PageRank Computation by Iteration Iteration - 2. Arrive at a neighbor: Rank at time t+1 = sum of all the "gifts" from in-neighbors: Rank(V,t+1) = Rank(V0,t)/out-degree(V0) + Rank(V1,t)/out-degree(V1) + … + Rank(Vn,t)/out-degree(Vn) Repeat the 2-phase iterations until Rank scores converge to stable values. V0 V1 V5 V3 V2 V4 ? Rank(V0, t0)/3 Rank(V0,t0) Rank(V0, t0)/3 Rank(V0, t0)/3 Rank(V4, t0)/2 Rank(V5, t0)/1 25
- 26. © 2020 TigerGraph. All Rights Reserved Small Example Time V0 V1 V2 0 1 1 1 1 0.333 1.333 1.333 2? V0 V1 V2 0 1 0 0 0 1 0.33 0.33 0.33 Transition Matrix 26 0.443 0.778 1.778 3 0.593 1.036 1.371
- 27. © 2020 TigerGraph. All Rights Reserved Same Example, Different Initial Condition Time V0 V1 V2 0 2 1 0 1 0 2 1 2 V0 V1 V2 0 1 0 0 0 1 0.33 0.33 0.33 Transition Matrix 27 0.333 0.333 2.333 3 0.778 1.111 1.111 4 0.370 1.148 1.481
- 28. © 2020 TigerGraph. All Rights Reserved Teleportation - Solves 2 Problems Add a new way to travel: Teleport to ANY node in the graph. 15%: pick a destination at random. 85%: follow the edges 0.85 = damping factor Solves 2 problems: Math: Nodes with no in-edges or no out-edges. Real-world: Surfers don't always follow referrals. Without Teleportation, PageRank = Eigenvector Centrality V0 V1 V5 V3 V2 V4 ~15% Teleport! 85% - Traverse the graph as usual 28
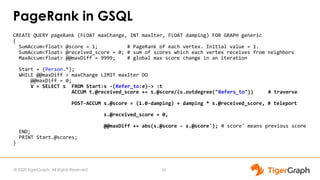
- 29. © 2020 TigerGraph. All Rights Reserved PageRank in GSQL CREATE QUERY pageRank (FLOAT maxChange, INT maxIter, FLOAT damping) FOR GRAPH generic { SumAccum<float> @score = 1; # PageRank of each vertex. Initial value = 1. SumAccum<float> @received_score = 0; # sum of scores which each vertex receives from neighbors MaxAccum<float> @@maxDiff = 9999; # global max score change in an iteration Start = {Person.*}; WHILE @@maxDiff > maxChange LIMIT maxIter DO @@maxDiff = 0; V = SELECT s FROM Start:s -(Refer_to:e)-> :t ACCUM t.@received_score += s.@score/(s.outdegree("Refers_to")) # traverse POST-ACCUM s.@score = (1.0-damping) + damping * s.@received_score, # teleport s.@received_score = 0, @@maxDiff += abs(s.@score - s.@score'); # score' means previous score END; PRINT Start.@scores; } 29
- 30. © 2020 TigerGraph. All Rights Reserved Personalized PageRank ● A.k.a. Random Walk with Restart ● Make the following changes to PageRank: ○ Select one or more vertices as the Home vertices ○ Initial scores: 1 if a Home vertex. 0 otherwise ○ Teleportation: Teleport only to Home vertices ● Random Walk interpretation: It's rare to wander far from home, so scores tend to be higher closer to Home. 30
- 31. DEMO GSQL Graph Algorithms in TigerGraph Cloud 31
- 32. © 2020 TigerGraph. All Rights Reserved Real-World Example: Airline Routes ● Global commercial airline routes from www.openflights.org ○ 7,698 airports ○ 67,664 direct flight routes ● Closeness Centrality ○ Unweighted edges: Which airport on average requires the fewest connections to get to ANY other airport? ○ Weighted edges: Which airport on average requires the fewest miles traveled to get to ANY other airport? ○ Note: We can limit the search to only one region, e.g. USA ○ We can also limit the maximum number of connections 32
- 33. © 2020 TigerGraph. All Rights Reserved Real-World Example: Airline Routes ● Betweenness Centrality ○ Unweighted edges: When travelling from ANY city to ANY other city, which airport is most often/likely to be a connection city? ● PageRank ○ Random flyer model: If you are equally likely to fly ANY route from a given airport, which airport will be your destination most often? ● How does real-world air travel differ from these calculations? 33
- 34. © 2020 TigerGraph. All Rights Reserved Edits made to Library Algorithms ● closeness_cent ○ Split into main (closeness_cent) and subquery (cc_subquery) ○ Change graph name to MyGraph ○ Change vertex type to Airport ○ Change edge type to flight_to ○ Change maxHops to be a parameter ○ Add country name filter to Start set ○ Add Airport name to output tuples for readability ● betweenness_cent ○ Split into main (betweenness_cent) and subquery (bc_subquery) ○ Change graph name, vertex type and edge type ○ Add country name filter to Start set ○ Put results in local accum so we can ORDER BY and LIMIT results 34
- 35. © 2020 TigerGraph. All Rights Reserved Summary 35 1 4 3 Centrality Algorithms - abstract concepts of location and travel Customizing GSQL Library algorithms is easy and familiar, like procedural SQL PageRank - uses directed referral edges to find the most influential nodes. Personalized PageRank is localized. 2 Closeness and Betweenness use shortest paths. Betweenness is more complex.
- 36. Q&A Please submit your questions via the Q&A tab in Zoom 36
- 37. © 2020 TigerGraph. All Rights Reserved More Questions? Join our Developer Forum https://groups.google.com/a/opengsql.org/forum/#!forum/gsql-users Sign up for our Developer Office Hours (every Thursday at 11 AM PST) https://info.tigergraph.com/officehours 37
- 38. © 2020 TigerGraph. All Rights Reserved Additional Resources Start Free at TigerGraph Cloud Today! https://www.tigergraph.com/cloud/ Test Drive Online Demo https://www.tigergraph.com/demo Download the Developer Edition https://www.tigergraph.com/download/ Guru Scripts https://github.com/tigergraph/ecosys/tree/master/guru_scripts 38
- 39. © 2020 TigerGraph. All Rights Reserved Upcoming Graph Guru Events 39 Coming to Seattle, San Francisco, Atlanta, and London! More are in the works. View all events and request your own here: https://www.tigergraph.com/graphguruscomestoyou/ Graph Gurus 28: An In-Database Machine Learning Solution For Real-Time Recommendations https://info.tigergraph.com/graph-gurus-28
- 40. Thank You 40