Visibility-from web application interface to the database
Download as PPTX, PDF1 like205 views

Learn how to identify transactions that are slowing down your applications and how analyzing error traces can help you eliminate performance barriers.


Ad
More Related Content
What's hot (20)
Similar to Visibility-from web application interface to the database (20)


![Server and application monitoring webinars [Applications Manager]: Part 1](https://cdn.slidesharecdn.com/ss_thumbnails/serverandapplicationmonitoringwebinars-part1-applicationsmanager-180607140028-thumbnail.jpg?width=560&fit=bounds)


![Server and application monitoring webinars [Applications Manager] - Part 2](https://cdn.slidesharecdn.com/ss_thumbnails/serverandapplicationmonitoringwebinars-part1-applicationsmanager-180614115127-thumbnail.jpg?width=560&fit=bounds)

Ad
More from ManageEngine, Zoho Corporation (20)


Ad
Recently uploaded (20)


Visibility-from web application interface to the database
- 1. Applications Manager An all round on-premise application performance monitoring solution for IT Ops and DevOps
- 2. Visibility: From web application interface to the database
- 3. Week Module Date Schedule Status 1. Visibility: From web application interface to the database Aug 21 6:00 AM GMT 11:00 AM EDT Completed In progress 2. Big Data and the Non Relational database Aug 28 6:00 AM GMT 11:00 AM EDT Upcoming Upcoming 3. Implementing the right website monitoring strategy Sept 4 6:00 AM GMT 11:00 AM EDT Upcoming Upcoming 4 Monitoring Cloud applications and Containers Sept 11 6:00 AM GMT 11:00 AM EDT Upcoming Upcoming
- 4. Agenda Application response times and user satisfaction Identifying transactions that are slowing down your app Slow database calls preventing ideal performance Analysing error traces to eliminate all performance barriers
- 5. • End users typically expect a quick response time (<3 secs) while using any web application. • The web server, application server, load balancer and database are among the critical components that require detailed visibility. • The response time depends on several components working together, all of which have to perform efficiently to deliver the right user experience. Application Model Overview
- 6. • Request overload • Slice of death in Database • Buggy application code • Improper memory management • Thread configuration Reasons your application might be slow
- 7. Apdex score Response time Application Performance Monitoring: Key performance indicators Error traces Transactio n traces Slow SQL statements
- 8. APM Insight for end to end visibility of your web applications Coming soon: Support for PHP and Node.js applications.
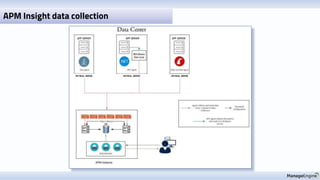
- 9. APM Insight data collection
- 10. 1. Application response times and user satisfaction
- 12. • Global open standard to measure end user satisfaction • Scale of 0 to 1 • Helps identify satisfied, tolerated and frustrated users Apdex score
- 13. • Response time and response time by tiers • Throughput • Slowest transactions by response time Response time and throughput
- 14. 2. Identifying transactions that are slowing down your app
- 15. • Response time • Slow business transactions • Error traces Transaction elements for performance issues
- 16. Transaction component split up
- 17. • Individual business transaction apdex score • Transaction response time broken by components like web request, handle request, mvc, servlet, aspx • Transaction response time and throughput status Transaction element wise response times
- 18. 3. Slow database calls preventing ideal performance
- 19. • Identify slow database calls • Find the most hit database tables, and determine if specific tables can be indexed well • Start tuning your database performance and diagnose slow queries. Queries delaying response time
- 20. Overall performance of the database
- 21. • Find the most executed database operations and its response time • Database operation by caller • Find the busiest table and the most performed SQL operation on the table. Individual database calls
- 22. Common database problems and how to tackle them I. Database response is slow towards requests II. Not able to retrieve data when accessing a particular record in a web application
- 23. Discovery & mapping Possible reasons: • Not enough resources • Queries taking more time to execute I. Database response is slow towards requests
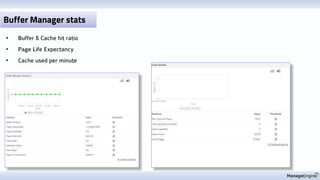
- 24. Buffer Manager stats • Buffer & Cache hit ratio • Page Life Expectancy • Cache used per minute
- 25. • See log file and data file details for individual SQL DBs • Generate reports for log and data files MS SQL log file & data files
- 26. Oracle tablespace stats • Identify used & free bytes of individual table space. • Monitor Reads and Writes per min • Track data files & monitor datafile auto extend
- 27. MS SQL top queries by CPU
- 28. MS SQL Top queries by CPU
- 29. MS SQL Slow running queries
- 30. Oracle buffer gets - Top 10 queries • Buffer Gets • Execution • Buffer Gets per Execution
- 31. Oracle disk reads - Top 10 queries
- 32. Details to analyze: • Sessions • Waits • Locks • Blocked queries II. Unable to retrieve data while accessing a record in a web application
- 33. MS SQL - Session details • Displays the SQL server session ID running in SQL server along with its status. • Shows information on blocked request and allows user to kill user session.
- 34. Oracle - Session details • Identify ONLINE, OFFLINE, or INVALID sessions as well as sessions initiated by specific users. • Monitor number of memory sorts, table scans performed. • Track physical & logical reads of the session as well as buffer cache hit ratio
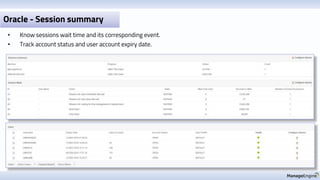
- 35. Oracle - Session summary • Know sessions wait time and its corresponding event. • Track account status and user account expiry date.
- 36. MS SQL - Top waits by waiting tasks
- 37. MS SQL - Most blocked queries
- 38. Oracle - Lock • Know which type of session lock type is being used. • Track blocked session time.
- 39. 4. Analysing error traces to eliminate all performance barriers
- 40. • Identify slow internal invocations (methods) in the code and trace the execution details for URLs Pinpoint
- 41. Traces to investigate time consuming transactions
- 43. Drill down to SQL statements
- 44. Details of background transactions
- 46. Stack trace of erroneous transactions
- 47. • Custom instrumentation allows you to monitor specific blocks of your application code. • It allows you to track your own application methods captured and displayed in the transaction traces. • The instrumented methods will be displayed with execution time under the trace details tab APM Insight custom instrumentation
- 48. Additional insights for Java web applications
- 49. • JVM Cpu usage • Heap & Non heap memory • Just in time compiler • JVM Classes count • Garbage collection details • Thread details • Configuration details JVM performance insights
- 51. JVM: threads
- 52. Contact : [email protected] Online Demo : demo.appmanager.com 1. Application response times and user satisfaction 2. Identifying transactions that are slowing down your app 3. Slow database calls preventing ideal performance 4. Analysing error traces to eliminate all performance barriers Quick Recap:
- 53. Contact : [email protected] Online Demo : demo.appmanager.com