SlideShare a Scribd company logo
Visualizing Networks
      Beyond the “Hairball”

           Lynn Cherny
             @arnicas

     O’Reilly Strata NYC 2012
Visualizing Networks
      Beyond the “Hairball”

           Lynn Cherny
             @arnicas

     O’Reilly Strata NYC 2012
PS(A): I AM NOT JASON
SUNDRAM
He could not make it, and asked me to take over.


                                                   2
The Hairball: A Metaphor for
                      Complexity


http://www.nd.edu/~networks/Publication%20Categories/01%20Review%20Articles/ScaleFree_Scientific%20Ameri
%20288,%2060-69%20(2003).pdf
http://www.nd.edu/~networks/Publication%20Categories/01%20Review%20Articles/ScaleFree_Scientific%20Ameri
%20288,%2060-69%20(2003).pdf
http://www.linkedin.com/today/post/article/20121016185655-10842349-the-hidden-power-
WHAT IS A NETWORK?

It’s not a visualization. Think of it as a data structure.
Data relationship: entities + relationships
to other objects (node/edge, vertex/link)


Nodes and Edges may have attributes, eg.
  gender, age, weight, tv prefs
  connection date, frequency of contact, type of
  exchange, directionality of relationship
  attributes may be calculated from network itself
Lane Harrison: http://blog.visual.ly/network-visualizations/
Best!


                                                A User Study on Visualizing Directed Edges in Graphs”
                                                Danny Holten and Jarke J. van Wijk, 27th SIGCHI Conference on Human Factors in
                                                Computing Systems (Proceedings of CHI 2009),

http://blog.visual.ly/network-visualizations/                                                                            9
10
10
10
It’s a natural human trait to see visual similarity and proximity as
meaningful.

Be very careful about your display choices and layout methods!


                                                                       10
Reading a network visualization


                     There’s obviously
                     something important
                     going on here,
                     structurally....
Reading a network visualization
                 Lo o
                     k a
                        t th
                             is o
                                  utl
                                      ier
                                          cas
                                              e!


                            There’s obviously
                            something important
                            going on here,
                            structurally....
Reading a network visualization
                   à       Lo o
              age              k a
        mé
             n       ere          t th
     A          ver h                  is o
          i s o                             utl
      tro                                       ier
                                                    cas
                                                        e!


                                      There’s obviously
                                      something important
                                      going on here,
                                      structurally....
S?
 MIReading                            a network visualization
                                         à       Lo o
                                    age              k a
                              mé
                                   n       ere          t th
                           A          ver h                  is o
                                i s o                             utl
                            tro                                       ier
                                                                          cas
                                                                              e!


                                                            There’s obviously
                                                            something important
                                                            going on here,
                                                            structurally....


Using a “random” Gephi layout on the dolphins
S?
 MIReading                            a network visualization
                                         à            Lo o
                                    age                   k a
                              mé
                                   n       ere               t th
                           A          ver h                       is o
                                i s o                                  utl
                            tro                                            ier
                                                                               cas
                                                                                   e!


                                                Rando m!


                                                                 There’s obviously
                                                                 something important
                                                                 going on here,
                                                                 structurally....


Using a “random” Gephi layout on the dolphins
Design Examples                    s!
                          lp   h in
                        o
               it h D
           w
The Dolphins of Doubtful Sound


http://www.doc.govt.nz/documents/conservation/native-animals/marine-mammals/abundance-population-
structure-bottlenose-dolphins-doubtful-dusky-sounds.pdf
“The bottlenose dolphin community of Doubtful
Sound features a large proportion of long-lasting
associations. Can geographic isolation explain this
unique trait?”


David Lusseau et al. BEHAVIORAL ECOLOGY AND
SOCIOBIOLOGY Volume 54, Number 4 (2003)
http://www.springerlink.com/content/pepxvj4lu42ur2gw/
“The bottlenose dolphin community of Doubtful
Sound features a large proportion of long-lasting
associations. Can geographic isolation explain this
unique trait?”


                                !
                          ti tle
                 p   er
            l pa
         tua
       ac
   e
 Th


David Lusseau et al. BEHAVIORAL ECOLOGY AND
SOCIOBIOLOGY Volume 54, Number 4 (2003)
http://www.springerlink.com/content/pepxvj4lu42ur2gw/
“SF”


                                                                    “ULT”


                                                                    2 hung
                                                                      out


D. Lusseau, Evidence for Social Role in a Dolphin Social Network.
Evol Ecol (2007) 21:357–366
Citation: Lusseau D (2007) Why Are Male Social Relationships Complex in the Doubtful Sound Bottlenose Dolphin Population?. PLoS ONE 2(4):
e348. doi:10.1371/journal.pone.0000348
Citation: Lusseau D (2007) Why Are Male Social Relationships Complex in the Doubtful Sound Bottlenose Dolphin Population?. PLoS ONE 2(4):
e348. doi:10.1371/journal.pone.0000348


                                         define relationship
                                         Using “mirroring” to
Citation: Lusseau D (2007) Why Are Male Social Relationships Complex in the Doubtful Sound Bottlenose Dolphin Population?. PLoS ONE 2(4):
e348. doi:10.1371/journal.pone.0000348


                                         define edges
                                               “headbutting” to
                                              define relationship
                                         UsingUsing “mirroring” to
TOOLS FOR TODAY

Creating network layouts...

                              17
Gephi


        18
Or “D3” (d3js.org)


• A “build it yourself” svg-based visualization
  library
• Import graphs as (or parse to create) a json
  node-link structure
Making a Network
Who is your audience? What’s the goal?
 Exploration / Iterative visualization during data analysis?
 End-user communication?
Making a Network
Who is your audience? What’s the goal?
 Exploration / Iterative visualization during data analysis?
 End-user communication?


  Layout choices: by hand, algorithmic, style...
  Understand the global and local context with some stats about
  actors and roles in the network
  Improve your layout with stats / attributes - inherent (such as
  gender) or calculated (e.g., degree)
  Add interactivity for end users if appropriate
J Bertin: Semiology
of Graphics
                                                     Linear


                                                    Circular


                                                   Irregular


                                              Regular (Tree)


                                                         3D


                                                    Matrix /
                                                   Bipartite


Bertin, J. Semiology of Graphics: Diagrams,
Networks, Maps (1967)
Algorithmic Approaches


Frank van Ham talk slides: http://bit.ly/s6udpy
(Trees are a whole other subject)


Treevis.net: http://www.informatik.uni-rostock.de/~hs162/treeposter/poster.html
MATRIX LAYOUTS /
REPRESENTATIONS
http://barabasilab.neu.edu/networksciencebook/download/network_science_October_2012.pdf
Real social networks are
           generally quite sparse.


http://www.cise.ufl.edu/research/sparse/matrices/Newman/
dolphins.html
D3 demo by me http://www.ghostweather.com/essays/talks/networkx/adjacency.html
NodeTrix: A Hybrid Visualization of Social Networks. Nathalie Henry, Jean-Daniel Fekete, and
Michael J. McGuffin. (2007) http://arxiv.org/abs/0705.0599
http://semilattice.net/eyeodiff/
ARC / LINEAR LAYOUTS
Philipp Steinweber and Andreas Koller
                                       Similar Diversity, 2007


For a D3 example in another domain: http://tradearc.laserdeathstehr.com/
http://www.openbible.info/blog/2010/04/bible-cross-references-visualization/
Hive Plots


D3: http://bost.ocks.org/mike/hive/
http://mariandoerk.de/pivotpaths/
Design Interlude
Bertin’s Thought Process


Bertin, J. Semiology of Graphics: Diagrams, Networks, Maps (1967)
Visualizing Networks: Beyond the Hairball
(P) Paris


(Z) Paris Suburbs


(+50) Communes of >50K


(+10) Communes of >10K


(-10) Communes of <10K


(R) Rural
CIRCULAR / CHORD LAYOUTS
“If
                                         it's
                           Circos   pro
                                        bab
                                              rou
                                            ly d
                                                  nd,
                                                 o it
                                                        Circ
                                                            os
                                                      ”        can


http://circos.ca/images/
Simple Orderings of Nodes


      Circular Layout                        “Dual Circle” layout with        Sorted by
      ordered by Degree                      most popular dolphin in center   Modularity


                                                                                           41
Dolphins colored by modularity class (community) in Gephi
http://www.ghostweather.com/essays/talks/networkx/chord.html
Hierarchical Edge Bundling


"Hierarchical Edge Bundles: Visualization of Adjacency Relations in Hierarchical Data”, Danny Holten, IEEE
Transactions on Visualization and Computer Graphics (TVCG; Proceedings of Vis/InfoVis 2006), Vol. 12, No. 5,
A D3 Example by M. Bostock


D3: http://bl.ocks.org/1044242
A very short detour into
         maps...
46
Flow Map Layout, Phan et al (2005) http://graphics.stanford.edu/papers/flow_map_layout/
46
Flow Map Layout, Phan et al (2005) http://graphics.stanford.edu/papers/flow_map_layout/
"Force-Directed Edge Bundling for Graph Visualization”,
Danny Holten and Jarke J. van Wijk, 11th Eurographics/IEEE-VGTC Symposium on Visualization (Computer
Graphics Forum; Proceedings of EuroVis 2009), Pages 983 - 990, 2009.
Divided Edge Bundling for Directional Network Data
David Selassie, Brandon Heller, Jeffrey Heer
IEEE Trans. Visualization & Comp. Graphics (Proc. InfoVis), 2011   48
Design Example
50
http://jeromecukier.net/projects/agot/places.html
50
http://jeromecukier.net/projects/agot/places.html
51
Jerome’s version with the map is not available online, sorry.
Yet Another Design
     Example
Moritz Stefaner’s Muesli Problem


https://speakerdeck.com/u/moritzstefaner/p/omg-its-all-connected
s
                                                     li ke iou
                                                 ch       lic
                                               u
                                             m ot      de
                                           o
                                      “ To    s, n h!”        el
                                                                f
                                         o om oug ims
                                       hr     en to h
                                    us
                                  m             i tz
                                             or
                                          -M


https://speakerdeck.com/u/moritzstefaner/p/omg-its-all-connected
Final


https://speakerdeck.com/u/moritzstefaner/p/omg-its-all-connected
ALGORITHMIC LAYOUTS
Gephi / D3.js / Other tools
Gephi  Sigma.js
Gephi.org: Open source, runs on Mac, Linux, PC
  Can be run from a python-esque console plugin or UI
  Can be run “headless” for layouts (Jason Sundram)
     https://github.com/jsundram/pygephi
  Plugins include a Neo4j graph db access, and streaming
  support
Sigma.js :
  Will display a gexf gephi layout file with minimal work, using
  a plugin interpreter for sigma
  Also offers a force-directed layout plugin for graphs without
  x&y coords
  Does CANVAS drawing, not SVG
http://www.barabasilab.com/pubs/CCNR-ALB_Publications/200705-14_PNAS-HumanDisease/Suppl/
Movie:


Sigma.js version of the Gephi export http://exploringdata.github.com/vis/human-disease-
Using Sigma.js
                                                     basic_sigma.js

<div class="sigma-expand“                            function init() {
                                                       // Instanciate sigma.js and customize rendering :

         id="sigma-example"></div>                    var sigInst = sigma.init(document.getElementById('sigma-example'))
                                                     
                 .drawingProperties({
                                                                           defaultLabelColor: '#fff',
                                                                           defaultLabelSize: 14,
                                                                           defaultLabelBGColor: '#fff',
                                                                           defaultLabelHoverColor: '#000',
                                                                           labelThreshold: 6,
                                                                           defaultEdgeType: 'curve'
                                                                         }).graphProperties({
                                                                           minNodeSize: 0.5,
                                                                           maxNodeSize: 5,
                                                                           minEdgeSize: 1,
                                                                           maxEdgeSize: 1
                                                                         }).mouseProperties({                Where
                                                                           maxRatio: 32
                                                     
                   });                                 to put
                                                         // Parse a GEXF encoded file to fill the graph        the
<script src="../js/sigma.min.js"></script>               // (requires "sigma.parseGexf.js" to be included)
<script src="../js/sigma.parseGexf.js"></script>         sigInst.parseGexf('color_by_mod.gexf');             graph
<script src="basic_sigma.js"></script>                   // Draw the graph :
                                                         sigInst.draw();
                                                     }
                                                                                                      Your graph
                                                     if (document.addEventListener) {
                                                       document.addEventListener("DOMContentLoaded", init, false);
                                                     } else {
                                                       window.onload = init;
                                                     }


             In sigma.js’s github (under plugins!)
Sample Layout Plugins in Gephi


https://gephi.org/tutorials/gephi-tutorial-layouts.pdf
Gephi Plugin Layout Details
  Layout                   Complexity              Graph Size          Author               Comment

  Circular                 O(N)                    1 to 1M nodes       Matt Groeninger      Used to show
                                                                                            distribution, ordered
                                                                                            layout


  Radial Axis              O(N)                    1 to 1M nodes       Matt Groeninger      Show ordered groups
                                                                                            (homophily)


  Force Atlas              O(N²)                   1 to 10K nodes      Mathieu Jacomy       Slow, but uses edge
                                                                                            weight and few
                                                                                            biases
  Force Atlas 2            O(N*log(N))             1 to 1M nodes       Mathieu              (does not use
                                                                       Jacomy               weight)

  OpenOrd                  O(N*log(N))             100 to 1M nodes     S. Martin, W. M.     Focus on clustering
                                                                       Brown, R. Klavans,   (uses edge weight)
  Yifan Hu                 O(N*log(N))             100 to 100K nodes   and K. Boyack
                                                                       Yifan Hu             (no edge weight)

  Fruchterman-             O(N²)                   1 to 1K nodes       Fruchterman &        Particle system, slow
  Rheingold                                                            Rheingold!           (no edge weight)
  GeoLayout                O(N)                    1 to 1M nodes       Alexis Jacomy        Uses Lat/Long for
                                                                                            layout


https://gephi.org/2011/new-tutorial-layouts-in-gephi/
Dolphins Again


OpenOrd + “No Overlap”              ForceAtlas2


                                                  63
Dolphins Again


OpenOrd + “No Overlap”              ForceAtlas2


                                                  63
Dolphins Again


OpenOrd + “No Overlap”              ForceAtlas2


                                                  63
Unweighted
             dolphins,
             Force Atlas


Weight 2: Force Atlas      Weight 4: Force Atlas
                                                   64
Unweighted
             dolphins,
             Force Atlas


Weight 2: Force Atlas      Weight 4: Force Atlas   Weight 4: Yifan Hu
                                                                        64
Canvas/SVG benchmarks from the
                                                                                       d3.js group:

                                                                  https://docs.google.com/spreadsheet/
                                                                                                  ccc?
Nick Diakapolous: http://nad.webfactional.com/ntap/graphscale/   key=0AtvlFoSBUC5kdEZJNVFySG9wSHZk
SIMPLE CALCULATIONS ON
NETWORKS CAN TELL YOU
Often you need to visualize the structure/role of the graph
elements as part of the visualization: So, do some simple
math.
Degree (In, Out)
        “Degree” is a measure of the
        edges in (directed), out
        (directed), or total (in
        directed or undirected
        graphs) to a node
        “Hub” nodes have high in-
        degree. In scale-free
        networks, we see preferential
        attachment to the popular
        kids.


http://mlg.ucd.ie/files/summer/tutorial.pdf
Scale-free Networks


Image from Lada Adamic’s SNA Course on Coursera pdf 3D
The Threat of Hub-Loss


Albert-László Barabási and Eric Bonabeau, Scale-Free Networks, 2003.http://www.scientificamerican.com/
article.cfm?id=scale-free-networks
Visualization Aside: If Some Names are
            Huge, the Others are Invisible-?


                                                   70
Correcting for text size by degree display issue
Visualization Aside: If Some Names are
            Huge, the Others are Invisible-?


                                                   Gephi Panel


                                                                 70
Correcting for text size by degree display issue
Visualization Aside: If Some Names are
            Huge, the Others are Invisible-?


                                                   Gephi Panel


                                                                 70
Correcting for text size by degree display issue
Visualization Aside: If Some Names are
            Huge, the Others are Invisible-?


                                                   Gephi Panel


                                                                 70
Correcting for text size by degree display issue
Betweenness
  A measure of connectedness
    between (sub)components of
    the graph

      “Betweenness centrality thus
      tends to pick out boundary
      individuals who play the role of
      brokers between communities.”


Lusseau and Newman. http://www.ncbi.nlm.nih.gov/pmc/
articles/PMC1810112/pdf/15801609.pdf                   http://en.wikipedia.org/wiki/Centrality#Betweenness_centrality
Judging By Eye Will Probably Be
Wrong...


                                  72
Judging By Eye Will Probably Be
Wrong...


               ? This one?


                                  72
Judging By Eye Will Probably Be
Wrong...


               ? This one?


                             Sized by Betweenness


                                                    72
Eigenvector Centrality
          Intuition: A node is important if it is
          connected to other important nodes
          A node with a small number of influential
          contacts may outrank one with a larger
          number of mediocre contacts


http://mlg.ucd.ie/files/summer/tutorial.pdf   http://demonstrations.wolfram.com/
Pagerank


Wikipedia image
Community Detection
  E.g., the Louvain method, in Gephi as
    “Modularity.” Many layout algorithms help
    you intuit these structures, but don’t rely
    on perception of layout!


http://en.wikipedia.org/wiki/File:Network_Community_Structure.png
Citation: Lusseau D (2007) Why Are Male Social Relationships Complex in the Doubtful Sound
Bottlenose Dolphin Population?. PLoS ONE 2(4): e348. doi:10.1371/journal.pone.0000348
Citation: Lusseau D (2007) Why Are Male Social Relationships Complex in the Doubtful Sound
Bottlenose Dolphin Population?. PLoS ONE 2(4): e348. doi:10.1371/journal.pone.0000348        77
Identifying the role that animals play in their social networks (2004)
D Lusseau, MEJ Newman
Proceedings of the Royal Society of London. Series B: Biological Sciences
Identifying the role that animals play in their social networks (2004)
D Lusseau, MEJ Newman
Proceedings of the Royal Society of London. Series B: Biological Sciences
Identifying the role that animals play in their social networks (2004)
D Lusseau, MEJ Newman
Proceedings of the Royal Society of London. Series B: Biological Sciences
Identifying the role that animals play in their social networks (2004)
D Lusseau, MEJ Newman
Proceedings of the Royal Society of London. Series B: Biological Sciences
Identifying the role that animals play in their social networks (2004)
D Lusseau, MEJ Newman
Proceedings of the Royal Society of London. Series B: Biological Sciences
Identifying the role that animals play in their social networks (2004)
D Lusseau, MEJ Newman
Proceedings of the Royal Society of London. Series B: Biological Sciences
Eduarda Mendes Rodrigues, Natasa Milic-Frayling, Marc Smith, Ben Shneiderman, Derek Hansen, Group-in-a-
box Layout for Multi-faceted Analysis of Communities. IEEE Third International Conference on Social
http://mbostock.github.com/d3/talk/20111116/force-collapsible.html
Movie:


Ger Hobbelt D3: http://bl.ocks.org/3616279
Movie:


Ger Hobbelt D3: http://bl.ocks.org/3616279
Design Example
100 nodes, size by degree,                    Clustered by partition, no edges
       shaded by Betweenness, in                     until you click on one, node size is a
       d3.js force directed layout.                  choice of attributes, nodes
                                                     represented by labels/colors….


http://www.ghostweather.com/essays/talks/networkx/    http://www.ghostweather.com/essays/talks/networkx/
Movie:


                                                                     84
http://www.ghostweather.com/essays/talks/networkx/force_fonts.html
Movie:


                                          by @moebio
                                                       85
http://intuitionanalytics.com/pleiades/
!
                                                LOL


SO YOU WANT TO LAY IT OUT
YOURSELF...
Perfectionist? Artist? Don’t like algorithms?

                                                       86
Jeff Heer: http://hci.stanford.edu/courses/cs448b/f11/lectures/CS448B-20111110-
Design Examples
Conspiracy Theorist Mark


                 Learning from Lombardi:
                 http://benfry.com/exd09/
Conspiracy Theorist Mark


                 Learning from Lombardi:
                 http://benfry.com/exd09/
Stefanie Posavec


http://www.itsbeenreal.co.uk/index.php?/wwwords/literary-
Roche Applied Science Biochemical Pathways Map: http://web.expasy.org/cgi-bin/pathways/
Hybrid Method: Use algorithmic
            layout, and then adjust nodes by


Ger Hobbelt in D3: http://bl.ocks.org/3637711
Tweaking your layout is
                           addictive!


                                                      Yo ned
                                                       wa

                                                        u
                                                          r
                                                           ha !
                                                             ve
                                                               !

                                                                 be
                                                                en
Jason Davies: http://www.jasondavies.com/planarity/
STEP BACK, SCALE UP...


                         94
C.Dunne & B.Shneiderman. Network Motif Simplification. http://hcil2.cs.umd.edu/trs/
GraphPrism: Compact Visualization of Network Structure
Sanjay Kairam, Diana MacLean, Manolis Savva, Jeffrey Heer
Advanced Visual Interfaces, 2012
97
http://openaccess.city.ac.uk/1324/
Video:


                                               98
http://graphics.wsj.com/political-moneyball/
Wrap it up on design...
Reminders
Choose your visual encodings, layout,
interaction to make it a visualization,
rather than raw data vomit.
  Take care: people will infer things from
  proximity/similarity even if it was not
  intended!
Do data analysis / reduction - why
would you want to show 1T of network
data?
Allow interactivity if needed for end
users.
  Help people find things in your network!
Reminders
Choose your visual encodings, layout,
interaction to make it a visualization,
rather than raw data vomit.
  Take care: people will infer things from


                                             To ot sci
  proximity/similarity even if it was not


                                              =N

                                               o
                                                 m wa ce
                                             d
  intended!


                                                  at


                                                  uc
                                                    al en
                                                    a


                                                     h
                                                       d go
Do data analysis / reduction - why


                                                        at
                                                        ys !

                                                          a
would you want to show 1T of network


                                                            o
                                                              d
data?
Allow interactivity if needed for end
users.
  Help people find things in your network!
More Reminders!
Different layouts communicate different
things to your viewer - choose wisely
Reducing noise:
 Don’t show edges (perhaps on demand)
 Show details only on demand: zoom in
 Cluster your nodes/edges
 Consider if it has to be a “network” display at all: Is
 it the stats you care about? Or the hairball?


                                                       101
The Map is Not the Territory…


Forest Pitts (thanks to Noah Friedkin) http://www.analytictech.com/networks/pitts.htm
The Map is Not the Territory…


Forest Pitts (thanks to Noah Friedkin) http://www.analytictech.com/networks/pitts.htm
www.Visualcomplexity.com
Thanks!
                               @arnicas
                         lynn@ghostweather.com


And thanks to twitter vis friends for content: @jsundram, @laneharrison, @moritz_stefaner, @jcukier,
@jeff1024, @vlandham, @moebio, @jeffrey_heer, @mbostock, @eagereyes, @jasondavies, @stefpos,
                                   @sarahslo, @ndiakopoulos, @gephi
A Few More References
Jeff Heer class slides: http://         Robert Kosara’s post: http://
hci.stanford.edu/courses/cs448b/        eagereyes.org/techniques/graphs-
w09/lectures/20090204-                  hairball
GraphsAndTrees.pdf
                                        Lane Harrison’s post: http://
A great in-progress book on networks:   blog.visual.ly/network-
http://barabasilab.neu.edu/             visualizations/
networksciencebook/
                                        MS Lima’s book Visual Complexity
Mark Newman’s many papers: http://
                                        Jason Sundram’s tool to drive Gephi
www-personal.umich.edu/~mejn/
                                        layout from command line: https://
Eyeo Festival videos from Moritz        github.com/jsundram/pygephi
Stefaner, Manuel Lima, Stefanie
                                        A couple articles on community
Posavec
                                        structure:
Journal of Graph Algorithms and
                                        Overlapping Community Detection
Applications: http://jgaa.info/
                                           in Networks: State of the Art
home.html
                                           and Comparative Study by Jierui
Jim Vallandingham’s D3 network             Xie, Stephen Kelley, Boleslaw K.
tutorials: http://flowingdata.com/          Szymanski
2012/08/02/how-to-make-an-
                                        Empirical Comparison of
interactive-network-visualization/,       Algorithms for Network

More Related Content

PDF
Web 3.0 - A Detailed Guide
101 Blockchains
 
PPT
data mining
uoitc
 
PDF
Deep Neural Networks for Machine Learning
Justin Beirold
 
PPTX
Data mining concepts and work
Amr Abd El Latief
 
PPTX
Graph Neural Network 1부
seungwoo kim
 
PPT
Pagerank Algorithm Explained
jdhaar
 
PPTX
Entity Relationship Diagram
Rakhi Mukherji
 
PPTX
Data analytics presentation- Management career institute
PoojaPatidar11
 
Web 3.0 - A Detailed Guide
101 Blockchains
 
data mining
uoitc
 
Deep Neural Networks for Machine Learning
Justin Beirold
 
Data mining concepts and work
Amr Abd El Latief
 
Graph Neural Network 1부
seungwoo kim
 
Pagerank Algorithm Explained
jdhaar
 
Entity Relationship Diagram
Rakhi Mukherji
 
Data analytics presentation- Management career institute
PoojaPatidar11
 

What's hot (20)

PPTX
big data Presentation
Mahmoud Farag
 
PPT
Schemaless Databases
Dan Gunter
 
PPTX
Page rank algortihm
Siddharth Kar
 
PDF
Big Data Analytics : A Social Network Approach
Andry Alamsyah
 
PDF
Big Data: Its Characteristics And Architecture Capabilities
Ashraf Uddin
 
PPTX
Ranking algorithms
Ankit Raj
 
DOCX
Hadoop Seminar Report
Atul Kushwaha
 
PPT
Data analytics & its Trends
Dr.K.Sreenivas Rao
 
PPT
3 google hacking
Syahmi Afiq Nizam
 
PPSX
TIBCO Spotfire
Varun Varghese
 
PPT
Introduction To Predictive Analytics Part I
jayroy
 
PPT
Web data mining
Institute of Technology Telkom
 
PDF
CLUSTERING IN DATA MINING.pdf
SowmyaJyothi3
 
PDF
Data visualization introduction
ManokamnaKochar1
 
PDF
Knowledge Graphs as a Pillar to AI
Enterprise Knowledge
 
PPTX
Data cubes
Mohammed
 
PPTX
Information Retrieval-4(inverted index_&amp;_query handling)
Jeet Das
 
PPTX
Graph database
Achintya Kumar
 
PPTX
Web Mining
Ziyad Abid
 
PDF
Data mining in social network
akash_mishra
 
big data Presentation
Mahmoud Farag
 
Schemaless Databases
Dan Gunter
 
Page rank algortihm
Siddharth Kar
 
Big Data Analytics : A Social Network Approach
Andry Alamsyah
 
Big Data: Its Characteristics And Architecture Capabilities
Ashraf Uddin
 
Ranking algorithms
Ankit Raj
 
Hadoop Seminar Report
Atul Kushwaha
 
Data analytics & its Trends
Dr.K.Sreenivas Rao
 
3 google hacking
Syahmi Afiq Nizam
 
TIBCO Spotfire
Varun Varghese
 
Introduction To Predictive Analytics Part I
jayroy
 
CLUSTERING IN DATA MINING.pdf
SowmyaJyothi3
 
Data visualization introduction
ManokamnaKochar1
 
Knowledge Graphs as a Pillar to AI
Enterprise Knowledge
 
Data cubes
Mohammed
 
Information Retrieval-4(inverted index_&amp;_query handling)
Jeet Das
 
Graph database
Achintya Kumar
 
Web Mining
Ziyad Abid
 
Data mining in social network
akash_mishra
 
Ad

Similar to Visualizing Networks: Beyond the Hairball (20)

PDF
Visual Ethnography
Josh
 
PDF
Tips for Effective Presentations
Sumeet Moghe
 
KEY
Link communities reveal multiscale complexity in networks
Yong-Yeol Ahn
 
PPT
Graph Processing Applications @ HUG
Praveen Sripati
 
PDF
MyPortfolio: New features
Kristina D.C. Hoeppner
 
PDF
A Curious Course on Coroutines and Concurrency
Hiroshi Ono
 
PDF
Network literacy-high-res
Carlise Schneider
 
PDF
The Social Journal
Dorothea Salo
 
PDF
Who\'s Reading Your Map? Why knowing your audience is important
cgoranson
 
PDF
A Curious Course on Coroutines and Concurrency
David Beazley (Dabeaz LLC)
 
PDF
Developing a Shared Vision for Academic Technology on Your Campus
Gail Matthews-DeNatale
 
KEY
Pecha Kucha-Instructional Coaching Conference 2009_Keynote Version
Kim Watchorn
 
PDF
Iftf intern presentation
Nicolas Weidinger
 
KEY
6 presentation arcidosso-massaro_guazzini_bagnoli
Ale Cignetti
 
PPTX
Complex Networks
Amir Masoud Abdol
 
PDF
Web And Mobility Trends Oct 2008
Manish Mohan
 
KEY
Demo deck cloud sports
Javier Galdames
 
PPT
Who Wants To Be A Librarian
Business Librarians Association
 
PPT
Relevance of social media in recruitment
Sugandh Kansal
 
PDF
Informed Cities: Live vote results 2
ICLEI Sustainability Management & Urban Governance
 
Visual Ethnography
Josh
 
Tips for Effective Presentations
Sumeet Moghe
 
Link communities reveal multiscale complexity in networks
Yong-Yeol Ahn
 
Graph Processing Applications @ HUG
Praveen Sripati
 
MyPortfolio: New features
Kristina D.C. Hoeppner
 
A Curious Course on Coroutines and Concurrency
Hiroshi Ono
 
Network literacy-high-res
Carlise Schneider
 
The Social Journal
Dorothea Salo
 
Who\'s Reading Your Map? Why knowing your audience is important
cgoranson
 
A Curious Course on Coroutines and Concurrency
David Beazley (Dabeaz LLC)
 
Developing a Shared Vision for Academic Technology on Your Campus
Gail Matthews-DeNatale
 
Pecha Kucha-Instructional Coaching Conference 2009_Keynote Version
Kim Watchorn
 
Iftf intern presentation
Nicolas Weidinger
 
6 presentation arcidosso-massaro_guazzini_bagnoli
Ale Cignetti
 
Complex Networks
Amir Masoud Abdol
 
Web And Mobility Trends Oct 2008
Manish Mohan
 
Demo deck cloud sports
Javier Galdames
 
Who Wants To Be A Librarian
Business Librarians Association
 
Relevance of social media in recruitment
Sugandh Kansal
 
Informed Cities: Live vote results 2
ICLEI Sustainability Management & Urban Governance
 
Ad

More from OReillyStrata (14)

PDF
Dealing with Uncertainty: What the reverend Bayes can teach us.
OReillyStrata
 
PDF
SapientNitro Strata_presentation_upload
OReillyStrata
 
PPT
Digital analytics & privacy: it's not the end of the world
OReillyStrata
 
PDF
Giving Organisations new capabilities to ask the right business questions 1.7
OReillyStrata
 
PPT
Data as an Art Material. Case study: The Open Data Institute
OReillyStrata
 
PDF
Giving Organisations new Capabilities to ask the Right Business Questions
OReillyStrata
 
PPTX
Big Data for Big Power: How smart is the grid if the infrastructure is stupid?
OReillyStrata
 
PDF
The Workflow Abstraction
OReillyStrata
 
PDF
SQL on Hadoop: Defining the New Generation of Analytic SQL Databases
OReillyStrata
 
PDF
The Future of Big Data is Relational (or why you can't escape SQL)
OReillyStrata
 
KEY
Large scale ETL with Hadoop
OReillyStrata
 
PDF
Designing Big Data Interactions: The Language of Discovery
OReillyStrata
 
KEY
Digital Reasoning_Tim Estes_Strata NYC 2012
OReillyStrata
 
PDF
clearScienceStrataRx2012
OReillyStrata
 
Dealing with Uncertainty: What the reverend Bayes can teach us.
OReillyStrata
 
SapientNitro Strata_presentation_upload
OReillyStrata
 
Digital analytics & privacy: it's not the end of the world
OReillyStrata
 
Giving Organisations new capabilities to ask the right business questions 1.7
OReillyStrata
 
Data as an Art Material. Case study: The Open Data Institute
OReillyStrata
 
Giving Organisations new Capabilities to ask the Right Business Questions
OReillyStrata
 
Big Data for Big Power: How smart is the grid if the infrastructure is stupid?
OReillyStrata
 
The Workflow Abstraction
OReillyStrata
 
SQL on Hadoop: Defining the New Generation of Analytic SQL Databases
OReillyStrata
 
The Future of Big Data is Relational (or why you can't escape SQL)
OReillyStrata
 
Large scale ETL with Hadoop
OReillyStrata
 
Designing Big Data Interactions: The Language of Discovery
OReillyStrata
 
Digital Reasoning_Tim Estes_Strata NYC 2012
OReillyStrata
 
clearScienceStrataRx2012
OReillyStrata
 

Recently uploaded (20)

PDF
Google I/O Extended 2025 Baku - all ppts
HusseinMalikMammadli
 
PPTX
What-is-the-World-Wide-Web -- Introduction
tonifi9488
 
PPTX
The-Ethical-Hackers-Imperative-Safeguarding-the-Digital-Frontier.pptx
sujalchauhan1305
 
PDF
Presentation about Hardware and Software in Computer
snehamodhawadiya
 
PDF
Trying to figure out MCP by actually building an app from scratch with open s...
Julien SIMON
 
PDF
Research-Fundamentals-and-Topic-Development.pdf
ayesha butalia
 
PPTX
Simple and concise overview about Quantum computing..pptx
mughal641
 
PPTX
AI and Robotics for Human Well-being.pptx
JAYMIN SUTHAR
 
PDF
Responsible AI and AI Ethics - By Sylvester Ebhonu
Sylvester Ebhonu
 
PPTX
Agile Chennai 18-19 July 2025 | Emerging patterns in Agentic AI by Bharani Su...
AgileNetwork
 
PDF
Software Development Methodologies in 2025
KodekX
 
PDF
How ETL Control Logic Keeps Your Pipelines Safe and Reliable.pdf
Stryv Solutions Pvt. Ltd.
 
PDF
AI Unleashed - Shaping the Future -Starting Today - AIOUG Yatra 2025 - For Co...
Sandesh Rao
 
PDF
Brief History of Internet - Early Days of Internet
sutharharshit158
 
PDF
NewMind AI Weekly Chronicles - July'25 - Week IV
NewMind AI
 
PPTX
Agile Chennai 18-19 July 2025 Ideathon | AI Powered Microfinance Literacy Gui...
AgileNetwork
 
PDF
Tea4chat - another LLM Project by Kerem Atam
a0m0rajab1
 
PDF
Oracle AI Vector Search- Getting Started and what's new in 2025- AIOUG Yatra ...
Sandesh Rao
 
PPTX
cloud computing vai.pptx for the project
vaibhavdobariyal79
 
PDF
Peak of Data & AI Encore - Real-Time Insights & Scalable Editing with ArcGIS
Safe Software
 
Google I/O Extended 2025 Baku - all ppts
HusseinMalikMammadli
 
What-is-the-World-Wide-Web -- Introduction
tonifi9488
 
The-Ethical-Hackers-Imperative-Safeguarding-the-Digital-Frontier.pptx
sujalchauhan1305
 
Presentation about Hardware and Software in Computer
snehamodhawadiya
 
Trying to figure out MCP by actually building an app from scratch with open s...
Julien SIMON
 
Research-Fundamentals-and-Topic-Development.pdf
ayesha butalia
 
Simple and concise overview about Quantum computing..pptx
mughal641
 
AI and Robotics for Human Well-being.pptx
JAYMIN SUTHAR
 
Responsible AI and AI Ethics - By Sylvester Ebhonu
Sylvester Ebhonu
 
Agile Chennai 18-19 July 2025 | Emerging patterns in Agentic AI by Bharani Su...
AgileNetwork
 
Software Development Methodologies in 2025
KodekX
 
How ETL Control Logic Keeps Your Pipelines Safe and Reliable.pdf
Stryv Solutions Pvt. Ltd.
 
AI Unleashed - Shaping the Future -Starting Today - AIOUG Yatra 2025 - For Co...
Sandesh Rao
 
Brief History of Internet - Early Days of Internet
sutharharshit158
 
NewMind AI Weekly Chronicles - July'25 - Week IV
NewMind AI
 
Agile Chennai 18-19 July 2025 Ideathon | AI Powered Microfinance Literacy Gui...
AgileNetwork
 
Tea4chat - another LLM Project by Kerem Atam
a0m0rajab1
 
Oracle AI Vector Search- Getting Started and what's new in 2025- AIOUG Yatra ...
Sandesh Rao
 
cloud computing vai.pptx for the project
vaibhavdobariyal79
 
Peak of Data & AI Encore - Real-Time Insights & Scalable Editing with ArcGIS
Safe Software
 

Visualizing Networks: Beyond the Hairball

  • 1. Visualizing Networks Beyond the “Hairball” Lynn Cherny @arnicas O’Reilly Strata NYC 2012
  • 2. Visualizing Networks Beyond the “Hairball” Lynn Cherny @arnicas O’Reilly Strata NYC 2012
  • 3. PS(A): I AM NOT JASON SUNDRAM He could not make it, and asked me to take over. 2
  • 4. The Hairball: A Metaphor for Complexity http://www.nd.edu/~networks/Publication%20Categories/01%20Review%20Articles/ScaleFree_Scientific%20Ameri %20288,%2060-69%20(2003).pdf
  • 7. WHAT IS A NETWORK? It’s not a visualization. Think of it as a data structure.
  • 8. Data relationship: entities + relationships to other objects (node/edge, vertex/link) Nodes and Edges may have attributes, eg. gender, age, weight, tv prefs connection date, frequency of contact, type of exchange, directionality of relationship attributes may be calculated from network itself
  • 12. Best! A User Study on Visualizing Directed Edges in Graphs” Danny Holten and Jarke J. van Wijk, 27th SIGCHI Conference on Human Factors in Computing Systems (Proceedings of CHI 2009), http://blog.visual.ly/network-visualizations/ 9
  • 13. 10
  • 14. 10
  • 15. 10
  • 16. It’s a natural human trait to see visual similarity and proximity as meaningful. Be very careful about your display choices and layout methods! 10
  • 17. Reading a network visualization There’s obviously something important going on here, structurally....
  • 18. Reading a network visualization Lo o k a t th is o utl ier cas e! There’s obviously something important going on here, structurally....
  • 19. Reading a network visualization à Lo o age k a mé n ere t th A ver h is o i s o utl tro ier cas e! There’s obviously something important going on here, structurally....
  • 20. S? MIReading a network visualization à Lo o age k a mé n ere t th A ver h is o i s o utl tro ier cas e! There’s obviously something important going on here, structurally.... Using a “random” Gephi layout on the dolphins
  • 21. S? MIReading a network visualization à Lo o age k a mé n ere t th A ver h is o i s o utl tro ier cas e! Rando m! There’s obviously something important going on here, structurally.... Using a “random” Gephi layout on the dolphins
  • 22. Design Examples s! lp h in o it h D w
  • 23. The Dolphins of Doubtful Sound http://www.doc.govt.nz/documents/conservation/native-animals/marine-mammals/abundance-population- structure-bottlenose-dolphins-doubtful-dusky-sounds.pdf
  • 24. “The bottlenose dolphin community of Doubtful Sound features a large proportion of long-lasting associations. Can geographic isolation explain this unique trait?” David Lusseau et al. BEHAVIORAL ECOLOGY AND SOCIOBIOLOGY Volume 54, Number 4 (2003) http://www.springerlink.com/content/pepxvj4lu42ur2gw/
  • 25. “The bottlenose dolphin community of Doubtful Sound features a large proportion of long-lasting associations. Can geographic isolation explain this unique trait?” ! ti tle p er l pa tua ac e Th David Lusseau et al. BEHAVIORAL ECOLOGY AND SOCIOBIOLOGY Volume 54, Number 4 (2003) http://www.springerlink.com/content/pepxvj4lu42ur2gw/
  • 26. “SF” “ULT” 2 hung out D. Lusseau, Evidence for Social Role in a Dolphin Social Network. Evol Ecol (2007) 21:357–366
  • 27. Citation: Lusseau D (2007) Why Are Male Social Relationships Complex in the Doubtful Sound Bottlenose Dolphin Population?. PLoS ONE 2(4): e348. doi:10.1371/journal.pone.0000348
  • 28. Citation: Lusseau D (2007) Why Are Male Social Relationships Complex in the Doubtful Sound Bottlenose Dolphin Population?. PLoS ONE 2(4): e348. doi:10.1371/journal.pone.0000348 define relationship Using “mirroring” to
  • 29. Citation: Lusseau D (2007) Why Are Male Social Relationships Complex in the Doubtful Sound Bottlenose Dolphin Population?. PLoS ONE 2(4): e348. doi:10.1371/journal.pone.0000348 define edges “headbutting” to define relationship UsingUsing “mirroring” to
  • 30. TOOLS FOR TODAY Creating network layouts... 17
  • 31. Gephi 18
  • 32. Or “D3” (d3js.org) • A “build it yourself” svg-based visualization library • Import graphs as (or parse to create) a json node-link structure
  • 33. Making a Network Who is your audience? What’s the goal? Exploration / Iterative visualization during data analysis? End-user communication?
  • 34. Making a Network Who is your audience? What’s the goal? Exploration / Iterative visualization during data analysis? End-user communication? Layout choices: by hand, algorithmic, style... Understand the global and local context with some stats about actors and roles in the network Improve your layout with stats / attributes - inherent (such as gender) or calculated (e.g., degree) Add interactivity for end users if appropriate
  • 35. J Bertin: Semiology of Graphics Linear Circular Irregular Regular (Tree) 3D Matrix / Bipartite Bertin, J. Semiology of Graphics: Diagrams, Networks, Maps (1967)
  • 36. Algorithmic Approaches Frank van Ham talk slides: http://bit.ly/s6udpy
  • 37. (Trees are a whole other subject) Treevis.net: http://www.informatik.uni-rostock.de/~hs162/treeposter/poster.html
  • 40. Real social networks are generally quite sparse. http://www.cise.ufl.edu/research/sparse/matrices/Newman/ dolphins.html
  • 41. D3 demo by me http://www.ghostweather.com/essays/talks/networkx/adjacency.html
  • 42. NodeTrix: A Hybrid Visualization of Social Networks. Nathalie Henry, Jean-Daniel Fekete, and Michael J. McGuffin. (2007) http://arxiv.org/abs/0705.0599
  • 45. ARC / LINEAR LAYOUTS
  • 46. Philipp Steinweber and Andreas Koller Similar Diversity, 2007 For a D3 example in another domain: http://tradearc.laserdeathstehr.com/
  • 51. Bertin’s Thought Process Bertin, J. Semiology of Graphics: Diagrams, Networks, Maps (1967)
  • 53. (P) Paris (Z) Paris Suburbs (+50) Communes of >50K (+10) Communes of >10K (-10) Communes of <10K (R) Rural
  • 54. CIRCULAR / CHORD LAYOUTS
  • 55. “If it's Circos pro bab rou ly d nd, o it Circ os ” can http://circos.ca/images/
  • 56. Simple Orderings of Nodes Circular Layout “Dual Circle” layout with Sorted by ordered by Degree most popular dolphin in center Modularity 41 Dolphins colored by modularity class (community) in Gephi
  • 59. Hierarchical Edge Bundling "Hierarchical Edge Bundles: Visualization of Adjacency Relations in Hierarchical Data”, Danny Holten, IEEE Transactions on Visualization and Computer Graphics (TVCG; Proceedings of Vis/InfoVis 2006), Vol. 12, No. 5,
  • 60. A D3 Example by M. Bostock D3: http://bl.ocks.org/1044242
  • 61. A very short detour into maps...
  • 62. 46 Flow Map Layout, Phan et al (2005) http://graphics.stanford.edu/papers/flow_map_layout/
  • 63. 46 Flow Map Layout, Phan et al (2005) http://graphics.stanford.edu/papers/flow_map_layout/
  • 64. "Force-Directed Edge Bundling for Graph Visualization”, Danny Holten and Jarke J. van Wijk, 11th Eurographics/IEEE-VGTC Symposium on Visualization (Computer Graphics Forum; Proceedings of EuroVis 2009), Pages 983 - 990, 2009.
  • 65. Divided Edge Bundling for Directional Network Data David Selassie, Brandon Heller, Jeffrey Heer IEEE Trans. Visualization & Comp. Graphics (Proc. InfoVis), 2011 48
  • 69. 51 Jerome’s version with the map is not available online, sorry.
  • 71. Moritz Stefaner’s Muesli Problem https://speakerdeck.com/u/moritzstefaner/p/omg-its-all-connected
  • 73. s li ke iou ch lic u m ot de o “ To s, n h!” el f o om oug ims hr en to h us m i tz or -M https://speakerdeck.com/u/moritzstefaner/p/omg-its-all-connected
  • 75. ALGORITHMIC LAYOUTS Gephi / D3.js / Other tools
  • 76. Gephi  Sigma.js Gephi.org: Open source, runs on Mac, Linux, PC Can be run from a python-esque console plugin or UI Can be run “headless” for layouts (Jason Sundram) https://github.com/jsundram/pygephi Plugins include a Neo4j graph db access, and streaming support Sigma.js : Will display a gexf gephi layout file with minimal work, using a plugin interpreter for sigma Also offers a force-directed layout plugin for graphs without x&y coords Does CANVAS drawing, not SVG
  • 78. Movie: Sigma.js version of the Gephi export http://exploringdata.github.com/vis/human-disease-
  • 79. Using Sigma.js basic_sigma.js <div class="sigma-expand“ function init() { // Instanciate sigma.js and customize rendering : id="sigma-example"></div> var sigInst = sigma.init(document.getElementById('sigma-example')) .drawingProperties({ defaultLabelColor: '#fff', defaultLabelSize: 14, defaultLabelBGColor: '#fff', defaultLabelHoverColor: '#000', labelThreshold: 6, defaultEdgeType: 'curve' }).graphProperties({ minNodeSize: 0.5, maxNodeSize: 5, minEdgeSize: 1, maxEdgeSize: 1 }).mouseProperties({ Where maxRatio: 32 }); to put // Parse a GEXF encoded file to fill the graph the <script src="../js/sigma.min.js"></script> // (requires "sigma.parseGexf.js" to be included) <script src="../js/sigma.parseGexf.js"></script> sigInst.parseGexf('color_by_mod.gexf'); graph <script src="basic_sigma.js"></script> // Draw the graph : sigInst.draw(); } Your graph if (document.addEventListener) { document.addEventListener("DOMContentLoaded", init, false); } else { window.onload = init; } In sigma.js’s github (under plugins!)
  • 80. Sample Layout Plugins in Gephi https://gephi.org/tutorials/gephi-tutorial-layouts.pdf
  • 81. Gephi Plugin Layout Details Layout Complexity Graph Size Author Comment Circular O(N) 1 to 1M nodes Matt Groeninger Used to show distribution, ordered layout Radial Axis O(N) 1 to 1M nodes Matt Groeninger Show ordered groups (homophily) Force Atlas O(N²) 1 to 10K nodes Mathieu Jacomy Slow, but uses edge weight and few biases Force Atlas 2 O(N*log(N)) 1 to 1M nodes Mathieu (does not use Jacomy weight) OpenOrd O(N*log(N)) 100 to 1M nodes S. Martin, W. M. Focus on clustering Brown, R. Klavans, (uses edge weight) Yifan Hu O(N*log(N)) 100 to 100K nodes and K. Boyack Yifan Hu (no edge weight) Fruchterman- O(N²) 1 to 1K nodes Fruchterman & Particle system, slow Rheingold Rheingold! (no edge weight) GeoLayout O(N) 1 to 1M nodes Alexis Jacomy Uses Lat/Long for layout https://gephi.org/2011/new-tutorial-layouts-in-gephi/
  • 82. Dolphins Again OpenOrd + “No Overlap” ForceAtlas2 63
  • 83. Dolphins Again OpenOrd + “No Overlap” ForceAtlas2 63
  • 84. Dolphins Again OpenOrd + “No Overlap” ForceAtlas2 63
  • 85. Unweighted dolphins, Force Atlas Weight 2: Force Atlas Weight 4: Force Atlas 64
  • 86. Unweighted dolphins, Force Atlas Weight 2: Force Atlas Weight 4: Force Atlas Weight 4: Yifan Hu 64
  • 87. Canvas/SVG benchmarks from the d3.js group: https://docs.google.com/spreadsheet/ ccc? Nick Diakapolous: http://nad.webfactional.com/ntap/graphscale/ key=0AtvlFoSBUC5kdEZJNVFySG9wSHZk
  • 88. Canvas/SVG benchmarks from the d3.js group: https://docs.google.com/spreadsheet/ ccc? Nick Diakapolous: http://nad.webfactional.com/ntap/graphscale/ key=0AtvlFoSBUC5kdEZJNVFySG9wSHZk
  • 89. SIMPLE CALCULATIONS ON NETWORKS CAN TELL YOU Often you need to visualize the structure/role of the graph elements as part of the visualization: So, do some simple math.
  • 90. Degree (In, Out) “Degree” is a measure of the edges in (directed), out (directed), or total (in directed or undirected graphs) to a node “Hub” nodes have high in- degree. In scale-free networks, we see preferential attachment to the popular kids. http://mlg.ucd.ie/files/summer/tutorial.pdf
  • 91. Scale-free Networks Image from Lada Adamic’s SNA Course on Coursera pdf 3D
  • 92. The Threat of Hub-Loss Albert-László Barabási and Eric Bonabeau, Scale-Free Networks, 2003.http://www.scientificamerican.com/ article.cfm?id=scale-free-networks
  • 93. Visualization Aside: If Some Names are Huge, the Others are Invisible-? 70 Correcting for text size by degree display issue
  • 94. Visualization Aside: If Some Names are Huge, the Others are Invisible-? Gephi Panel 70 Correcting for text size by degree display issue
  • 95. Visualization Aside: If Some Names are Huge, the Others are Invisible-? Gephi Panel 70 Correcting for text size by degree display issue
  • 96. Visualization Aside: If Some Names are Huge, the Others are Invisible-? Gephi Panel 70 Correcting for text size by degree display issue
  • 97. Betweenness A measure of connectedness between (sub)components of the graph “Betweenness centrality thus tends to pick out boundary individuals who play the role of brokers between communities.” Lusseau and Newman. http://www.ncbi.nlm.nih.gov/pmc/ articles/PMC1810112/pdf/15801609.pdf http://en.wikipedia.org/wiki/Centrality#Betweenness_centrality
  • 98. Judging By Eye Will Probably Be Wrong... 72
  • 99. Judging By Eye Will Probably Be Wrong... ? This one? 72
  • 100. Judging By Eye Will Probably Be Wrong... ? This one? Sized by Betweenness 72
  • 101. Eigenvector Centrality Intuition: A node is important if it is connected to other important nodes A node with a small number of influential contacts may outrank one with a larger number of mediocre contacts http://mlg.ucd.ie/files/summer/tutorial.pdf http://demonstrations.wolfram.com/
  • 103. Community Detection E.g., the Louvain method, in Gephi as “Modularity.” Many layout algorithms help you intuit these structures, but don’t rely on perception of layout! http://en.wikipedia.org/wiki/File:Network_Community_Structure.png
  • 104. Citation: Lusseau D (2007) Why Are Male Social Relationships Complex in the Doubtful Sound Bottlenose Dolphin Population?. PLoS ONE 2(4): e348. doi:10.1371/journal.pone.0000348
  • 105. Citation: Lusseau D (2007) Why Are Male Social Relationships Complex in the Doubtful Sound Bottlenose Dolphin Population?. PLoS ONE 2(4): e348. doi:10.1371/journal.pone.0000348 77
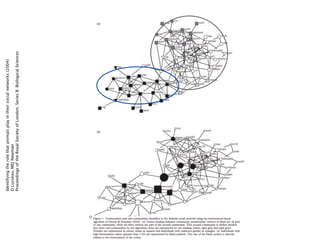
  • 106. Identifying the role that animals play in their social networks (2004) D Lusseau, MEJ Newman Proceedings of the Royal Society of London. Series B: Biological Sciences
  • 107. Identifying the role that animals play in their social networks (2004) D Lusseau, MEJ Newman Proceedings of the Royal Society of London. Series B: Biological Sciences
  • 108. Identifying the role that animals play in their social networks (2004) D Lusseau, MEJ Newman Proceedings of the Royal Society of London. Series B: Biological Sciences
  • 109. Identifying the role that animals play in their social networks (2004) D Lusseau, MEJ Newman Proceedings of the Royal Society of London. Series B: Biological Sciences
  • 110. Identifying the role that animals play in their social networks (2004) D Lusseau, MEJ Newman Proceedings of the Royal Society of London. Series B: Biological Sciences
  • 111. Identifying the role that animals play in their social networks (2004) D Lusseau, MEJ Newman Proceedings of the Royal Society of London. Series B: Biological Sciences
  • 112. Eduarda Mendes Rodrigues, Natasa Milic-Frayling, Marc Smith, Ben Shneiderman, Derek Hansen, Group-in-a- box Layout for Multi-faceted Analysis of Communities. IEEE Third International Conference on Social
  • 115. Movie: Ger Hobbelt D3: http://bl.ocks.org/3616279
  • 116. Movie: Ger Hobbelt D3: http://bl.ocks.org/3616279
  • 118. 100 nodes, size by degree, Clustered by partition, no edges shaded by Betweenness, in until you click on one, node size is a d3.js force directed layout. choice of attributes, nodes represented by labels/colors…. http://www.ghostweather.com/essays/talks/networkx/ http://www.ghostweather.com/essays/talks/networkx/
  • 119. Movie: 84 http://www.ghostweather.com/essays/talks/networkx/force_fonts.html
  • 120. Movie: by @moebio 85 http://intuitionanalytics.com/pleiades/
  • 121. ! LOL SO YOU WANT TO LAY IT OUT YOURSELF... Perfectionist? Artist? Don’t like algorithms? 86
  • 124. Conspiracy Theorist Mark Learning from Lombardi: http://benfry.com/exd09/
  • 125. Conspiracy Theorist Mark Learning from Lombardi: http://benfry.com/exd09/
  • 127. Roche Applied Science Biochemical Pathways Map: http://web.expasy.org/cgi-bin/pathways/
  • 128. Roche Applied Science Biochemical Pathways Map: http://web.expasy.org/cgi-bin/pathways/
  • 129. Hybrid Method: Use algorithmic layout, and then adjust nodes by Ger Hobbelt in D3: http://bl.ocks.org/3637711
  • 130. Tweaking your layout is addictive! Yo ned wa u r ha ! ve ! be en Jason Davies: http://www.jasondavies.com/planarity/
  • 131. STEP BACK, SCALE UP... 94
  • 132. C.Dunne & B.Shneiderman. Network Motif Simplification. http://hcil2.cs.umd.edu/trs/
  • 133. GraphPrism: Compact Visualization of Network Structure Sanjay Kairam, Diana MacLean, Manolis Savva, Jeffrey Heer Advanced Visual Interfaces, 2012
  • 135. Video: 98 http://graphics.wsj.com/political-moneyball/
  • 136. Wrap it up on design...
  • 137. Reminders Choose your visual encodings, layout, interaction to make it a visualization, rather than raw data vomit. Take care: people will infer things from proximity/similarity even if it was not intended! Do data analysis / reduction - why would you want to show 1T of network data? Allow interactivity if needed for end users. Help people find things in your network!
  • 138. Reminders Choose your visual encodings, layout, interaction to make it a visualization, rather than raw data vomit. Take care: people will infer things from To ot sci proximity/similarity even if it was not =N o m wa ce d intended! at uc al en a h d go Do data analysis / reduction - why at ys ! a would you want to show 1T of network o d data? Allow interactivity if needed for end users. Help people find things in your network!
  • 139. More Reminders! Different layouts communicate different things to your viewer - choose wisely Reducing noise: Don’t show edges (perhaps on demand) Show details only on demand: zoom in Cluster your nodes/edges Consider if it has to be a “network” display at all: Is it the stats you care about? Or the hairball? 101
  • 140. The Map is Not the Territory… Forest Pitts (thanks to Noah Friedkin) http://www.analytictech.com/networks/pitts.htm
  • 141. The Map is Not the Territory… Forest Pitts (thanks to Noah Friedkin) http://www.analytictech.com/networks/pitts.htm
  • 143. Thanks! @arnicas [email protected] And thanks to twitter vis friends for content: @jsundram, @laneharrison, @moritz_stefaner, @jcukier, @jeff1024, @vlandham, @moebio, @jeffrey_heer, @mbostock, @eagereyes, @jasondavies, @stefpos, @sarahslo, @ndiakopoulos, @gephi
  • 144. A Few More References Jeff Heer class slides: http:// Robert Kosara’s post: http:// hci.stanford.edu/courses/cs448b/ eagereyes.org/techniques/graphs- w09/lectures/20090204- hairball GraphsAndTrees.pdf Lane Harrison’s post: http:// A great in-progress book on networks: blog.visual.ly/network- http://barabasilab.neu.edu/ visualizations/ networksciencebook/ MS Lima’s book Visual Complexity Mark Newman’s many papers: http:// Jason Sundram’s tool to drive Gephi www-personal.umich.edu/~mejn/ layout from command line: https:// Eyeo Festival videos from Moritz github.com/jsundram/pygephi Stefaner, Manuel Lima, Stefanie A couple articles on community Posavec structure: Journal of Graph Algorithms and Overlapping Community Detection Applications: http://jgaa.info/ in Networks: State of the Art home.html and Comparative Study by Jierui Jim Vallandingham’s D3 network Xie, Stephen Kelley, Boleslaw K. tutorials: http://flowingdata.com/ Szymanski 2012/08/02/how-to-make-an- Empirical Comparison of interactive-network-visualization/, Algorithms for Network

Editor's Notes