SlideShare a Scribd company logo
Visualizing ORACLE performance
with R
Maxym Kharchenko
Gluent.com
Whoami
■ Started as a database kernel developer
■ Then: ORACLE DBA for 15+ years
■ Now: Developer at Gluent (past: amazon.com)
■ OCM, ORACLE Ace Associate, AWS Certified Developer
■ Blog: http://intermediatesql.com
■ Twitter: @maxymkh
The cool things that we do at Gluent
Gluent
Oracle
Teradata
NoSQL
Big Data
Sources
MSSQL
App
X
App
Y
App
Z
We glue these
worlds together!
The cool things that we do at Gluent
Agenda
■ Why visualize with R
■ How to visualize with R
■ Pretty pictures !
■ Interesting use cases (more pretty pictures!)
■ Labs! Labs! Labs!
Why visualize ?
Why visualize ?
[1] 10.06 10.07 9.99 9.95 10.56 9.82 10.06 9.97 9.97 9.91
[11] 9.99 10.68 10.04 10.05 9.92 10.08 9.91 9.97 10.11 10.03
[21] 10.08 10.22 8.84 10.42 8.68 10.14 9.46 9.69 11.56 9.55
[31] 10.32 8.77 10.20 10.16 10.03 10.05 10.47 9.83 10.18 10.00
[41] 10.11 9.76 9.89 10.09 10.09 10.15 9.86 10.06 10.56 9.87
[51] 9.95 10.19 10.01 10.04 10.93 11.03 11.07 11.08 11.21 10.77
[61] 11.01 10.87 11.06 11.16 10.94 9.82 10.09 10.16 10.05 9.87
[71] 10.01 9.92 9.90 10.23 10.14 10.09 10.08 9.92 10.05 10.60
[81] 10.06 10.10 9.97 10.25 10.10 10.19 10.07 9.97 10.05 10.08
[91] 9.90 10.41 10.19 9.96 9.90 10.07 9.95 10.22 9.94 9.93
Why visualize ?
DBA 2.0: EM – Pretty
DBA 2.0: EM – Pretty … but not flexible
DBA 1.0: sqlplus – Flexible
SQL*Plus: Release 11.2.0.2.0 Production on Fri Feb 14
Connected to:
Oracle Database 11g Enterprise Edition Release 11.2.0.2.0
With the Partitioning and Real Application Testing options
SQL> @event_histograms db%file%sequential
DBA 1.0: sqlplus – Flexible … but not pretty
EVENT Ms PCT GRAPH
----------------------- ---- ------- --------------------
db file sequential read 1 18.43 ########
2 4.09 #
4 23.52 ##########
8 43.04 ####################
16 10.05 ####
32 .72
64 .06
128 .09
256 .01
DBA 1.0: sqlplus – Flexible … but not pretty
EVENT Ms PCT GRAPH
----------------------- ---- ------- --------------------
db file sequential read 1 18.43 ********
2 4.09 *
4 23.52 **********
8 43.04 ********************
16 10.05 ****
32 .72
64 .06
128 .09
256 .01
Ok, sqlplus CAN be pretty
Tanel Poder’s fish.sql
Need a tool: both pretty AND flexible
DBA 1.5: Enter R
How to visualize data with R
http://www.r-project.org/
What R looks like
What R looks like
If you know how to program in
Perl/Python/Ruby etc
You know how to program in
R
#***********************************************************
# Prepare exploration: Define categories, set plot type etc
#***********************************************************
prepare_exploration <- function(
fill=NULL, y="N", x="TS", pct=FALSE,
to_ts=c("TS"), top_n=8, drop_others=FALSE, data=d
) {
if(is.null(fill)) {
data$CAT <- 1
} else {
data <- add_cat_top_n(fill, y, x, top_n,
drop_others, data)
if (pct) {
data <- add_pct(y, x, data)
}
}
data <- to_ts(to_ts, data)
return(data)
}
R: Appearances are important
A = B + C
A <- B + C
R: Everything is a VECTOR
A + B
Result:
[1] 4 6 8 10 12 14 16 18 20 22
R visualization workflow
Get data
into R
Transform Visualize
Get data into R
CSV, TXT:
d <- read.csv('http://…/file.csv')
ROracle, RJDBC:
odrv <- dbDriver("Oracle")
conn <- dbConnect(odrv, user, passwd, tns)
d <- dbGetQuery(conn, sql, binds)
Data in R - a “data frame”
Transform
If you know SQL
You know how to
transform data in R
Transform
d1 <- sqldf("
SELECT event, count(1) as n
FROM d
GROUP BY event
ORDER BY n DESC LIMIT 10
")
Visualize
ggplot(d, aes) + geom
+ “other stuff”
AES: Mapping data
Time Execs
10:15 100
10:20 150
10:25 180
10:30 120
10:35 220
aes(x=Time, y=Execs)
AES: Mapping data
Time Execs Type
10:15 90 READ
10:15 10 WRITE
10:20 120 READ
10:20 30 WRITE
10:25 100 READ
10:25 80 WRITE
10:30 20 READ
10:30 100 WRITE
10:35 120 READ
10:35 100 WRITE
aes(x=Time, y=Execs,
color=Type)
Geoms
Time Execs Type
10:15 90 READ
10:15 10 WRITE
10:20 120 READ
10:20 30 WRITE
10:25 100 READ
10:25 80 WRITE
10:30 20 READ
10:30 100 WRITE
10:35 120 READ
10:35 100 WRITE
aes(x=Time, y=Execs,
fill=Type)
+ geom_bar()
Geoms
Time Execs Type
10:15 90 READ
10:15 10 WRITE
10:20 120 READ
10:20 30 WRITE
10:25 100 READ
10:25 80 WRITE
10:30 20 READ
10:30 100 WRITE
10:35 120 READ
10:35 100 WRITE
aes(x=Time, y=Execs,
color=Type)
+ geom_point()
Geoms
Time Execs Type
10:15 90 READ
10:15 10 WRITE
10:20 120 READ
10:20 30 WRITE
10:25 100 READ
10:25 80 WRITE
10:30 20 READ
10:30 100 WRITE
10:35 120 READ
10:35 100 WRITE
aes(x=Time, y=Execs,
color=Type, size=Execs)
+ geom_point()
Putting it all together
R> connect('db1')
R> exec('get_ash.sql',start_time='2016-02-01')
R> n_exec('db1, db2, db3', 'get_ash.sql',
start_time='2016-02-01')
R> d1 <- sqldf('select … from … where …')
R> explore_bar(fill='EVENT')
R> explore_area(fill='BLOCKING_SESSION')
R> explore_point(x='PARSES', y='EXECS',
color='MODULE', top=8)
Picture time !
Time series plots: v$active_session_history
Time series plots: dba_hist_seg_stat
Time series plots – ARC heat map
Not just for database metrics
■ cat listener.log | grep CONNECT_DATA | 
perl -pale 's/^(S+ S+).*(PROGRAM=(.*?)).*$/$1 $2/'
>/tmp/s.txt
Summarized data: (sampled) v$sql
v$sql.elapsed_time
Summarized data: dba_hist_sqlstat
Scatter plots: dba_hist_sqlstat
Block flowers:
dba_hist_active_sess_history
A few interesting cases
ORA-00020: Max # of processes exceeded
When was the database really “down” ?
Logon trigger: Rejected connections
What was the exact effect on the system ?
ASH.in_connection_mgmt=‘Y’
Rolling partitions:
Can we archive data older than 30 days ?
dba_hist_seg_stat.
db_block_changes_delta
dba_hist_seg_stat.
logical_reads_delta
Query latency:
Can we trust the “average” elapsed time ?
Query latency:
Can we trust the “average” elapsed time ?
Query latency:
Can we trust the “average” elapsed time ?
Takeaways
■ R is a sqlplus with graphics
■ If you know how to script, R is easy to master
■ Did I mention that R is free ?

More Related Content

What's hot (20)

PDF
When RegEx is not enough
Nati Cohen
 
PPTX
Value protocols and codables
Florent Vilmart
 
PPTX
Naughty And Nice Bash Features
Nati Cohen
 
PPTX
All you need to know about the JavaScript event loop
Saša Tatar
 
PPT
Realtime Analytics Using MongoDB, Python, Gevent, and ZeroMQ
Rick Copeland
 
PDF
Go database/sql
Artem Kovardin
 
PDF
JavaScript - new features in ECMAScript 6
Solution4Future
 
PDF
EcmaScript 6 - The future is here
Sebastiano Armeli
 
PDF
ES2015 (ES6) Overview
hesher
 
PPTX
Introduction to Ecmascript - ES6
Nilesh Jayanandana
 
PPTX
Modern JS with ES6
Kevin Langley Jr.
 
PPTX
CouchDB Day NYC 2017: Full Text Search
IBM Cloud Data Services
 
PDF
Javascript development done right
Pawel Szulc
 
PDF
Javascript ES6 generators
RameshNair6
 
PDF
Python RESTful webservices with Python: Flask and Django solutions
Solution4Future
 
PDF
Go memory
jgrahamc
 
PDF
node ffi
偉格 高
 
PPTX
10 tips for making Bash a sane programming language
Yaroslav Tkachenko
 
PDF
Cross Domain Web
Mashups with JQuery and Google App Engine
Andy McKay
 
PDF
PuppetDB, Puppet Explorer and puppetdbquery
Puppet
 
When RegEx is not enough
Nati Cohen
 
Value protocols and codables
Florent Vilmart
 
Naughty And Nice Bash Features
Nati Cohen
 
All you need to know about the JavaScript event loop
Saša Tatar
 
Realtime Analytics Using MongoDB, Python, Gevent, and ZeroMQ
Rick Copeland
 
Go database/sql
Artem Kovardin
 
JavaScript - new features in ECMAScript 6
Solution4Future
 
EcmaScript 6 - The future is here
Sebastiano Armeli
 
ES2015 (ES6) Overview
hesher
 
Introduction to Ecmascript - ES6
Nilesh Jayanandana
 
Modern JS with ES6
Kevin Langley Jr.
 
CouchDB Day NYC 2017: Full Text Search
IBM Cloud Data Services
 
Javascript development done right
Pawel Szulc
 
Javascript ES6 generators
RameshNair6
 
Python RESTful webservices with Python: Flask and Django solutions
Solution4Future
 
Go memory
jgrahamc
 
node ffi
偉格 高
 
10 tips for making Bash a sane programming language
Yaroslav Tkachenko
 
Cross Domain Web
Mashups with JQuery and Google App Engine
Andy McKay
 
PuppetDB, Puppet Explorer and puppetdbquery
Puppet
 

Similar to Visualizing ORACLE performance data with R @ #C16LV (20)

PDF
ASHviz - Dats visualization research experiments using ASH data
John Beresniewicz
 
PDF
Overview of running R in the Oracle Database
Brendan Tierney
 
PPTX
R training at Aimia
Ali Arsalan Kazmi
 
PDF
Introduction to Data Mining with R and Data Import/Export in R
Yanchang Zhao
 
PPTX
Data Analytics: Understanding Your MongoDB Data
MongoDB
 
PPTX
Example R usage for oracle DBA UKOUG 2013
BertrandDrouvot
 
PPTX
Get up to Speed (Quick Guide to data.table in R and Pentaho PDI)
Serban Tanasa
 
PDF
Oracle Advanced Analytics
aghosh_us
 
PDF
ITI015En-The evolution of databases (I)
Huibert Aalbers
 
PDF
An R primer for SQL folks
Thomas Hütter
 
PDF
Data visualization
Moushmi Dasgupta
 
PPTX
Overview data analyis and visualisation tools 2020
Marié Roux
 
PPTX
1 introduction
Ngeam Soly
 
PPTX
Mis chapter 7 database systems
Filmon Habtemichael Tesfai
 
PDF
Hailey_Database_Performance_Made_Easy_through_Graphics.pdf
cookie1969
 
PPTX
How to Empower Your Business Users with Oracle Data Visualization
Perficient, Inc.
 
PPTX
Big Data & Oracle Technologies
Oleksii Movchaniuk
 
PDF
Introduction to Data Analtics with Pandas [PyCon Cz]
Alexander Hendorf
 
PPTX
DBA Commands and Concepts That Every Developer Should Know - Part 2
Alex Zaballa
 
PPTX
DBA Commands and Concepts That Every Developer Should Know - Part 2
Alex Zaballa
 
ASHviz - Dats visualization research experiments using ASH data
John Beresniewicz
 
Overview of running R in the Oracle Database
Brendan Tierney
 
R training at Aimia
Ali Arsalan Kazmi
 
Introduction to Data Mining with R and Data Import/Export in R
Yanchang Zhao
 
Data Analytics: Understanding Your MongoDB Data
MongoDB
 
Example R usage for oracle DBA UKOUG 2013
BertrandDrouvot
 
Get up to Speed (Quick Guide to data.table in R and Pentaho PDI)
Serban Tanasa
 
Oracle Advanced Analytics
aghosh_us
 
ITI015En-The evolution of databases (I)
Huibert Aalbers
 
An R primer for SQL folks
Thomas Hütter
 
Data visualization
Moushmi Dasgupta
 
Overview data analyis and visualisation tools 2020
Marié Roux
 
1 introduction
Ngeam Soly
 
Mis chapter 7 database systems
Filmon Habtemichael Tesfai
 
Hailey_Database_Performance_Made_Easy_through_Graphics.pdf
cookie1969
 
How to Empower Your Business Users with Oracle Data Visualization
Perficient, Inc.
 
Big Data & Oracle Technologies
Oleksii Movchaniuk
 
Introduction to Data Analtics with Pandas [PyCon Cz]
Alexander Hendorf
 
DBA Commands and Concepts That Every Developer Should Know - Part 2
Alex Zaballa
 
DBA Commands and Concepts That Every Developer Should Know - Part 2
Alex Zaballa
 
Ad

Recently uploaded (20)

PDF
The Rise of AI and IoT in Mobile App Tech.pdf
IMG Global Infotech
 
PDF
Agentic AI lifecycle for Enterprise Hyper-Automation
Debmalya Biswas
 
PDF
New from BookNet Canada for 2025: BNC BiblioShare - Tech Forum 2025
BookNet Canada
 
DOCX
Cryptography Quiz: test your knowledge of this important security concept.
Rajni Bhardwaj Grover
 
PDF
“NPU IP Hardware Shaped Through Software and Use-case Analysis,” a Presentati...
Edge AI and Vision Alliance
 
PDF
Book industry state of the nation 2025 - Tech Forum 2025
BookNet Canada
 
PPTX
AUTOMATION AND ROBOTICS IN PHARMA INDUSTRY.pptx
sameeraaabegumm
 
PDF
Newgen 2022-Forrester Newgen TEI_13 05 2022-The-Total-Economic-Impact-Newgen-...
darshakparmar
 
PDF
[Newgen] NewgenONE Marvin Brochure 1.pdf
darshakparmar
 
PPTX
COMPARISON OF RASTER ANALYSIS TOOLS OF QGIS AND ARCGIS
Sharanya Sarkar
 
PDF
Jak MŚP w Europie Środkowo-Wschodniej odnajdują się w świecie AI
dominikamizerska1
 
PPTX
Seamless Tech Experiences Showcasing Cross-Platform App Design.pptx
presentifyai
 
PDF
Transcript: Book industry state of the nation 2025 - Tech Forum 2025
BookNet Canada
 
PPTX
Designing_the_Future_AI_Driven_Product_Experiences_Across_Devices.pptx
presentifyai
 
PDF
Reverse Engineering of Security Products: Developing an Advanced Microsoft De...
nwbxhhcyjv
 
PDF
"AI Transformation: Directions and Challenges", Pavlo Shaternik
Fwdays
 
PPTX
"Autonomy of LLM Agents: Current State and Future Prospects", Oles` Petriv
Fwdays
 
PDF
Mastering Financial Management in Direct Selling
Epixel MLM Software
 
PPTX
Webinar: Introduction to LF Energy EVerest
DanBrown980551
 
PDF
CIFDAQ Token Spotlight for 9th July 2025
CIFDAQ
 
The Rise of AI and IoT in Mobile App Tech.pdf
IMG Global Infotech
 
Agentic AI lifecycle for Enterprise Hyper-Automation
Debmalya Biswas
 
New from BookNet Canada for 2025: BNC BiblioShare - Tech Forum 2025
BookNet Canada
 
Cryptography Quiz: test your knowledge of this important security concept.
Rajni Bhardwaj Grover
 
“NPU IP Hardware Shaped Through Software and Use-case Analysis,” a Presentati...
Edge AI and Vision Alliance
 
Book industry state of the nation 2025 - Tech Forum 2025
BookNet Canada
 
AUTOMATION AND ROBOTICS IN PHARMA INDUSTRY.pptx
sameeraaabegumm
 
Newgen 2022-Forrester Newgen TEI_13 05 2022-The-Total-Economic-Impact-Newgen-...
darshakparmar
 
[Newgen] NewgenONE Marvin Brochure 1.pdf
darshakparmar
 
COMPARISON OF RASTER ANALYSIS TOOLS OF QGIS AND ARCGIS
Sharanya Sarkar
 
Jak MŚP w Europie Środkowo-Wschodniej odnajdują się w świecie AI
dominikamizerska1
 
Seamless Tech Experiences Showcasing Cross-Platform App Design.pptx
presentifyai
 
Transcript: Book industry state of the nation 2025 - Tech Forum 2025
BookNet Canada
 
Designing_the_Future_AI_Driven_Product_Experiences_Across_Devices.pptx
presentifyai
 
Reverse Engineering of Security Products: Developing an Advanced Microsoft De...
nwbxhhcyjv
 
"AI Transformation: Directions and Challenges", Pavlo Shaternik
Fwdays
 
"Autonomy of LLM Agents: Current State and Future Prospects", Oles` Petriv
Fwdays
 
Mastering Financial Management in Direct Selling
Epixel MLM Software
 
Webinar: Introduction to LF Energy EVerest
DanBrown980551
 
CIFDAQ Token Spotlight for 9th July 2025
CIFDAQ
 
Ad

Visualizing ORACLE performance data with R @ #C16LV

  • 1. Visualizing ORACLE performance with R Maxym Kharchenko Gluent.com
  • 2. Whoami ■ Started as a database kernel developer ■ Then: ORACLE DBA for 15+ years ■ Now: Developer at Gluent (past: amazon.com) ■ OCM, ORACLE Ace Associate, AWS Certified Developer ■ Blog: http://intermediatesql.com ■ Twitter: @maxymkh
  • 3. The cool things that we do at Gluent Gluent Oracle Teradata NoSQL Big Data Sources MSSQL App X App Y App Z We glue these worlds together!
  • 4. The cool things that we do at Gluent
  • 5. Agenda ■ Why visualize with R ■ How to visualize with R ■ Pretty pictures ! ■ Interesting use cases (more pretty pictures!) ■ Labs! Labs! Labs!
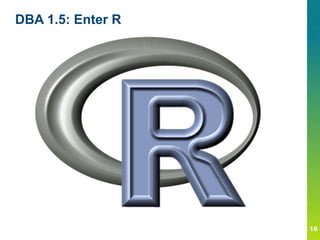
  • 7. Why visualize ? [1] 10.06 10.07 9.99 9.95 10.56 9.82 10.06 9.97 9.97 9.91 [11] 9.99 10.68 10.04 10.05 9.92 10.08 9.91 9.97 10.11 10.03 [21] 10.08 10.22 8.84 10.42 8.68 10.14 9.46 9.69 11.56 9.55 [31] 10.32 8.77 10.20 10.16 10.03 10.05 10.47 9.83 10.18 10.00 [41] 10.11 9.76 9.89 10.09 10.09 10.15 9.86 10.06 10.56 9.87 [51] 9.95 10.19 10.01 10.04 10.93 11.03 11.07 11.08 11.21 10.77 [61] 11.01 10.87 11.06 11.16 10.94 9.82 10.09 10.16 10.05 9.87 [71] 10.01 9.92 9.90 10.23 10.14 10.09 10.08 9.92 10.05 10.60 [81] 10.06 10.10 9.97 10.25 10.10 10.19 10.07 9.97 10.05 10.08 [91] 9.90 10.41 10.19 9.96 9.90 10.07 9.95 10.22 9.94 9.93
  • 9. DBA 2.0: EM – Pretty
  • 10. DBA 2.0: EM – Pretty … but not flexible
  • 11. DBA 1.0: sqlplus – Flexible SQL*Plus: Release 11.2.0.2.0 Production on Fri Feb 14 Connected to: Oracle Database 11g Enterprise Edition Release 11.2.0.2.0 With the Partitioning and Real Application Testing options SQL> @event_histograms db%file%sequential
  • 12. DBA 1.0: sqlplus – Flexible … but not pretty EVENT Ms PCT GRAPH ----------------------- ---- ------- -------------------- db file sequential read 1 18.43 ######## 2 4.09 # 4 23.52 ########## 8 43.04 #################### 16 10.05 #### 32 .72 64 .06 128 .09 256 .01
  • 13. DBA 1.0: sqlplus – Flexible … but not pretty EVENT Ms PCT GRAPH ----------------------- ---- ------- -------------------- db file sequential read 1 18.43 ******** 2 4.09 * 4 23.52 ********** 8 43.04 ******************** 16 10.05 **** 32 .72 64 .06 128 .09 256 .01
  • 14. Ok, sqlplus CAN be pretty Tanel Poder’s fish.sql
  • 15. Need a tool: both pretty AND flexible
  • 17. How to visualize data with R
  • 19. What R looks like
  • 20. If you know how to program in Perl/Python/Ruby etc You know how to program in R
  • 21. #*********************************************************** # Prepare exploration: Define categories, set plot type etc #*********************************************************** prepare_exploration <- function( fill=NULL, y="N", x="TS", pct=FALSE, to_ts=c("TS"), top_n=8, drop_others=FALSE, data=d ) { if(is.null(fill)) { data$CAT <- 1 } else { data <- add_cat_top_n(fill, y, x, top_n, drop_others, data) if (pct) { data <- add_pct(y, x, data) } } data <- to_ts(to_ts, data) return(data) }
  • 22. R: Appearances are important A = B + C A <- B + C
  • 23. R: Everything is a VECTOR A + B Result: [1] 4 6 8 10 12 14 16 18 20 22
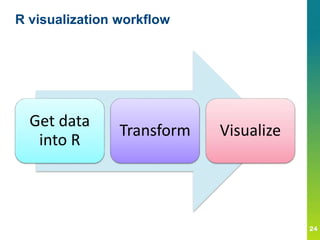
  • 24. R visualization workflow Get data into R Transform Visualize
  • 25. Get data into R CSV, TXT: d <- read.csv('http://…/file.csv') ROracle, RJDBC: odrv <- dbDriver("Oracle") conn <- dbConnect(odrv, user, passwd, tns) d <- dbGetQuery(conn, sql, binds)
  • 26. Data in R - a “data frame”
  • 27. Transform If you know SQL You know how to transform data in R
  • 28. Transform d1 <- sqldf(" SELECT event, count(1) as n FROM d GROUP BY event ORDER BY n DESC LIMIT 10 ")
  • 29. Visualize ggplot(d, aes) + geom + “other stuff”
  • 30. AES: Mapping data Time Execs 10:15 100 10:20 150 10:25 180 10:30 120 10:35 220 aes(x=Time, y=Execs)
  • 31. AES: Mapping data Time Execs Type 10:15 90 READ 10:15 10 WRITE 10:20 120 READ 10:20 30 WRITE 10:25 100 READ 10:25 80 WRITE 10:30 20 READ 10:30 100 WRITE 10:35 120 READ 10:35 100 WRITE aes(x=Time, y=Execs, color=Type)
  • 32. Geoms Time Execs Type 10:15 90 READ 10:15 10 WRITE 10:20 120 READ 10:20 30 WRITE 10:25 100 READ 10:25 80 WRITE 10:30 20 READ 10:30 100 WRITE 10:35 120 READ 10:35 100 WRITE aes(x=Time, y=Execs, fill=Type) + geom_bar()
  • 33. Geoms Time Execs Type 10:15 90 READ 10:15 10 WRITE 10:20 120 READ 10:20 30 WRITE 10:25 100 READ 10:25 80 WRITE 10:30 20 READ 10:30 100 WRITE 10:35 120 READ 10:35 100 WRITE aes(x=Time, y=Execs, color=Type) + geom_point()
  • 34. Geoms Time Execs Type 10:15 90 READ 10:15 10 WRITE 10:20 120 READ 10:20 30 WRITE 10:25 100 READ 10:25 80 WRITE 10:30 20 READ 10:30 100 WRITE 10:35 120 READ 10:35 100 WRITE aes(x=Time, y=Execs, color=Type, size=Execs) + geom_point()
  • 35. Putting it all together R> connect('db1') R> exec('get_ash.sql',start_time='2016-02-01') R> n_exec('db1, db2, db3', 'get_ash.sql', start_time='2016-02-01') R> d1 <- sqldf('select … from … where …') R> explore_bar(fill='EVENT') R> explore_area(fill='BLOCKING_SESSION') R> explore_point(x='PARSES', y='EXECS', color='MODULE', top=8)
  • 37. Time series plots: v$active_session_history
  • 38. Time series plots: v$active_session_history
  • 39. Time series plots: dba_hist_seg_stat
  • 40. Time series plots: dba_hist_seg_stat
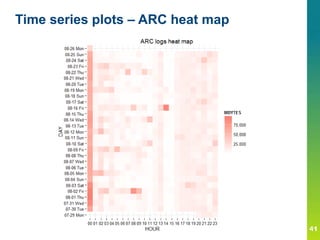
  • 41. Time series plots – ARC heat map
  • 42. Not just for database metrics ■ cat listener.log | grep CONNECT_DATA | perl -pale 's/^(S+ S+).*(PROGRAM=(.*?)).*$/$1 $2/' >/tmp/s.txt
  • 43. Summarized data: (sampled) v$sql v$sql.elapsed_time
  • 48. ORA-00020: Max # of processes exceeded When was the database really “down” ?
  • 49. Logon trigger: Rejected connections What was the exact effect on the system ? ASH.in_connection_mgmt=‘Y’
  • 50. Rolling partitions: Can we archive data older than 30 days ? dba_hist_seg_stat. db_block_changes_delta dba_hist_seg_stat. logical_reads_delta
  • 51. Query latency: Can we trust the “average” elapsed time ?
  • 52. Query latency: Can we trust the “average” elapsed time ?
  • 53. Query latency: Can we trust the “average” elapsed time ?
  • 54. Takeaways ■ R is a sqlplus with graphics ■ If you know how to script, R is easy to master ■ Did I mention that R is free ?