3
Most read
7
Most read
8
Most read
ZOMATO RESTAURANT ANALYSIS
INTRODUCTION
Objective: Analyze Zomato restaurant data to uncover insights.
Key Focus Areas:
Restaurant distribution
Average price analysis
Customer ratings & reviews
Popular cuisines
City-wise trends
DATA CLEANING & PREPROCESSING
Challenges:
• Data contained null values, special characters in the field, currency was not
distributed as per the countries.
Steps Taken:
• Removed null values
• Standardized currency & location data
• Categorized price ranges
• Removed Special Characters in the field
OVERVIEW
Dataset Overview:
Number of restaurants: 9551
Number of Countries : 15
Number of Cities : 141
Number of Cuisines : 1826
Average Rating of all the restaurant ; 2.89
OBSERVATIONS
• Out of 9551 restaurants
1.73K(22.57%) restaurants provides Online Delivery
whereas 5.92k(77.43%) don’t have the online delivery
system
• Out of 9551 restaurants
1.03K(13.64%) restaurants provides table booking whereas
6.49k(86.36%) don’t have the table booking facility
For India
• Out of 8652 restaurants
1.7K(25.04%) restaurants provides Online Delivery
whereas 5.1k(74.96%) don’t have the online delivery
system
• Out of 8652 restaurants
0.98K(14.75%) restaurants provides table booking whereas
5.68k(85.25%) don’t have the table booking facility
• Countries which don’t provide online delivery and table booking facility are : Indonesia, Canada, New
Zealand, Brazil, Singapore, Sri Lanka Turkey, United States.
• In the year 2018 most restaurants were opened (i.e 1102)whereas least restaurants opened in the year
2012(1022)
• New Delhi has the most restaurant 5473
Highest count at Rating 1 (2.1K restaurants)
•A significant number of restaurants received the lowest rating.
•This could indicate dissatisfaction, poor service, or bad food
quality for a large segment.
Sharp drop to nearly 0 at Rating 2
•There is almost no representation at a rating of 2.
•This suggests that restaurants either receive very low or
moderate-to-good ratings, skipping the middle ground.
Gradual rise in Ratings 3 to 4 (around 0.5K each)
• Ratings 3 and 4 have a similar number of restaurants (~500
each).
•This indicates that a moderate number of restaurants are rated
average to slightly above average.
Slight decline toward Rating 5
•Only about 0.1K (100 restaurants) received a perfect 5-star
rating.
•This suggests that very few restaurants achieve the highest
rating, possibly due to high customer expectations.
Average cost for two
• Restaurants with Average cost for 2 between 0-100
bucket are 0.4k
• Highest i.e 500+ average cost there are 3.4k
restaurants.
• Most restaurants fall into the 500+ category,
suggesting market concentration at the higher end.
• The middle categories (201-500) have a balanced
distribution
• This analysis suggests that a significant portion of
restaurants have a high volume of Price, possibly
due to chain restaurants or high operational scale
Excel Dashbaord
Summary
•India dominates the restaurant count.
•The majority of restaurants do not offer online
delivery or table booking.
•North Indian cuisine is the most popular.
•Restaurant openings have been consistent, peaking in
2011 and 2018.
•The average rating is relatively low (2.89), indicating
room for improvement in customer satisfaction
PowerBI Dashbaord
Tableau Dashboard
Competitor & Market Analysis for the Low rating Restaurants
🔹 Competitor Benchmarking: Compare restaurant performance (ratings, reviews, orders)
against competitors.
🔹 Customer Segmentation: Identify high-value customers and repeat buyers to improve
loyalty programs.
🔹 Regional Expansion Opportunities: Identify cities/countries with high potential but low
restaurant penetration.
Customer Behavior & Satisfaction
🔹 Customer Feedback Analysis: Identify common complaints or positive reviews to improve
service.
🔹 Loyalty & Retention Metrics: Track repeat customers and analyze their average spending
patterns.
🔹 Order Trends by Time of Day: Identify best-selling dishes and peak ordering times
Restaurant Performance & Profitability
🔹 Identify Underperforming Restaurants: Compare ratings, reviews, and sales data to detect
struggling locations.
🔹 Cost & Profit Analysis: Track expenses, food costs, and delivery charges to optimize pricing
strategies.
🔹 Most Profitable Cuisines & Dishes: Identify high-margin cuisines and promote them
accordingly.
Business Growth Strategy
🔹 Franchise & Expansion Strategy: Identify high-potential cities/countries for launching new
branches.
🔹 Strategic Marketing Plan: Use historical trends to optimize advertising budgets and
promotions.
🔹 Delivery & Logistics Optimization: Improve delivery efficiency by analyzing delivery times and
costs.
Thank You

More Related Content

PPTX
Blue foods Analysis
PPTX
Restaraunt Data Analysis using Power BI, Excel and Python
PPTX
Zomato sales Analysis Designed Presentation.pptx
PPTX
Tools and measurements to unleash trapped profitability in Hotel Revenue Mana...
PPT
Chilis Presentation
PPTX
CAPSTONE FINAL Presentation
PDF
Cooper's Hawk IMC Business Plan
PPTX
food and beverage control (4). Explain of control
Blue foods Analysis
Restaraunt Data Analysis using Power BI, Excel and Python
Zomato sales Analysis Designed Presentation.pptx
Tools and measurements to unleash trapped profitability in Hotel Revenue Mana...
Chilis Presentation
CAPSTONE FINAL Presentation
Cooper's Hawk IMC Business Plan
food and beverage control (4). Explain of control

Similar to Zomato Restaurant Analysis Project By Akash.pptx (20)

PPTX
Chapter 1. food and beverage control.pptx
DOCX
ELTU3012 HK International Airport New Restaurant Choice
PPTX
Effective Menu Engineering For Your Food & Beverage Menus
PDF
GTCR Private Equity - Buffalo Wild Wings
PDF
Catering Trends in U.S. Foodservice
PPTX
Small Business Development Project: Bplan analysis
PPTX
Htm2121 Mkt pj Group C (sem006) final
PDF
Tim Hortons Case Analysis
PPT
Bigbasket Challenges
PDF
Marketing in the M&A Process
PPT
Food and beverage management 1
PPTX
white thoughts
PPTX
My project work in White thoughts and Branding
PPTX
12. Basic Hotel's Accounting by Dino Leonandri
PPTX
12. Basic Hotel Accounting Cost Control #3 by Dino Leonandri
PPTX
Business plan entrepreneur
PDF
CHWC Presentation
PDF
Optimization Of Restaurant Management Systems PowerPoint Presentation Slides
PPTX
Restaurant Services V1.pptx
PPTX
W17 Cafe Final Deliverables
Chapter 1. food and beverage control.pptx
ELTU3012 HK International Airport New Restaurant Choice
Effective Menu Engineering For Your Food & Beverage Menus
GTCR Private Equity - Buffalo Wild Wings
Catering Trends in U.S. Foodservice
Small Business Development Project: Bplan analysis
Htm2121 Mkt pj Group C (sem006) final
Tim Hortons Case Analysis
Bigbasket Challenges
Marketing in the M&A Process
Food and beverage management 1
white thoughts
My project work in White thoughts and Branding
12. Basic Hotel's Accounting by Dino Leonandri
12. Basic Hotel Accounting Cost Control #3 by Dino Leonandri
Business plan entrepreneur
CHWC Presentation
Optimization Of Restaurant Management Systems PowerPoint Presentation Slides
Restaurant Services V1.pptx
W17 Cafe Final Deliverables
Ad

Recently uploaded (20)

PPTX
Slide gioi thieu VietinBank Quy 2 - 2025
PPTX
Board-Reporting-Package-by-Umbrex-5-23-23.pptx
PDF
Kishore Vora - Best CFO in India to watch in 2025.pdf
PDF
ANALYZING THE OPPORTUNITIES OF DIGITAL MARKETING IN BANGLADESH TO PROVIDE AN ...
PDF
Introduction to Generative Engine Optimization (GEO)
PPTX
basic introduction to research chapter 1.pptx
PPTX
TRAINNING, DEVELOPMENT AND APPRAISAL.pptx
PPTX
CTG - Business Update 2Q2025 & 6M2025.pptx
PDF
Chapter 2 - AI chatbots and prompt engineering.pdf
PPTX
Project Management_ SMART Projects Class.pptx
PPT
Lecture notes on Business Research Methods
PDF
Family Law: The Role of Communication in Mediation (www.kiu.ac.ug)
DOCX
Hand book of Entrepreneurship 4 Chapters.docx
PPTX
chapter 2 entrepreneurship full lecture ppt
PPTX
2 - Self & Personality 587689213yiuedhwejbmansbeakjrk
PDF
Nante Industrial Plug Factory: Engineering Quality for Modern Power Applications
PDF
Robin Fischer: A Visionary Leader Making a Difference in Healthcare, One Day ...
PDF
PMB 401-Identification-of-Potential-Biotechnological-Products.pdf
PDF
ICv2 White Paper - Gen Con Trade Day 2025
PDF
Ron Thomas - Top Influential Business Leaders Shaping the Modern Industry – 2025
Slide gioi thieu VietinBank Quy 2 - 2025
Board-Reporting-Package-by-Umbrex-5-23-23.pptx
Kishore Vora - Best CFO in India to watch in 2025.pdf
ANALYZING THE OPPORTUNITIES OF DIGITAL MARKETING IN BANGLADESH TO PROVIDE AN ...
Introduction to Generative Engine Optimization (GEO)
basic introduction to research chapter 1.pptx
TRAINNING, DEVELOPMENT AND APPRAISAL.pptx
CTG - Business Update 2Q2025 & 6M2025.pptx
Chapter 2 - AI chatbots and prompt engineering.pdf
Project Management_ SMART Projects Class.pptx
Lecture notes on Business Research Methods
Family Law: The Role of Communication in Mediation (www.kiu.ac.ug)
Hand book of Entrepreneurship 4 Chapters.docx
chapter 2 entrepreneurship full lecture ppt
2 - Self & Personality 587689213yiuedhwejbmansbeakjrk
Nante Industrial Plug Factory: Engineering Quality for Modern Power Applications
Robin Fischer: A Visionary Leader Making a Difference in Healthcare, One Day ...
PMB 401-Identification-of-Potential-Biotechnological-Products.pdf
ICv2 White Paper - Gen Con Trade Day 2025
Ron Thomas - Top Influential Business Leaders Shaping the Modern Industry – 2025
Ad

Zomato Restaurant Analysis Project By Akash.pptx

  • 2. INTRODUCTION Objective: Analyze Zomato restaurant data to uncover insights. Key Focus Areas: Restaurant distribution Average price analysis Customer ratings & reviews Popular cuisines City-wise trends
  • 3. DATA CLEANING & PREPROCESSING Challenges: • Data contained null values, special characters in the field, currency was not distributed as per the countries. Steps Taken: • Removed null values • Standardized currency & location data • Categorized price ranges • Removed Special Characters in the field
  • 4. OVERVIEW Dataset Overview: Number of restaurants: 9551 Number of Countries : 15 Number of Cities : 141 Number of Cuisines : 1826 Average Rating of all the restaurant ; 2.89
  • 5. OBSERVATIONS • Out of 9551 restaurants 1.73K(22.57%) restaurants provides Online Delivery whereas 5.92k(77.43%) don’t have the online delivery system • Out of 9551 restaurants 1.03K(13.64%) restaurants provides table booking whereas 6.49k(86.36%) don’t have the table booking facility For India • Out of 8652 restaurants 1.7K(25.04%) restaurants provides Online Delivery whereas 5.1k(74.96%) don’t have the online delivery system • Out of 8652 restaurants 0.98K(14.75%) restaurants provides table booking whereas 5.68k(85.25%) don’t have the table booking facility
  • 6. • Countries which don’t provide online delivery and table booking facility are : Indonesia, Canada, New Zealand, Brazil, Singapore, Sri Lanka Turkey, United States. • In the year 2018 most restaurants were opened (i.e 1102)whereas least restaurants opened in the year 2012(1022) • New Delhi has the most restaurant 5473
  • 7. Highest count at Rating 1 (2.1K restaurants) •A significant number of restaurants received the lowest rating. •This could indicate dissatisfaction, poor service, or bad food quality for a large segment. Sharp drop to nearly 0 at Rating 2 •There is almost no representation at a rating of 2. •This suggests that restaurants either receive very low or moderate-to-good ratings, skipping the middle ground. Gradual rise in Ratings 3 to 4 (around 0.5K each) • Ratings 3 and 4 have a similar number of restaurants (~500 each). •This indicates that a moderate number of restaurants are rated average to slightly above average. Slight decline toward Rating 5 •Only about 0.1K (100 restaurants) received a perfect 5-star rating. •This suggests that very few restaurants achieve the highest rating, possibly due to high customer expectations.
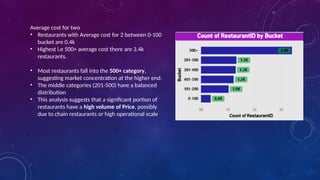
  • 8. Average cost for two • Restaurants with Average cost for 2 between 0-100 bucket are 0.4k • Highest i.e 500+ average cost there are 3.4k restaurants. • Most restaurants fall into the 500+ category, suggesting market concentration at the higher end. • The middle categories (201-500) have a balanced distribution • This analysis suggests that a significant portion of restaurants have a high volume of Price, possibly due to chain restaurants or high operational scale
  • 10. Summary •India dominates the restaurant count. •The majority of restaurants do not offer online delivery or table booking. •North Indian cuisine is the most popular. •Restaurant openings have been consistent, peaking in 2011 and 2018. •The average rating is relatively low (2.89), indicating room for improvement in customer satisfaction
  • 13. Competitor & Market Analysis for the Low rating Restaurants 🔹 Competitor Benchmarking: Compare restaurant performance (ratings, reviews, orders) against competitors. 🔹 Customer Segmentation: Identify high-value customers and repeat buyers to improve loyalty programs. 🔹 Regional Expansion Opportunities: Identify cities/countries with high potential but low restaurant penetration. Customer Behavior & Satisfaction 🔹 Customer Feedback Analysis: Identify common complaints or positive reviews to improve service. 🔹 Loyalty & Retention Metrics: Track repeat customers and analyze their average spending patterns. 🔹 Order Trends by Time of Day: Identify best-selling dishes and peak ordering times
  • 14. Restaurant Performance & Profitability 🔹 Identify Underperforming Restaurants: Compare ratings, reviews, and sales data to detect struggling locations. 🔹 Cost & Profit Analysis: Track expenses, food costs, and delivery charges to optimize pricing strategies. 🔹 Most Profitable Cuisines & Dishes: Identify high-margin cuisines and promote them accordingly. Business Growth Strategy 🔹 Franchise & Expansion Strategy: Identify high-potential cities/countries for launching new branches. 🔹 Strategic Marketing Plan: Use historical trends to optimize advertising budgets and promotions. 🔹 Delivery & Logistics Optimization: Improve delivery efficiency by analyzing delivery times and costs.