SlideShare a Scribd company logo
1
2
WHAT’S NEW
Q1 2017
Instagram and Netflix keep on growing; they
both enter top 10 apps based on reach.
Positive figures market share TV
for NPO (in particular NPO 1).
New players within traditional TV landscape
such as VICELAND and among online
streaming services (Amazon Prime).
Millennials watch 3 hours more
online video per day than 55+.
Increasing trend of cinema visitors
continues in Q1 2017.
Radio channels 3FM and BNR Nieuwsradio
lost ground in terms of gross media spend.
Blendle shapes online reading landscape
by launching monthly subscription option
Despite critical market, newspapers AD and
De Volkskrant show significant increase in
gross media spend.
Instagram has highest increase in active
users, Whatsapp and Facebook keep
growing as well.
YouTube is making progress towards people
based marketing by avoiding cookies and
pixels more.
The outdoor rights of ‘RET’ (public transport
Rotterdam) are granted to JCDecaux which
benefits their position in the OOH landscape.
3
Starcom is the Human Experience Company. At
Starcom we believe that experiences are the new
communication currency. Experiences enrich lives and
facilitate connections between brands and consumers.
To create the right experience, understanding people is
key. We need to understand our clients’ target
audiences throughout the whole marketing funnel.
Within this funnel, consumer media behavior plays a
very important role. That’s why we no longer divide the
media landscape based on media types, but on how
people experience media.
As such, we differentiate between five key Media
Consumption Patterns (MCPs): Watching, Listening,
Reading, Communicating and On the Go. Based on
these MCPs we will guide you through the Dutch media
landscape. We hope you will enjoy it.
MEDIA
PHILOSOPHY
4
In The Netherlands Starcom is part of Publicis
One. Publicis One is a house of brands consisting
of twelve labels in media, creative, technology,
data & production.
We work together in multidisciplinary teams and
from one P & L. Customers have access to all our
specialized labels, expertise and tools, and we
provide them with the best integrated brand, media
and (digital) communications solutions at local and
international level. This will result in higher quality,
speed and costs for our customers.
5
6
Watching
Listening
Reading
Communicating, Social Media,
Surfing online
Overall media and consumer
stats & figures
On the go
Appendix
The Netherlands: general
stats & figures
CONTENT
7
THE NETHERLANDS
general stats & figures
8
Dutch population is still growing and getting older. The number of
households has grown with 8% since 2006, mostly due to the
increasing number of single person households (+16%).
2.502 2,906
4.644 4,815
2,26
2,17
1,0
1,3
1,6
1,9
2,2
2,5
0
2.000
4.000
6.000
8.000
2006 2007 2008 2009 2010 2011 2012 2013 2014 2015 2016
Averageno.peopleinHH
#HH(in‘000s)
Household (HH) size
Single person household Multiple person household Average no. of people in HH
Source: CBS, Statline, 2016.
16.334
16.979
16.000
16.200
16.400
16.600
16.800
17.000
17.200
Duizenden
Population (in ‘000)
39,2
41.5
38
39
40
41
42
Average age
28,3
29,0 29,4
30,6
32,6 33,1 33,3 33,2 33,3 33,3 33,6
34,2 34,1
25
30
35
2003 2004 2005 2006 2007 2008 2009 2010 2011 2012 2013 2014 2015
€(in‘000s)
Annual disposable HH income
9
In 2017 Q1 the Dutch consumer confidence index increased to 124,
which is the highest level in at least 10 years and indicates optimism.
Source: CBS, Statline, 2016 Source: Nielsen Consumer Confidence, Q4 2016
Consumer confidence worldwide – Q4 2016
-50
-40
-30
-20
-10
0
10
20
30
2008Jan
2008Apr
2008Jul
2008Oct
2009Jan
2009Apr
2009Jul
2009Oct
2010Jan
2010Apr
2010Jul
2010Oct
2011Jan
2011Apr
2011Jul
2011Oct
2012Jan
2012Apr
2012Jul
2012Oct
2013Jan
2013Apr
2013Jul
2013Oct
2014Jan
2014Apr
2014Jul
2014Oct
2015Jan
2015Apr
2015Jul
2015Okt
2016Jan
2016Apr
2016Jul
2016Okt
2017Jan
Difference%positivevsnegativeanswers
Dutch consumer confidence
10
Unemployment has dropped between 2014 and 2016 but that trend is,
just like purchasing power, expected to come to a halt in 2017.
Key Economic Indicators NL 2011 2012 2013 2014 2015 2016 2017**
Inflation 2.3% 2.5% 2.6% 0.3% 0.2% 0.1% 0.9%
Economic growth 1.2% -1.7% -0.5% 1.0% 2.0% 1.7% 1,6%
Purchasing power* -1.0% -1.9% -1.3% 1.3% 1.1% 2.7% 0.7%
Unemployed (in ‘000s) 389 469 647 660 614 555 560
Unemployment % 5.4% 5.3% 7.3% 7.4% 6.9% 6.2% 6.2%
Source: CPB, Kerngegevenstabel 2012- 2015 and 2014-2017, August 9th 2016 (* median for all households; ** estimated figures)
11
OVERALL
media and consumer
stats & figures
12
Everything is SoLoMo nowadays
Social
Social media connects people
worldwide with events,
activities and each other
Local
Increasing ability for brands
and organizations to respond
to people’s whereabouts and
out-of-home activities
Mobile
Mobile technology makes it
possible to reach people
anywhere, anytime
Source: SMG Human Experience Strategists Center
13
TRENDS
14
10 global trends for consumers in 2017
Ageing: A changing narrative
In 2017, almost a quarter of everyone on the planet will be over the age
of 50, a record. These consumers will be older in terms of lifestyle and
are more demanding in their consumptions needs (Longevity Economy).
Consumers in training
Today’s family demands are launching youngsters into consumption at
an earlier stage. Increasingly, the input of children in purchasing
decisions is welcomed by their parents, rather than being perceived as a
nuisance.
Extraordinary
We have reached a point when mass-produced items have lost some of
their shine. The internet is enabling consumers to purchase and discuss
the “long tail” – unique, customized and exotic products and services.
Faster shopping
In 2017, consumers are impatient. The digital world has schooled more
of them into becoming so-called “IWWIWWWI”: “I want what I want when
I want it”.
Get real: The allure of authenticity
Authenticity is a standout consumer value in 2017, heralded by everyone from
change makers and celebrities to supermarkets and chefs.
Identity in flux
The nature of identity itself is in flux with a more elastic understanding of
ethnicity and gender. Brands need to rethink who their audiences really are.
Personalize it
In 2017, we will have come to accept the idea that an industrially-produced
product can be customized or personalized, at least in part.
Post-purchase
In 2017, shoppers will be paying more attention to their post-purchase
experience, becoming a more important part of the consumer journey.
Privacy and security
In our volatile world there is more focus is on personal safety and that of loved
ones which results in greater leaning towards home and mobile cocooning.
Wellness as status symbol
The desire to be fit and healthier seems to be almost universal. Healthy living is
becoming a status symbol, as more consumers opt to flaunt their passion for it.
Source: Euromonitor International Top 10 Global Consumer Trends for 2017.
15
10 digital trends to watch in 2017: I
Artificial
Intelligence will not
(yet) put marketers
out of work
Internet users still
will not change their
behaviors despite
hacking scares
Sometime in 2017,
a live video will win
a primetime-sized
audience
Chatbots are
upcoming but will
not yet become the
reality
2017 will be the
year of authetically
mobile experiences
Source: eMarketer Key Digital Trends for 2017, Dec 2016
Artificial Intelligence Privacy Live video Chatbot Mobile
16
10 digital trends to watch in 2017: II
Online grocery
shopping will jump
in 2017
Marketers will make
the move to more
complex forms of
attribution modeling
2017 will be the
tipping point for
mobile messaging
apps
Influencers will
take a significant
chunk of the ad
market in 2017
VR will not be a
significant marketing
channel until
hardware becomes
more widespread
Source: eMarketer Key Digital Trends for 2017, Dec 2016
Online food shopping Modeling analysis Mobile messaging Influencers Virtual Reality
17
5 mobile trends for 2017
VR technology
transforms everyday
interactions and
offers brands a more
personal customer
service channel
Image recognition
creates seamless
shopping and
opportunities for
personalization
With the use of
chatbots, people
move to non-
human interaction
for simple tasks
Robots enter the
consumer journey
and can help
brands by providing
services
Companies are
turning focus toward
Generation Z using
mobile behavior
patterns to design
relevant services
Source: MWC Mobile Trends 2017
Virtual Reality Image recognition Chatbots Robots Generation Z
18
Four important Entertainment & Media shifts which will determine the
future of the Dutch media landscape
Companies are transforming
their business models and
redefining their position in a
changing landscape. These
innovations are reflected in a
further increase of digital
Entertainment & Media spend,
and a decrease in non-digital
spend.
The way media is consumed
and is expected to develop
differs crucially between age
groups; e.g. born before/ after
1964. The younger audience
will focus even more on digital
media whereas the older
audience will continue to spend
most time and money on
traditional media.
Also in the Netherlands, digital
giants like Google, Facebook
and Apple are leading in the
digital landscape. In order to
survive in media it requires:
owning a unique asset,
providing a niche offering or
fully embracing the change
created by these giants.
Shift 1
Business models
Shift 2
Demographics
Shift 3
Competition
The growth of the Internet
provides consumers with more
options than ever. The
willingness to shop online will
continue to change how people
spend their time and how
companies make money.
Shift 4
Consuming media
Source: PWC Entertainment & Media Outlook forecast for The Netherlands 2016-2020
19
Media spend
MEDIA SPEND
20
Competitive reporting in the Netherlands
Competitive reporting is based on gross media spend.
Bear in mind that most advertisers profit from (heavy)
discounting, especially on TV, so the difference with actual
spend can be significant.
In the gross spend reporting digital spend is not fully
reported. For example, search, social media advertising
and video are (partially) excluded.
Source: Gross spend: Nielsen, 2016 | Net spend: Nielsen jaarrapport Netto Media Bestedingen 2016 | Note: For digital only net spend is available.
0
1.000
2.000
3.000
4.000
Cinema Newspapers Online Out Of Home Magazines Radio TV
€millions
Media spend 2016
Gross Net
21
Decrease in gross media spend between 2016 and 2015 (excluding
digital spend). Stable spend level in 2017 Q1.
0
1.000
2.000
3.000
4.000
5.000
6.000
7.000
8.000
€millions
Gross media spends
Source: Nielsen, 2012 – 2017 Q1 | Note: digital spend not included.
+3,1 % YoY
+4,9% YoY -1,1% YoY
-5,3% YoY
-0,3% YoY
22
After a substantial decline for newspaper spend between 2015 and
2016, spend levels seem to stabilize in Q1 2017.
0
1.000
2.000
3.000
4.000
Cinema Newspapers Direct Mail Door Drops Out Of Home Consumer
Magazines
Radio TV Trade Press
€millions
Gross media spend per medium type across time
2013 2014 2015 2016 2016 Q1 2017 Q1
Source: Nielsen, 2012 – 2017 Q1 | Note: digital spend not included.
23
In contrast to the last few years, in Q1 2017 share of spend of
newspapers has increased and share of spend for TV has decreased.
Source: Nielsen, 2012-2017 Q1 | *Note: digital spend is not included.
18% 17% 16% 16%
11% 13% 15%
7% 7% 6% 4%
3% 4%
5%
2% 2%
2% 2%
2%
2%
2%
7% 7%
7%
7%
7%
8%
8%
7% 7%
6%
6%
6%
5%
6%
9% 10%
10%
11%
12% 12%
12%
48% 48% 52% 53% 57% 55% 52%
1% 1% 1% 1% 1% 1% 1%
0%
10%
20%
30%
40%
50%
60%
70%
80%
90%
100%
2012 2013 2014 2015 2016 2016 Q1 2017 Q1
Media mix
Trade Press
TV
Radio
Consumer Magazines
Out Of Home
Door Drops
Direct Mail
Newspapers
Cinema
24
2% growth for total net spend in 2016 compared to 2015. Share of
digital spends has increased at the expanse of print media.
Source: Nielsen Jaarraport Netto Media Bestedingen 2016
26%
35%
17%
4%
4%
14%
26%
32%
19%
4%
4%
14%
Audiovisual media Internet
Print media Out of home
Direct marketing Sponsoring
2015
€ 4,621,000,000
2016
€ 4,686,000,000
25
Spend of online advertising increased by 11% in revenue in 2016
41%
14%
45%
Display
Classifieds
Search
Total online ad spend
52%
16%
18%
14% Embedded
Other & text links
Video
Interruptive
Online display spend
Source: Deloitte & IAB. Nederland, IAB Report on Online Advertising Spend, The Netherlands 2016, December 2016
2016: 1,683 m€
2015: 1,512 m€
2016: 683 m€
2015: 615 m€
26
0%
5%
10%
15%
20%
25%
30%
35%
40%
45%
50%
0
20
40
60
80
100
120
140
2013-HY1 2013-HY2 2014-HY1 2014-HY2 2015-HY1 2015-HY2 2016-HY1 2016-HY2
Y/YRevenuegrowth(%)
Displayadvertisingthroughprogrammatic
channels(m€)
Trends of programmatic spend
Display advertising through programmatic channels (m€) Y/Y revenue growth (%)
Real Time Bidding (RTB) is an
online auction for advertising
space. Programmatic Trading
(PT) makes it possible to better
monitor where, when and to whom
your ads are digitally served.
Source: Deloitte & IAB. Nederland, IAB Report on Online Advertising Spend, The Netherlands 2016, April 2017
Display advertising through programmatic channels increased by
20% in 2016, totalling 225m€ in revenue.
27
11% 13% 16% 16%
18% 17% 16% 18%
17% 15% 13% 14%
54% 55% 55% 52%
2013 2014 2015 2016
Allocation of display revenue per format
Video Text links/Other Interruptive Embedded (e.g. banners)
Video and rich media formats show growth over the last years. Share
of spend of banners slightly decreased but remains popular.
Source: Deloitte & IAB. Nederland, IAB Report on Online Advertising Spend, The Netherlands 2016, April 2017
28
Growth in total net media spend will mainly be a result of a significant
rise in online spend. Print spend is expected to further decrease.
3.967
3.770
3.649
3.730
3.773
3.821
3.877
3.959
3.400
3.600
3.800
4.000
2011 2012 2013 2014 2015 2016 2017 2018
€millions
Forecast net spend
0,8%
-5,0%
-3,2%
2,2%
1,2% 1,3% 1,5%
2,1%
-6%
-3%
0%
3%
6%
Forecast net spend
Change (%) to previous year
-
500
1.000
1.500
2.000
2.500
Newspapers Magazines TV Radio Cinema Outdoor Internet
€millions
Net spend per medium type
2011
2012
2013
2014
2015
2016
2017
2018
Source: ZOG Adspend Forecast Netherlands – December 2016 (1980-2018)
29
Top 10 advertisers in Q1 2017 is dominated by FMCG and retail
Source: Nielsen, Q1 2017 | Note: gross online spend not included
No. Advertiser Category
Gross spend
Q1 2017
1 Unilever Nederland Rotterdam FMCG €24,479,789
2 Procter & Gamble Nederland Rotterdam FMCG €22,901,254
3 Corendon International Travel Travel €21,192,478
4 Renault Nederland Schiphol-Rijk Automotive €20,725,256
5 A.S. Watson Europe FMCG €20,004,224
6 Vodafone Maastricht Telecom €16,380,283
7 Lidl Nederland Huizen Retail €14,591,494
8 Albert Heijn Zaandam Retail €14,278,302
9 Jumbo Supermarkten Veghel Retail €14,094,758
10 Reckitt Benckiser Nederland Hoofddorp FMCG €12,991,361
30
Top 10 brands in Q1 2017 is dominated by supermarket chains
Source: Nielsen, Q1 2017 | Note: gross online spend not included.
No. Brand Category Gross spend
Q1 2017
1 Corendon Travel €19,492,146
2 Kruidvat Retail €17,937,905
3 Lidl Retail €14,591,494
4 Jumbo supermarkten Retail €14,094,758
5 Albert Heijn Retail €13,998,700
6 Renault Automotive €12,668,859
7 Vodafone Telecom €10,302,059
8 Nationale postcode loterij Lottery €10,078,202
9 KPN Telecom €10,026,471
10 Vriendenloterij Lottery €8,997,199
31
Total sponsor spend and average sponsor spend slightly decreased
Total spend top 100 sponsors 2015 2016 Index
Total sponsor spend €283,775,000 €274,255,000 97
Average sponsor spend (per brand) €2,837,750 €2,742,550 97
-
100
200
300
400
500
600
Sports Art & Culture Lifestyle Society Media (non-spot)
€millions
Sponsor spend by type of sponsorship
2010 2011 2012 2013 2014 2015 2016
Source: SponsorMonitor 2016 (Spend is an estimate based on input provided by advertisers. Only direct sponsor budget is included; any activation budget is excluded.)
32
56%
14%
2%
10%
18%
Sponsor contracts
Sports Art & Culture Lifestyle Society Media (non-spot)
In 2016, 283 new (and renewed) sponsorship contracts were signed.
This implies a decrease of 42 contracts compared to 2015.
The total value of all contracts in 2016 was
€230,000,000, averaging €812,720 per contract*.
Both the total and the average increased substantially
compared to 2015 (total: €154.000.000; average:
€474.000 ).
Reasons for this increase are big sponsor contracts of
Energie direct with football club PSV and the ING
Sponsorship with the Royal Dutch Football Association.
Source: SponsorMonitor 2016, 2017 (Estimated spend based on input provided by advertisers. Only direct sponsor budget is included; any activation budget is excluded). | Note: The value of contracts
differs from the annual sponsorship spend shown on other slides. This can be explained by contracts covering longer periods than just one calendar year.
33
Rabobank is still by far the biggest sponsor. ING, Adidas and Ziggo
showed increase in gross sponsor spend.
No. Brand Gross spend 2015 Gross spend 2016
1 Rabobank € 34,000,000 € 32,000,000
2 ING € 14,000,000 € 14,500,000
3 Adidas € 13,450,000 € 14,000,000
4 ABN AMRO € 13,000,000 € 12,500,000
5 KPN € 12,700,000 € 12,500,000
6 Heineken € 11,200,000 € 11,000,000
7 Nike € 11,000,000 € 11,000,000
8 Ziggo € 9,800,000 € 11,000,000
9 VriendenLoterij € 9,600,000 € 8,500,000
10 Amstel € 8,500,000 € 7,500,000
Source: SponsorMonitor 2016 (Spend is an estimate based on input provided by advertisers. Only direct sponsor budget is included; any activation budget is excluded)
34
Time spend
TIME SPEND
35
Dutch consumers spend more than 3 hours per day on media*
2:29
0:14
1:01
2:01
4:10
2:26
3:08
8:28
2:25
0:12
0:52
2:07
0:57
4:18
3:36
9:29
0:00 1:12 2:24 3:36 4:48 6:00 7:12 8:24 9:36 10:48 12:00
Eating and personal care
Other
On the go
Housework, groceries, shopping
Work, study, school
Leisure time
Media*
Sleeping
Hours per day
Main activities – average time spent per day
Weekend Weekdays
Source: Media:tijd 2015, base: all adults 13+ (N=2,953) | * media consumption not combined with any other activity
36
Watching and listening are most time consuming media activities
2:42
3:04
0:43
1:06
0:18 0:18 0:20
Listening (online or
offline)
Watching (online or
offline)
Reading (paper or
electronic)
Communicating
(through media)
Gaming (electronic) Internet other Media other
Media activities – average time spent per day
Hours per day
Source: Media:tijd 2015, base: all adults 13+ (N=2,953)
Definitions:
Listening: to radio, (own) music/audio – offline, online or apps + live or non-linear
Watching: TV programs, videos or pictures - offline, online or apps + live or non-linear
Reading: books, magazines, newspapers, door drops, newsletters – offline, online or apps
Communicating: text messages, chat, e-mail, social media, forums, letters – offline, online or apps
Gaming: consoles or game websites - offline, online or apps – except for board games and gambling
Internet (other): online shopping, e-banking, search information – offline, online or apps
Media (other): administration on computer, installation and use of software
37
Overall media consumption shows stable patterns. Time spent watching
shows strong peak in the evening, for listening this is higher during the day.
0
10
20
30
40
Minutes
Media activities on an average day
Listening (online or offline) Watching (online or offline) Reading (paper or electronic)
Communicating (through media) Gaming (electronic) Internet other
Media other
Source: Media:tijd 2015, base: all adults 13+ (N=2,953)
38
0%
25%
50%
75%
100%
2010
2011
2012
2013
2014
2015
2015-II2016-I
Honderden
TV
No answer
TV heavy (24+
hours per week)
TV mid (14-24
hours per week)
TV light (0-14
hours per week)
No TV
0%
25%
50%
75%
100%
2010
2011
2012
2013
2014
2015
2015-II2016-I
Honderden
Radio
No answer
No answer
Radio heavy (20+
hours per week)
Radio mid (5-20
hours per week)
Radio light (0-5
hours per week)
No Radio
Time spent online has increased over the years
0%
25%
50%
75%
100%
2010
2011
2012
2013
2014
2015
2015-II2016-I
Honderden
Online
No answer
Internet heavy
(13+ hours per
week)
Internet mid (5-13
hours per week)
Internet light (0-4
hours per week)
No Internet
connection
Source: NPDM releases: 2010 I – 2010 II to 2015 II – 2016 I, base: All adults 13+ (N= 17.171)
39
DEVICE OWNERSHIP AND USAGE
40
Slightly higher smartphone penetration (83%) in 2016
39%
45%
48%
58%
65% 67%
70%
76%
80% 80% 83%
0%
20%
40%
60%
80%
100%
Historical development of smartphone penetration in NL
11.1
million
Smartphone
users in 2016
Source: “Trends in Digital Media”, GfK Intomart, Dec 2016, base: online population 13+ (N=1,251); Global Mobile Landscape 2015, eMarketer.
13.9
million
Smartphone
users in 2019
41
All age groups are becoming more mobile over the years. Significant
increase of tablet usage among age group 13-17.
0%
25%
50%
75%
100%
Men
Women
Age 13-17
Age 18-34Age 35-49
Age 50-64
Age 65+
% using a tablet
0%
25%
50%
75%
100%
Men
Women
Age 13-34
Age 35-49
Age 50-64
Age 65+
% using a smartphone dec-12
jun-13
dec-13
jun-14
dec-14
jun-15
dec-15
dec-16
Source: “Trends in Digital Media”, GfK Intomart, Dec 2016, base: online population 13+ (N=1,150)
42
0
1
2
3
4
5
6
7
8
9
10
11
12
13
14
15
Averagetimespentinminutes
Smartphone and tablet usage during the day
Smartphone '15 Tablet '15 Smartphone '14 Tablet '14
Tablet and mobile show a similar pattern in usage during the day, with a
peak in the evening. Time spent on both devices increased significantly.
Source: Media:tijd 2014, base: 13+ (N=2,989) | Media:tijd 2015, base: 13+ (N=2,953)
43
Watching TV still most popular via traditional TV set despite growing
popularity of other devices. Smartphone beats laptop for using the Internet.71,3%
23,8%
28,1%
17,0%
9,1%
54,0%
10,7%
28,1%
17,0%
8,7%
74,8%
16,1%
29,0%
14,8%
14,1%
56,6%
23,0%
21,1%
12,5%
6,8%
91,5%
21,1%
3,6%
0,9%
2,6%
11,1%
2,6%
72,5%
74,9%
Medium type per device
Laptop
PC/desktop
Mobile phone
Tablet
Traditional TV set*
Media player*
Game console*
Paper*
Source: Media Standard Survey 2016 (N=5,100), Base: All adults 13+, (* device is not relevant for each medium type)
44
Digital stats
DIGITAL STATS
45
Percentage of Dutch population owning phones and tablets is growing
strongly, just like social usage. The number of Newspaper readers decreased.
0%
20%
40%
60%
80%
100%
Broadcast
TV viewers
Mobile
phone
owners
Internet
users
Radio
listeners
Magazine
readers
Smartphone
owners
Social
network
users
Mobile
phone
internet
users
Tablet
owners
Newspaper
readers
Digital video
viewers
Cable TV
viewers
Media penetration in the Netherlands, 2011 - 2015
2011 2012 2013 2014 2015
Source: The global media intelligence report (November 2016) – eMarketer & SMG
46
The Netherlands has the 9th highest internet penetration worldwide.
Mainly wealthy and/or relatively small countries in top 20.
80%
90%
100%
Internet access by country (top 20) in 2016
Source: http://www.internetlivestats.com/internet-users-by-country/, penetration based on total population | https://www.emerce.nl/nieuws/75plussers-sterkst-groeiende-groep-internetters
In the Netherlands, Internet penetration
among people older than 75 has grown
substantially. In 2016, 60% of 75+ has
Internet access and 50% used it. In
2012, access and usage was around
40% for this specific age group.
47
90%
44%
25%
92%
45%
32%
93%
45%
40%
94%
46%
49%
95%
48%
55%
95%
50,70%
59,80%
At home At work Elsewhere
Internet access by location
2011 2012 2013 2014 2015 2016
Internet access ‘elsewhere’ (on the go) has increased substantially
Source: Media Standard Survey 2011-2016 (N= 5,100), base: All adults 13+.
48
Google is leading in terms of reach across platforms
Source: GfK DAM, base: 13+, average monthly reach Q1 2017 (all platforms)
No. Top 10 brands Average monthly reach
1 Google 77%
2 Facebook 67%
3 WhatsApp Messenger 63%
4 Youtube 60%
5 Facebook Messenger 51%
6 Google maps 51%
7 Google Search (app) 49%
8 Bol.com 47%
9 Digid.nl 43%
10 Marktplaats.nl 42%
49
Main mobile activities are focused on communication in every
possible way. Banking, online shopping and TV increased in usage.
83%
76%
29%
14%
22%
37%
43%
16%
70%
5%52%
67%
26%
83%
65%
27%
72%
Mobile activities
Internet E-mail
Video TV
Radio Navigation
Games As e-ticket
Camera Books
Online banking Social media
Online shopping Call
Text messages Music
Chat
Source: “Trends in Digital Media”, GfK Intomart, Dec 2016, base: online population 13+ (N=1,065)
50
All-round activities for tablet such as surfing the web, e-mail, social
media and games. Less visual activities (photos, video) than on mobile.
29%
32%
3%
58%
13%
34%
36%
8%
15%
85%
55%
66%
13%
29%
4%16%
4%
Tablet activities
Video TV
Text messages Social media
Radio Online shopping
Online banking Navigation
Music Internet
Games E-mail
Chat Camera
Call Books
As e-ticket
Source: “Trends in Digital Media”, GfK Intomart, Dec 2016, base: online population 13+ (N=824)
51
Smartphone is the most used device for communication, especially
among younger age groups.
7%
7%
19%
19%
48%
1%
Share of all communication per device
Landline/home phone
Tablet
Laptop
PC
Smartphone
Other
0%
20%
40%
60%
Total 13+ Men Women 13-19 20-34 35-49 50-64 65+
Share of communication per device per age group
Landline/home phone Smartphone Tablet Laptop PC
Source: Media:tijd 2015, base: all adults 13+ (N=2,953)
52
0
10
20
30
40
50
Smartphone
Average number of mobile apps
2011 2012 2013 2014 2015 2016
In 2016, also the number of mobile apps seems to stabilize
Average # of apps on
mobile in 2016: 27
Source: “Trends in Digital Media”, GfK Intomart, Dec 2016, base: online population 13+ (N=1,065)
0
10
20
30
40
50
Tablet
Average number of tablet apps
2011 2012 2013 2014 2015 2016
Average # of apps on
tablet in 2016: 24
53
WhatsApp most popular mobile app. Facebook and YouTube show high
reach on both devices. Netflix and Instagram are new in top 10.
Source: GfK DAM, base: 13+, average monthly reach Q1 2017
25%
26%
27%
29%
38%
41%
42%
55%
50%
63%
Instagram
Drive
Google Play-services
Gmail
Google Search
Facebook Messenger
Google Maps
Youtube
Facebook
WhatsApp Messenger
Overall top smartphone apps
Phone reach %
11%
11%
11%
12%
16%
18%
20%
21%
32%
35%
ING Bankieren
NOS
Netflix
Marktplaats
Gmail
Google Maps
Facebook Messenger
Google Search
YouTube
Facebook
Overall top tablet apps
Tablet reach %
54
WATCHING
55
MCP: Watching
The way people consume audio visual content
is rapidly changing. These days the consumption
of video content can be on multiple devices, in
multiple places and at every moment. As a result,
the way consumers experience video content is
changing as well.
56
88%
Households
with digital TV
1.6
Average # of TVs
per household
36.8%
Hard disc recorder
ownership 2015
31%
37%
Connected TV
penetration
2015 vs. 2016
Source: Media Standard Survey 2016
Trends & developments – I
57Source: SKO 2012 – 2017 Q1, TA: +6, Linear TV is all the direct watching (exclusive recorded TV programs that are watched on the same day)
Average linear viewing time per day in
2017 Q1 is 166 minutes (vs. 177
minutes in 2016 Q1). There’s a drop
(6.2%) in linear TV consumption.
Watching linear TV is still the norm, but
catch-up TV is gaining ground with an
average viewing time of 30 minutes per
day in 2017 Q1, which is equivalent to
more than 15% of total viewing time.
178 175 178
168
160
177
166
11 11 11
11
10
12
12
3 4
5
6
7
8
9
4 5
5
6
6
7
7
1
1
2
2
0
20
40
60
80
100
120
140
160
180
200
220
2012 2013 2014 2015 2016 2016 Q1 2017 Q1
Dutchviewingtime(perday)
Linear TV
Video, DVD & HDR
Non-linear viewing
(same day)
Non-linear viewing
(one week)
Non-linear viewing
(28 days)
196
Trends & developments – II
196 195 199 192 184 206
58
Trends & developments – III
RTL and Triade Media extend their
portfolio with three international
channels: AMC, Food Network and
Fine Living. AMC offers many popular
movies and TV shows from all genres
and has own productions. Food
Network focuses on cooking shows and
Fine Living offers programs about
home decoration and interior design.
Online publisher VICE has started a
new TV-channel for millennials:
VICELAND. The new TV-channel
launched March 1st and is exclusively
accessible for Ziggo subscribers.
Benelux-CEO Thijs Boon states that
VICELAND offers exclusive content
with a focus on youth culture and
hereby wants to become the place to
reach millennials offline.
Source: http://www.emerce.nl/nieuws/uitgesteld-kijken-naar-25-procent-in-2025 | http://www.adformatie.nl/nieuws/vice-komt-nederland-met-tv-kanaal-voor-millennials | http://www.adformatie.nl/achtergrond/vice-
benelux-ceo-thijs-boon-viceland-moet-het-leidende-tv-kanaal-voor-jongeren-worden | | https://www.rtl.nl/adverterenbij/nieuwsberichten/rtl-en-triade-media-breiden-portfolio-uit
According to research of ABN Amro,
postponed TV-watching is winning
popularity. It is expected that 25% of all
TV content will be consumed non-linear
within the next 10 years.
59
Consumers will be exposed to more advertising on smart TV’s of
Philips. After Philips updates the software consumers will see more
ads in the menu’s.
TP Vision, the manufacturer of Philips TV’s, has a lot of information
about viewing behavior. In the near future, Philips will possibly be
capable of personalized advertising. More brands (such as Samsung)
are currently working on this development since watching linear TV is
decreasing and people are using more apps and online services.
The number of house holds with smart TV’s is still increasing
but the growth seems to flatten out, reports Telecompaper.
With smart TV’s people have the ability to connect to the
Internet to make use of services as Netflix and YouTube and
new services like Amazon Prime. Not every smart-TV is
connected to Internet, but at this moment more than 50% of all
house holds has at least one ‘connected’ television.
https://www.emerce.nl/nieuws/aantal-huishoudens-smart-tv-stijgt-groei-neemt-af | http://nos.nl/artikel/2154753-meer-reclame-op-smart-tv-s-van-philips.html
Trends & developments – IV : Smart TV
60
Dutch TV channels, with advertising possibilities (I/II)
STER (Public Broadcasting)
RTL
RTL/Triade
SBS
Source: retriever.nl, Q1 2017 | Note: As of January 2016 RTL is also responsible for the advertising on the Triade channels.
Note: RTL Lounge, RTL Crime, Boomerang, Telekids and Crime + Investigation are paid (digital) channels
Note: mostly paid (digital) channels
61
Dutch TV channels, with advertising possibilities (II/II)
The Walt Disney Company Benelux
57 regional channels
Note: Disney XD shares a channel with Veronica
Source: retriever.nl, Q1 2017
62
Market share of NPO is increasing. In Q1 2017, SBS and BrandDeli
seem to show a slight decrease in market share.
0%
10%
20%
30%
40%
NPO RTL/Triade SBS BrandDeli
TV market share
2014 2015 2016 2017 Q1
Source: SKO 2014 – 2017 Q1, 02.00-26.00, base: all adults 13+| Note: Full audit channels only.
63
NPO 1 continues trend of increase in market share
Source: SKO 2014 – 2017 Q1, 02.00-26.00 base: all adults 13+ | Note: Full audit channels only.
STER RTL/Triade SBS BrandDeli Disney Other
0
5
10
15
20
25
30
%
Market share
2014 2015 2016 2017 Q1
64
Growth in gross media spend for all SBS channels (+11%). RTL 4
shows strongest decline.
Source: Nielsen, 2016 Q1 and 2017 Q1. | Note: Only gross spend for TV. | Note: As of January 2016 RTL is also responsible for the advertising on the Triade channels.
SBSRTLSTER BrandDeli RTL/Triade Disney
0
50
100
150
200
250
€millions
Gross media spend per channel
Q1 2016 Q1 2017
- 10%
65
TV spend shows a clear seasonality pattern with highest spend levels in
spring and fall and relatively low spend during summer. Monthly indices
are used to reflect the seasonality in rate cards.
Source: Nielsen, 2013 – 2017 Q1 | Note: Only gross spend for TV.
0
100
200
300
400
500
January February March April May June July August September October November December
Grossmediaspend(inmillion€)
TV seasonality (based on spend)
2013 2014 2015 2016 2017 Q1
Total spend 2017 Q1: € 776,092,821
Total spend 2016 Q1: € 774,534,884
Total spend 2015 Q1: € 727,121,996
Total spend 2014 Q1: € 732,229,310
Total spend 2013 Q1: € 621,144,126
66
Retail brands (supermarkets specifically) are main TV advertisers
Source: Nielsen, 2017 Q1 | Note: Only gross spend for TV.
No. Brand Category TV gross spend
Q1 2017
1 Jumbo supermarkten Retail €12,805,780
2 Kruidvat Retail €10,327,439
3 Albert Heijn Retail €10,140,184
4 Lidl Retail €8,817,451
5 Coop Retail €8,087,164
6 Renault Automotive €7,898,370
7 Corendon Travel €7,005,157
8 Omega Pharma FMCG €6,249,780
9 HG FMCG €6,207,113
10 Plus Retail €6,144,100
67
The market for young females is more saturated than for young males
Source: SKO, 2017 Q1, all day (02:00 – 26:00), base: all adults 13+
Female
68
Multi-tasking on phone while watching TV is becoming more popular
and consists mainly of social media, chatting, emails and games
0%
10%
20%
30%
40%
50%
60%
Desktop
PC
e-Reader Laptop PC Mobile
phone
Tablet
device
None of
the above
Multi tasking while watching TV
Q1 2016 Q2 2016 Q3 2016 Q4 2016 Q1 2017
0%
10%
20%
30%
40%
50%
Multi tasking activities
Q1 2016 Q2 2016 Q3 2016 Q4 2016 Q1 2017
Source: GlobalWebIndex, 2016-2017 Q1, Base: Internet users NL16+
69
Multitasker is mostly 16-34 years old with average to high income
and rather interested in gadgets, fashion and sports
51% 49%
24% 22% 21% 21% 13%
0
50
100
150
0%
25%
50%
% Index
Source: GlobalWebIndex, 2017 Q1, Base: Internet Users NL16+ (N= 1300), TA: MultiTasker while watching TV (N=365)
23%
51%
26% Low (Bottom 25% income)
(index 92)
Mid (Mid 50% income)
(index 101)
High (Top 25% income)
(index 107)
Interests
0
50
100
150
0%
10%
20%
30%
40%
50%
60%
% Agree Index
Age groups
Interests
Income
70
VIDEO ON DEMAND
71
Two options for non-linear TV viewing:
On TV screen (smart TV, settopbox, video or DVD recorder)
Non-linear TV viewing within 6 days of programming is added to the regular TV
viewing ratings.
Online (laptop/tablet/mobile)
VIDEO ON DEMAND
Non-linear TV-viewing
(broadcast by traditional broadcasters, i.e. RTL, SBS and STER)
Paid professional content via non-traditional broadcasters
(i.e. Netflix, Videoland)
‘Video on demand’ definition clarified
Non-paid (user-generated/professional/branded) content
(i.e. YouTube, Dumpert, LINDA.tv)
72
Trends & developments- I
49% of all Dutch
consumers watch
paid online
video content
69% of all consumers
have a payed VoD
subscription
14% have two subscriptions
17% have two or more
39% of all VoD
subscribers have
downgraded their
linear TV subscription
For consumers without a VoD
subscription this is 15%
Source: GfK Viewscape 2017, base: NL18+
73
Trends & developments – II
STER starts a trial of
programmatic buying on ‘NPO
Gemist’ with technology of
SpotX. When watching NPO
Gemist, people will be exposed
to more relevant ads, matched
to their own consumer profile.
YouTube Red, a new, paid
streaming service of YouTube
will be launched in Europe in
2017. YouTube Red shows
videos without advertising and
has unique content, just like
competitors Netflix and Amazon.
It is not yet confirmed that/when
YouTube Red will be launched
in the Benelux.
Netflix grew in 2016 to 94
million subscribers and to 2,4
billion dollar revenue worldwide.
The biggest growth originates
from outside the US. In the
Netherlands, Netflix reaches
more than 28% of all house
holds. However, 41% quit Netflix
after the free trial.
Source: http:// http://www.emerce.nl/nieuws/ster-tekent-spotx-programmatic-videocampagnes | http://www.emerce.nl/nieuws/youtube-red-europa | https://www.emerce.nl/nieuws/resultate-netflix-beter-dan-
verwacht I https://tweakers.net/nieuws/118993/amazon-maakt-prime-video-dienst-beschikbaar-in-nederland-en-belgie.html
Amazon launched its new video
streaming service: Amazon Prime.
From December 2016 on, the
service is available in the
Netherlands. Amazon offers
movies and TV-shows, including
exclusive content. A subscription
costs 6 euro p/month, the first half
year 3 euro p/month.
74
Trends & Developments - III : Streaming services with opportunity
to watch content offline
Videoland is planning to offer content offline. At the
end of 2016 it is already possible to watch children’s
programs offline. In 2017 more content will be
available to watch without an Internet connection.
Videoland is a streaming service of RTL and offers
national and international movies and TV shows.
Netflix seems to be following the trend of music
streaming services to let subscribers consume content
offline. Currently it is only possible to watch Netflix-
original content offline. Netflix is dependent on
responsible film companies in order to offer more
content in the offline version.
Source: http://www.emerce.nl/nieuws/videoland-maakt-offline-kijken-kinderfilms-series-mogelijk | http://www.metronieuws.nl/xl/digitaal/2016/06/netflix-test-met-nieuwe-offline-modus
75
Main players VoD – non-linear TV viewing
Hard disk recorder
‘RTL XL’ & ‘Kijk’
A selection of TV content from the RTL/SBS channels. It also includes previews of shows and a selection of movies and series
(mostly paid content). RTL offers content on subscription base; ‘RTL XL Premium’ (€4.- per month). Available via laptop,
smartphone, tablet and smart TV.
‘NPO Plus’ (NPO)
TV content from all the public TV channels. Free and available via laptop, smartphone, tablet and smart TV.
NLziet (NPO, RTL, SBS)
NLziet is a subscription (€8.- per month) for the three online platforms NPO Plus, RTLXL and Kijk. Subscribers can watch all
content of Dutch TV up until 365 days after broadcasting. No advertising. Available via laptop, smartphone and tablet.
‘KNIPPR’
KNIPPR offers a fixed, online TV subscription with options to extend with additional channels for €11 per month.
76
Main players VoD – non-traditional
Cinema media owner Pathé developed a platform to watch movies at home (pay-per-movie). Available via
laptop, tablet, smartphone and smart TV.
Netflix entered the Dutch market in September 2013. For €8.- per month users have a basic account and
have unlimited access to movies and series. Next to the basic subscription Netflix also offers a standard
(€10.-) and premium (€12.-) subscription. Available via laptop, tablet, smartphone and smart TV.
YouTube offers mostly user-generated content. The first paid channels have already been introduced.
Available via laptop, tablet, smartphone and smart TV.
Videoland was once the biggest offline movie rental company in the Netherlands. They now offer a lot of
on-demand movies (pay-per-movie). Available via laptop, tablet, smartphone and smart TV. In August 2013
RTL took over Videoland.
Ziggo introduced the Movies & Series XL service in 2017. Combined with a TV subscription (including 55
TV channels) it is possible to watch all HBO produced content from the last years on demand for €7.- per
month on TV, laptop, tablet and smartphone.
OTHER
77
YouTube is leading VoD channel followed by Netflix. Both NPO
and KIJK show annual growth.
Source: GfK DAM, base: 13+, average monthly reach 2016 – 2017 Q1
0%
10%
20%
30%
40%
50%
60%
70%
80%
90%
Jan '16 Feb '16 Mar '16 Apr '16 Mei '16 Jun '16 Jul '16 Aug '16 Sep '16 Oct '16 Nov '16 Dec '16 Jan '17 Feb '17 Mar '17
Video on Demand – average monthly reach
YouTube RTL XL Netflix NPO gemist Vimeo KIJK.nl NLziet
78
Netflix is especially popular among younger age groups. For SBS,
it is more difficult to reach youngsters (13-19).
0%
5%
10%
15%
20%
25%
30%
35%
40%
45%
Total 13+ 13-19 years 20-34 years 35-49 years 50-64 years 65 +
Monthly reach
Netflix RTL XL NPO gemist KIJK.nl
Source: DAM 13+, Jan 2017 – Mar 2017 (average monthly reach) | SKO 13+, Jan 2017 – Mar 2017, all day, average monthly reach within period
STER: 97%
RTL: 96%
SBS: 95%
STER: 94%
RTL: 93%
SBS: 92%
STER: 98%
RTL: 98%
SBS: 97%
STER: 99%
RTL: 99%
SBS: 98%
STER: 96%
RTL: 96%
SBS: 95%
STER: 93%
RTL: 93%
SBS: 88%
79
Watching TV on smartphone is gaining popularity
Source: GfK Trends in Digitale Media, Dec 2016 (N=1.251) | Source: GWI on-demand media service Q4 2015 – Q1 2017, base: NL 20-49
28%
30%
11%
18%
26%
31%
8%
24%24%
32%
12%
26%
25%
31%
14%
27%
23%
31%
15%
26%
24%
29%
15%
26%
21%
28%
17%
25%
0%
5%
10%
15%
20%
25%
30%
35%
Desktop (PC) Laptop/Netbook Smartphone Tablet
Devices used by people to watch television
Jun 13 Dec 13 Jun 14 Dec 14 Jun 15 Dec 15 Dec 16
21,0%
11,9%
3,4%
27,2%
15,1%
5,6%
31%
11%
4%
35,2%
14,1%
2,9%
38,2%
17,2%
5,6%
0%
5%
10%
15%
20%
25%
30%
35%
40%
45%
Netflix RTL XL Videoland
Which of the following content services have you
used in the last month?
2016 Q1 2016 Q2 2016 Q3 2016 Q4 2017 Q1
80
0
50
100
150
200
250
18-34 year 35-54 year 55+ year
Minutesperday
Online video consumption
3.40
hours
1.30
hours
0.40
hours
Big differences in time spend watching online video between age
groups. Millennials watch more than 3 hours per day.
Source: GfK Viewscape 2017, base: NL18+
81
NPO programs and TV series are popular for catch up TV
Date Day Program top 10 Channel GRP’s
1
25-02-2017 Sat Wie is de mol NPO 1 779
2
03-02-2017 Fri Flikken Maastricht NPO 1 525
3
26-02-2017 Sun Boer zoekt vrouw internationaal NPO 1 471
4
20-01-2017 Fri Ik vertrek NPO 1 444
5
26-02-2017 Sun Floortje naar het einde van de wereld NPO 1 420
6
22-01-2017 Sun Zondag met lubach NPO 3 418
7 16-03-2017 Tue Klem NPO 1 379
8
25-02-2017 Sat Moltalk NPO 1 333
9
20-02-2017 Ma Geheime leven van 4 jarigen NPO 1 294
10
06-03-2017 Ma Celblok H SBS 6 281
Source: SKO, best watched catch-up tv shows via television,+ 02:00-26:00 UUR, 6+, 2017 Q1
82
Cooking, sports, traveling and special interests are most popular
topics for online video content
31%
6%
8%
8%
11%
11%
15%
18%
19%
23%
26%
29%
33%
0% 5% 10% 15% 20% 25% 30% 35% 40% 45% 50%
None
Other
Banking
(Raising) kids
Energy
Health
Beauty
Electronics
Cultivate
Traveling
Sports
Hobby
Cooking
Topics watched – Online video
% watched in the last year
Source: Online Video Monitor 2017 – SAMR Smartagent Marketingresponse, Base: NL 18-54
69% of Dutch
population (18-54)
watch online videos
83
Kwebbelkop, the vlogger with most subscribers, has more
than 2 billion views in total
Rank User Total Video Views Subscribers Category
1 Kwebbelkop 2,087,994,143 2,830,014 Vlogs
2 EnzoKnol 1,081,890,272 1,454,240 Vlogs
3 Heroes TEAM 628,801,562 982,054 Vlogs
4 NikkieTutorials 463,865,622 6,385,539 Vlogs
5 StukTV 372,415,886 1,351,738 Vlogs
Source: Socialblade, Top 10 YouTubers in The Netherlands by most viewed | 09/02/2017
84
CINEMA
85
34.1
million
cinema visitors in
2016 (+3.7%)
€8.42Average price
per ticket
(+0.5%)
€287.1million
in ticket revenue
in 2016
Trends & developments – I
Source: https://foxscreen.nl/2017/01/11/bioscoopbezoek-groeit-naar-ruim-34-miljoen/ | http://www.marketingtribune.nl/media/nieuws/2016/09/nederlandse-bioscopen-koersen-op-recordjaar-van-
293-miljoen-euro-omzet/index.xm |
From 2015 to 2016 the number of cinema visitors went up by 3.7%.
The total number of cinema visitors is at a historically high level (only seen in 1967 and 2015).
86
Trends & developments – II
The positive cinema developments of 2016 seem to continue in
2017 Q1. In the first months of this year, the number of visitors
increased with 18% compared to the same period in 2016.
Movies Sing, Fifty Shades Darker and Beauty and the Beast
were the most popular titles.
After the opening of Kinepolis Jaarbeurs cinema in Utrecht with
14 halls and 3.200 seats, Jean Mineur Mediavision will further
extend the network in July with 15 new VUE cinema’s. Jean
Mineur hereby strengthened its position as market leader.
Source: http://www.marketingtribune.nl/media/nieuws/2017/05/uitbreiding-bioscoopnetwerk-jean-mineur-mediavision/index.xml
87
In 2016, he movie ‘Bridget Jones’s Baby’ was the most popular film
Title Revenue
(in ‘000)
Visits
(in ‘000)
Bridget Jones’s Baby € 10,300 1,191
Finding Dory € 8,900 1,082
Huisdiergeheimen € 8,100 1,024
The Jungle Book €9,446 967
Fantastic Beasts €8,658 874
Source: Nederlandse Vereniging van Filmdistributeurs (Dutch Film Distributors Association) and Nederlandse Vereniging van Bioscoopexploitanten (Dutch Association of Cinema Media Owners),
annual report 2016
88
#locations #cinema halls #seats #visitors Q1
Pathé(incl. CineMec) 25 202 42,136 4,435,828
Kinepolis 15 103 20,198 858,745
VUE 6 41 8,306 547,625
Other 29 131 20,060 1,442,752
Total 75 (54%) 477 (65%) 90,700 (70%) 7,284,950 (78%)
#locations #cinema halls #seats #visitors Q1
VUE 15 71 12,845 612,912
RSB Cinemas 6 20 2,329 220,032
Other 43 164 23,560 1,224,019
Total 64 (46%) 255 (35%) 38,734 (30%) 2,056,963 (22%)
Source: Jean Mineur & Fox Screen, Q1 2017
FoxScreen entered the market in 2015 but with a market share of
78%, Jean Mineur remains dominant.
89
Number of cinema visitors increased in line with the number
of film releases
-
100
200
300
400
500
0
5
10
15
20
25
30
35
40
2006 2007 2008 2009 2010 2011 2012 2013 2014 2015 2016
#Cinemas&FilmReleases
Visitorsinmillion
# Visitors (million) # Film releases # Cinemas
Source: Nederlandse Vereniging van Filmdistributeurs (Dutch Film Distributors Association) and Nederlandse Vereniging van Bioscoopexploitanten (Dutch Association
of Cinema Media Owners), annual report 2016
90
Increase of cinema visits mainly because of relatively high number
of visits in August, September and October.
0
500
1.000
1.500
2.000
2.500
3.000
3.500
4.000
4.500
Visitsin‘000
Cinema visits per 4 weeks
2016 2015 2014
Source: Nederlandse Vereniging van Filmdistributeurs (Dutch Film Distributors Association) and Nederlandse Vereniging van Bioscoopexploitanten (Dutch Association of Cinema Media Owners),
annual report 2016
91
For cinema there is a clear increase in gross media spend towards the
end of the year. Cinema vendors use monthly indices to reflect
seasonality patterns in their rate cards.
Source: Nielsen, 2014 – 2017 Q1 | Only gross spend for cinema
0,0
0,5
1,0
1,5
2,0
2,5
3,0
3,5
4,0
4,5
5,0
January February March April May June July August September October November December
GrossMediaspend(in€millions)
Seasonality cinema
2013 2014 2015 2016 2017 Q1
Total spend 2017 Q1: 3,366,699
Total spend 2016 Q1: 4,212,792
Total spend 2015 Q1: 3,307,903
Total spend 2014 Q1: 2,904,074
Total spend 2013 Q1: 3,653,400
92
Regular cinema visitors are younger than average. High social
class for both regular as non-regular and 50/50 on gender.
50% 50%
Profile regular cinema visitor
Source: NOM Print & Doelgroep Monitor 2015 II – 2016 I, base: total NL 13+ (N= 17.171) | * Regular cinema visitor is defined as someone who visits a cinema at least once a month, non-regular visitors
are people who visit the cinema less than once a month, excluding people who never visit the cinema.
Profile non-regular cinema visitor
3%
30%
19%
21%
17%
11%
13-14 (index 105) 15-24 (index 201)
25-34 (index (131) 35-49 (index 83)
50-64 (index 71) 65+ (index 57)
Social
class
% Index
A 33% 150
B1 26% 112
B2 22% 107
C 9% 62
D 10% 51
Social
class
% Index
A 27% 125
B1 26% 114
B2 23% 112
C 13% 84
D 11% 56
48% 52%
4%
20%
17%
31%
19%
9%
13-14 (index 154) 15-24 (index 138)
25-34 (index (122) 35-49 (index 123)
50-64 (index 79) 65+ (index 45)
93
In 2016, cinema reach among age group 16-39 increased significantly
75%
83%
73%
61% 59%
62%
43%
32%
76%
72%
89%
84%
70%
60%
42%
31%
0%
10%
20%
30%
40%
50%
60%
70%
80%
90%
100%
6-11 12-15 16-23 24-29 30-39 40-54 55-64 65+
Cinema reach
2015 2016
Source: Bioscoopmonitor 2016, Stichting Filmonderzoek
94
LISTENING
95
MCP: Listening
Consumers´ listening patterns are
constantly changing. Players such as
Spotify have entered the market and are
changing the way consumers experience
music. The availability of music and radio
via multiple devices further impacts how
people experience listening to music.
96
Trends & developments - I
The Media Exchange and
OMS are ending their co-
operation after a very
successful year (turnover and
number of advertisers). With a
growing online radio industry,
both publishers expect to serve
the market better apart from
each other.
Soundcloud has launched paid
subscriptions ‘Go-’ and ‘Go+’,
in the Netherlands. ‘Go-’ will
cost €6,- per month and ‘Go+’
€10,- per month based on the
size of the music offer. For
both subscriptions users are
not exposed to advertising and
are able to listen music offline.
STER starts with advertising
sale for radio channel FunX.
FunX is the urban channel for
young people. STER sees this
partnership as a complement
to its own, current channel,
NPO 3FM.
Source: https://www.emerce.nl/nieuws/omzet-online-radioreclame-verdubbelde-2016 |http://onemediasales.cmail19.com/t/| https://www.emerce.nl/nieuws/betaalde-abonnementen-soundcloud-nederland |
http://www.adformatie.nl/nieuws/ster-doet-landelijke-reclameverkoop-npo-funx | https://www.radiofreak.nl/rtl-nederland-helemaal-gestopt-met-radio/
RTL fully stopped with radio,
after it said farewell to digital
radio channel RTL Lounge
Radio. Talpa Radio has
replaced the FM channel with
‘Sky Radio Smooth Hits’.
Previously, RTL owned radio
channels Yorin FM, RTL FM
and partially Radio 538.
97
Trends & developments - II
The current broadcasting licenses of commercial radio for
broadcasting via FM, AM and DAB+ originally expired in 2017,
but are extended until 2022. The government will assign new
licenses by auction, an idea that caused a lot of resistance. By
the extension, minister Kamp meets the needs of radio stations
and the Dutch House of Representatives.
Radio stations who want to broadcast on FM, also have to
broadcast through DAB+. Since 2015 also DAB+ licenses
without FM are sold by the government.
The Media Exchange supports real time buying of radio spots the
same way online display advertisements are bought. The
independent platform offers real-time programmatic buying at
theme stations (e.g. 538 dance department, Sky radio lounge, etc).
MobPro and Spotify created a technical link to give advertisers
the possibility to programmatically buy advertising space within the
Spotify app. Advertisers are able to target on preferences of
listeners and can buy both display banners and audio spots.
Source: http://www.themediaexchange.nl/?mc_cid=b905d536f1&mc_eid=5ced93674c I http://www.emerce.nl/nieuws/mobpro-koppelt-spotify-audioreclame
98
Dutch radio stations, with advertising possibilities (I/II)
STER
One Media Sales
Q-Music NL
TMG
Source: retriever.nl, Q1 2017
99
Dutch radio stations, with advertising possibilities (II/II)
E-power advertising*
FD Mediagroep
ORN*
22 online stations
Source: retriever.nl, Q1 2017 * ORN (government) and E-Power are responsible for approximately 30 regional stations
100
Market share of NPO 3FM is further decreasing, NPO Radio 2 shows growth.
Q1 2017 was particularly successful for Sky Radio, Q-music and Radio 538.
Source: NLO, 2016 May-Jun - 2017 Mar-Apr. Base: NL 10+
0%
5%
10%
15%
Market share (%)
May-Jun 2016 Jul-Aug 2016 Sep-Oct 2016 Nov-Dec 2016 Jan-Feb 2017 Mar-Apr 2017
101
Increase of spend for NPO Radio 2 and Q-music. Decrease for
NPO 3 FM and for BNR Nieuwsradio.
0
5
10
15
20
25
30
35
40
45
MediaSpendperStation(inMillions)
Gross Media Spend
2016 Q1 2017 Q1
+7%
-26%
+339%
-40%
+25%
Source: Nielsen, 2016 Q1 – 2017 Q1. Gross spend for radio only.
102
0
10.000
20.000
30.000
40.000
50.000
60.000
70.000
80.000
90.000
100.000
January February March April May June July August September October November December
X1000
Gross media spend Radio
2013 2014 2015 2016 2017 Q1
Seasonality of radio shows low spend in Summer period and high peak in Q4
(Christmas and top lists at the end of the year). Some Radio vendors use monthly
indices to reflect the seasonality influences in their rate card.
Source: Nielsen, 2014 – 2017 Q1. Gross spend for radio only.
Total spend 2017 Q1: € 181,989,537
Total spend 2016 Q1: € 182,788,075
Total spend 2015 Q1: € 178,544,011
Total spend 2014 Q1: € 151,617,468
Total spend 2013 Q1: € 143,566,478
103
The automotive category is well represented within top 10 radio advertisers
Brand Category Gross radio spend Q1 2017
1 Kruidvat Retail €4,704,014
2 Renault Automotive €4,651,772
3 Mercedes Benz Automotive €3,737,800
4 Volkswagen Automotive €3,495,220
5 ZIGGO Internet €3,289,352
6 Fiat Automotive €2,918,192
7 LIDL Retail €2,634,921
8 Vodafone Telecom €2,583,653
9 Aldi Retail €2,581,976
10 KPN Telecom €2,539,394
Source: Nielsen, Q1 2017. Gross spend for radio only.
104
Some clutter in channels aimed at older audiences. A young and
more female station is missing in the radio landscape.
Source: NLO, 2017 (Mar-Apr), TA: NL 10+
Young
Female
Radio Veronica
‘Oldies’ (music more
than 5 years old)
BNR Nieuws Radio
News
SLAM!
Dance and new hits
Sublime FM
Jazz, soul, latin and
lounge
100% NL
Dutch
Male
Old
105
Streaming music
Application-based music
streaming service with 6,8
million users. Free and paid
subscription options; 40% of
the Dutch users are paying for
the streaming service.
Average monthly reach
Q1 2017: 24,7%
Audio platform that originally
enables sound creators to
share their created sounds.
Streaming music available for
free or through paid
subscription.
Average monthly reach
Q1 2017: 4,1%
Music streaming service for
web and app. Spot advertising
within playlist possible. Free
and paid subscription options.
Average monthly reach
Q1 2017: 1,2%
Music application of Apple for
streaming music and an
extension of iTunes. Only
available through paid
subscription.
Average monthly reach
Q1 2017: 19%
Source: Spotify | DAM Q1 2017 (TA 13+ N=1,091), Average monthly reach all platforms | Ownership Spotify - Trends in Digital Media, GfK Intomart, Dec 2014, base: online population 13+
who own a tablet and/or smartphone AND have al least one app
106
TV is the most popular device for listening to radio. Strong
increase for listening radio through smartphone.
0%
5%
10%
15%
20%
25%
30%
35%
40%
June '12 Dec '12 June '13 Dec '13 June '13 Dec '14 Juni '15 Dec'15 Dec'16
%Agreetolistenviadevice
Digital radio listening*
Desktop Laptop Smartphone Tablet Television** Streaming- network audioplayer
Source: Trends in Digital Media 2016, GfK Intomart, December 2015, base: online population 13+ (N=1,151) *Claims to listen radio via device **Television was previously reported as SettopBox.
Since the December 2015 publication it’s categorized under television.
107
Most time spent on online radio via TV. Radio station apps are
becoming more popular, although Spotify remains dominant.
45
107
21
60
36
11
0
50
100
150
200
250
300
Average minutes per week
Desktop
TV
Laptop
Streaming-/network player
Smartphone
Tablet
0% 5% 10% 15% 20% 25%
Spotify
Radio 538
NPO 3FM
Q-music
Nederland.fm
NPO radio 2
NPO radio 1
Sky Radio
100%NL
Radio Veronica
Radio 10
Radio Apps (downloaded)
Tablet (n=808)
Smartphone (n=1056)
Source: Trends in Digital Media, GfK Intomart, December 2016, base: All (n=1.151) Source: Trends in Digital Media, GfK Intomart, December 2016, base: owners of tablet and/or smartphone
108
READING
109
MCP: Reading
Reading is slowly shifting from paper to
(online) screens. More and more people
are reading newspapers on their tablet or
mobile phone. Increasingly, news content is
being accessed via free news sites or apps.
These new possibilities to get news and
read magazines are changing the
experience of reading.
110
Trends & Developments – I : pay-per-article/micropayments
Blendle (alternatives: Maggy, Elinea) is a micropayment
platform for quality content. Subscribers can top up their
Blendle wallet and are then only one click away from buying
articles from various newspapers and magazines. After steadily
expanding in its Dutch home market since its launch in 2014,
the platform has also been launched in Germany (2015) and is
in a beta trial phase in the US (2016).
As part of its international expansion plan, Blendle has
expanded its portfolio by adding international newspaper
titles such as The New York Times, The Wall Street Journal
and The Washington Post, as well as Times Inc magazines,
amongst others. In 2016, Blendle acquired the similar digital
reading app ‘Paper’ of De Persgroep.
111
Trends & developments - II
Research from PWC shows
that ‘print’ consumption will
further decrease because
consumers are shifting more to
online media. PWC calculated
a revenue drop of 3.3% for
magazines and 1.9% for
newspapers within 5 years.
Source: http://www.emerce.nl/nieuws/blendle-test-premiumdienst-vast-bedrag-per-maand | http://www.bladendokter.nl/pwc-uitgevers-blijven-komende-5-jaar-moeilijk-houden/ | http://www.emerce.nl/nieuws/nrc-
stapt-uit-blendle-na-introductie-premium-abonnement | https://www.emerce.nl/nieuws/fd-heeft-grootste-betaalde-digitale-oplage
Online kiosk Blende starts a
new monthly subscription
service ‘Blendle Premium’. For
€10.- per month, users don’t
need to pay per article
anymore, which was the only
payment possibility. Also,
Blende does not offer all
articles but makes a selection
based on user profiles.
NRC decided to quit its
partnership with Blendle. Chief
Editor Vandermeersch argues
that Blendle is not contributing to
high quality journalism because
of the ‘cheap’ premium option
and the lack of interactive
possibilities (such as video).
Of all national newspapers,
‘Financieel Dagblad’ has
relatively the largest digital
circulation. 60% of the total
circulation is digital, compared to
an average of 30%. With 68,646
digital subscribers, FD follows
Telegraaf (232,039) and
Volkskrant (88,535).
112
Trends & developments - III
Source: http://www.adformatie.nl/nieuws/nrc-handelsblad-en-nrcnext-vanaf-volgend-jaar-een-krant | http://www.bladendokter.nl/het-verschil-tussen-chantal-linda-en-wendy/ |
https://www.emerce.nl/nieuws/papieren-editie-hitkrant-stopt
NRC combined it’s newspapers
‘Handelsblad’ and ‘Next’. All readers
will receive the same newspaper.
NRC Next stays a morning
newspaper and NRC Handelsblad an
afternoon version.
After 40 years, ‘Hitkrant’ stops with its
paper version and shifts focus to the
online platform and social media. On
March 28th the magazine launched for
the very last time with a special
extended edition. From now on, a
paper version will be published only
six times per year with extra posters
and images.
Chantal Janzen launches a new
glossy ‘&C’ focused on fashion,
beauty, food and lifestyle. Chantal
follows colleagues ‘Linda de Mol’
and ‘Wendy van Dijk’ who are all
TV personalities with a magazine.
The circulation of &C will be
100,000 per month and next to a
paper edition there will be an app,
website and online shop.
113
Newspapers print circulation is dominated by national newspapers
1.427
1.138
377
-
200
400
600
800
1.000
1.200
1.400
1.600
2016 Q2 - 2017 Q1
€x1000
Moving year average circulation figures (in ‘000s)
National newspapers Regional newspapers Free sheets
Source: NOM, 2016 Q2 – 2017 Q1 | moving year average circulation figures. Based on print only (all paid-for and free-of-charge circulation)
114
Top 10
ranking
Title Newspaper type Total annual paid circulation
2016 Q2 – 2017 Q1
Total annual circulation
2016 Q2 – 2017 Q1
1 De Telegraaf National 373351 415306
2 Metro Free sheets 0 376728
3 AD National 311723 360799
4 de Volkskrant National 215409 258783
5
NRC Handelsblad
National
134191 143821
6 De Limburger Regional 122189 127113
7 De Gelderlander Regional 104359 115049
8 Trouw National 87819 104530
9 De Stentor Regional 89593 99036
10 Dagblad van het Noorden Regional 92851 98418
De Telegraaf is leading in terms of print circulation.
Source: NOM, 2016 Q2 – 2017 Q1 annual moving average circulation figures for newspapers. Based on print only (all paid-for and free-of-charge circulation), excluding digital circulation figures.
115
National papers AD and Telegraaf are leading in terms of reach.
Ranking
National newspapers
in terms of audience reach
Average issue reach
amongst NL 13+
(in ‘000s)
Average issue reach
amongst NL13+
(%)
1 AD Dagbladen 1.317,5 9,2
2 De Telegraaf 1.296,5 9,0
3 Metro 1.080,3 7,5
4 de Volkskrant 749,2 5,2
5 NRC Handelsblad 355,2 2,5
6 Trouw 337,1 2,4
7 Reformatorisch Dagblad 170,4 1,2
8 NRC.next 128,6 0,9
9 Het Financieele Dagblad 124,6 0,9
Source: NOM Print Monitor 2017-I, base: total NL 13+ (N=17,179)
116
Higher online reach for news site Nu.nl than digital replica of traditional
print titles. Nevertheless, more visits and higher visit frequency for NOS.
No. Top 10 online News
brands
Reach (%) Reach (‘000) # Visits (‘000) Avg visit frequency
1 NU.nl
48,6 6.920.000 151.479 21,9
2 NOS
48,5 6.915.000 232.472 33,6
3 AD
39,3 5.605.000 96.841 17,3
4 Telegraaf
36,8 5.236.000 139.489 26,6
5 RPO 34,6 4.933.000 90.301 18,3
6 RTL Nieuws
24,9 3.546.000 30.283 8,5
7
De Volkskrant
17,7 2.520.000 23.581 9,4
8
Prive
12,3 1.757.000 10.241 5,8
9 NRC
10,7 1.518.000 10.217 6,7
10 Omroep brabant 9,3 1.327.000 17.046 12,8
Source: DAM, base: 13+, average reach Q1 2017 all platforms
117
0
20
40
60
80
100
120
140
January February March April May June July August September October November December
Grossspendnewspapers(inMillions)
Seasonality newspapers
2013 2014 2015 2016 2017 Q1
Lower ad spend in dailies in Summer. 2017 Q1 spend levels are
higher than 2016 Q1, but still lower than previous years.
Source: Nielsen, 2013 -2017 Q1. Gross spend for newspaper advertising only.
Total spend 2017 Q1: € 220,349,390
Total spend 2016 Q1: € 178,879,156
Total spend 2015 Q1: € 275,585,434
Total spend 2014 Q1: € 255,306,640
Total spend 2013 Q1: € 292,194,772
118
No. Brand Category Newspapers gross spend
Q1 2017
1 Corendon Travel €8,510,062
2 Kras reizen Travel €7,659,468
3 Stip reizen Travel €7,365,124
4 Koopjedeal.nl Travel €5,127,126
5 Bolderman Travel €4,724,796
6 Zadkine media Media €3,642,475
7 Effeweg.nl Travel €3,438,069
8 NRC Media €2,976,658
9 Stella Transport €2,942,864
10 NRC Live Media €2,717,400
Travel brands are dominating the top 10 advertisers in newspapers
Source: Nielsen, 2017 Q1 | Gross spend for newspapers only.
119
High increase of spend for AD Nieuwsmedia and De Volkskrant
compared to 2016 Q1. Spend for Telegraaf decreased.
0
5
10
15
20
25
30
35
Mediaspend(inmillions)
Gross media spend Newspapers
2016 Q1 2017 Q1
+88%
-24%
Source: Nielsen, 2016 Q1 – 2017 Q1. Gross spend for newspapers only.
+87%
120
The growth of digital use of newspapers seems to have
stagnated over the last year across all devices.
38%
20% 20%
36%
21%
23%
35%
22%
24%
39%
27%
28%
36%
27% 27%
Pc/Laptop Mobile Tablet
NPDM 2013 I - 2013 II NPDM 2013 II - 2014 I NPDM 2014 I - 2014 II NPDM 2015 I - 2015 II NPDM 2015 II - 2016 I
Source: NPDM releases: 2013 I – 2016 I, base: total NL 13+
Digital use of newspapers
121
Family, culinary and women’s titles show highest circulation
figures, with increase for culinary and travel.
0
500
1000
1500
2000
2500
3000
3500
4000
4500
Family Culinary
mags (incl
sponsored)
Women's TV listings Newspaper
magazines
Home
decoration,
gardening &
DIY
Special
interest
Mind & body Travel Popular
Science
Youth Education
Moving year average total circulation (in ‘000s)
Q1 2016 - Q4 2016
Source: NOM, 2016 Q2 – 2017 Q1 annual moving average circulation figures. Based on total magazines (all paid-for and free-of-charge circulation).
122
High circulation numbers for sponsored magazines. Kampioen
has by far the highest total circulation.
Top 10 Title Magazine type Total paid circulation
2016 Q2 – 2017 Q1
Total circulation
2016 Q2 – 2017 Q1
1 Kampioen
Family
3409112 3409112
2 Allerhande
Culinary sponsored
0 2019907
3 Boodschappen
Culinary sponsored
0 1901586
4 Eigen Huis magazine
Home decoration, gardening & DIY
751803 751803
5 Vrouw
Women’s
0 510743
6 Vrij
Newspaper mags
0 507136
7 Burgerkracht
Special Interest
0 496119
8 AD Magazine
Newspaper mags
0 411997
9 Het Volkskrant Magazine
Newspaper mags
0 370736
10 Libelle
Women’s
292255 297778
Source: NOM, 2016 Q2 – 2017 Q1 annual moving average print circulation figures for magazines
123
Source: NOM Print Monitor 2017-I, base: total NL 13+ (N=17,179)
Women’s and family titles have highest reach
Top 10 magazine titles
in terms of audience reach
Publication type
Average issue reach
amongst NL 13+
(in ‘000s)
Average issue reach
amongst NL13+
(%)
Kampioen Family 4.852,1 33,8
Allerhande Culinary sponsored 4.239,6 29,6
Libelle Women’s 1.622,1 11,3
Donald Duck Kids 1.396,3 9,7
LINDA. Women’s 1.192,7 8,3
Vrouw Women’s 1.137,0 7,9
Privé Celebrity 1.041,2 7,3
Margriet Women’s 1.036,1 7,2
Veronica Magazine Television magazine 984,9 6,9
Quest Science 975,4 6,8
124
0
10
20
30
40
50
60
January February March April May June July August September Oktober November December
Magazines
grossmediaspendinmillions
Seasonality Magazines
2013 2014 2015 2016 2017 Q1
Ad spend in magazines peak in Spring, early Summer and during
the holiday season (December).
Source: Nielsen, 2013 – 2017 Q1. Gross spend for consumer magazines only.
Total spend 2017 Q1: € 83,860,128
Total spend 2016 Q1: € 82,193,705
Total spend 2015 Q1: € 86,926,763
Total spend 2014 Q1: € 98,803,815
Total spend 2013 Q1: € 113,873,869
125
No. Brand Category Gross spend in Q1 2017
1 Sanoma Media € 1,148,783
2 Hollands Nieuwe Telecom € 1,147,852
3 Corendon Travel € 1,140,911
4 Unox FMCG € 1,071,013
5 ANWB Travel € 1,055,265
6 Elsevier Media € 999,144
7
Cookloveshare.nl
Media € 958,999
8
Albert Heijn
Retail € 824,350
9 Otolift Home € 768,392
10
Voordeeluitjes.nl
Travel
€ 754,112
When looking at individual brand level, Sanoma and Hollands
Nieuwe are main print advertisers.
Source: Nielsen, 2017 Q1. Gross spend for consumer magazines only.
126
Libelle shows high increase of spend levels and is now leading in
stead of Allerhande. Woman titles show overall increase of spend.
0
1
2
3
4
5
6
7
8
9
Mediaspend(inmillions)
Gross media spend magazines
2016 Q1 2017 Q1-21%
+54%
Source: Nielsen, 2016 Q1 – 2017 Q1. Gross spend for consumer magazines only.
127
High consumption of door drops mainly by older generations.
91%
86%
82%
78%
73%
64% 62%
0%
10%
20%
30%
40%
50%
60%
70%
80%
90%
100%
Total Reach %
25%
15%
27%
33%
41%
47%
0%
5%
10%
15%
20%
25%
30%
35%
40%
45%
50%
13-14 15-24 25-34 35-49 50-64 65+
Total Reach %
High consumption of door drops (> 13.5 titles)Reach per category
Source: NOM folder monitor 2017 *Media imperatives are based on frequency of appearance
128
Albert Heijn door drops have highest reach, both print as digital
No. Brand Category REACH PRINT (IN %) REACH DIGITAL (IN %)
1 Albert Heijn Supermarket 55.9% 12.4%
2 Kruidvat Drugstore 54.1% 9.7%
3 Lidl Supermarket 45.8% 9.1%
4 Blokker Household 44.7% 5.9%
5 Aldi Supermarket 44.4% 6.6%
6 Hema Household 41.4% 6.5%
7 Mediamarkt Electronic 37.3% 6.2%
8 Gamma House / Garden 37.0% 4.4%
9 Praxis House / Garden 35.4% 4.1%
10 Karwei House / Garden 32.5% 3.3%
Source: NOM Folder Monitor 2017
129
COMMUNICATING
130
MCP: Communicating
Human beings are a social species,
with communication taking place throughout the day.
Face-to-face interaction won´t disappear anytime yet
but the younger generations don’t differentiate so
much anymore between online/offline
communications. The social experience around
communication is changing as communicating via
Facebook Messenger, WhatsApp, Snapchat and the
like is getting more and more accepted.
131
Social media
SOCIAL MEDIA
132
Trends & developments – I
Facebook extends the video
possibilities for advertisers by
offering the ‘mid-roll’ format. From
now on, video content can be
interrupted with commercials. The
same applies to live video.
Source: http://fonkonline.nl/artikelen/tech/amerikaanse-verkiezingen-schudden-google-en-facebook-wakker-38544.html | https://www.emerce.nl/nieuws/instagram-stories-krijgt-full-screen-reclame |
https://www.emerce.nl/nieuws/facebook-alle-remmen-los-video-advertenties
Google and Facebook will try to
avoid (or delete) advertisements on
pages with fake news. This was a
reaction after the American
elections. It appeared that Facebook
and Google were determining for
the outcome of the US elections.
Instagram Stories will offer full screen
advertising options within the new
Story feature of full screen content
that disappears after 24 hours.
Brands also have the opportunity to
use the ‘Stories’ feature in the same
way as consumers (this only can be
seen by users who follow the brand).
133
Trends & developments – II
Source: https://www.iculture.nl/nieuws/whatsapp-status-snapchat/ | https://www.emerce.nl/nieuws/snapchat-ontbreekt-meeste-nederlandse-mediaplannen | https://www.emerce.nl/nieuws/groei-
snapchat-nederland-neemt-laatste-maanden-snel-af | https://www.emerce.nl/nieuws/twitter-jaarcijfers
After Snapchat, Instagram and
Facebook Messenger, people can now
also share their ‘live’ or daily content on
WhatsApp with ‘WhatsApp status’.
Just as for the other platforms users
are able to share their story with
contacts for 24 hours, after that it will
be removed automatically.
In Q4 2016, the turnover of Twitter was
717 million dollars in stead of the expected
740 million dollars. The net loss was 167
million dollars, twice as much as in 2015.
The number of monthly, active users of
Twitter is not growing. As a result of
disappointing developments the Dutch
offices closed before. BrandDeli is now
responsible for sales of Twitter.
Based on research of MeMo2, Snapchat
is not yet included in many media plans
since it is hard to justify budgets while the
results are hard to measure/compare with
other media types. Nevertheless is 54%
of users between 12 and 24 using it daily
and 70% using it monthly.
Telecompaper reveals that the growth of
Snapchat stagnated, in terms of followers
and usage. The photo app seems to be
especially popular among teenagers and
young millennials.
134Source: Newcom, Dutch National Social Media Survey 2017, TA: 15+
WhatsApp and Facebook still show growth in usage. Highest
increase for Instagram, slight decrease for Twitter.
Social media usage
135
Highest usage for WhatsApp and Facebook. Replacing Twitter,
Instagram enters top 5.
Main platforms:
3.2 million
Dutch people
use Instagram,
1.5 million use
it daily
4.3 million
Dutch people
use LinkedIn,
0.4 million
use it daily
7.5 million
Dutch people
use YouTube,
1.7 million use
it daily
10.4 million
Dutch people
use Facebook,
7.5 million use
it daily
10.9 million
Dutch
people use
Whatsapp,
7.8 million
use it daily
Source: Newcom, Dutch National Social Media Survey 2017, TA: 15+
Other platforms:
0.1 million
Dutch
people use
Foursquare
, 46 K use it
daily
0.1 million
Dutch
people use
WeChat,
63 K use it
daily
0.4 million
Dutch people
use Tumblr,
101 K use it
daily
1.9 million
Dutch people
use
SnapChat,
960 K use it
daily
2.4 million
Dutch
people use
Pinterest,
381 K use it
daily
2.6 million
Dutch people
use Twitter,
871 K use it
daily
136
Snapchat and Tumblr are mainly used by younger age groups
10% 10% 8%
14%
10% 10%
28%
22%
24% 25% 27%
28%
27%
20%
35%
30%
27% 28% 29%
28%
29%
28%
23%
26%
25%
24% 26%
20%
24%
26%
10%
17%
14% 12% 11% 10% 10%
16%
3%
Facebook Twitter LinkedIn Instagram Pinterest Google+ Snapchat Tumblr
Age distribution of social networking sites in NL
13-19
20-34
35-49
50-64
65+
Source: GfK DAM, base: 13+, Q1 2017
137
Facebook account ownership is stable at a high level. Active usage
is again increasing after dip in 2014
0%
10%
20%
30%
40%
50%
60%
70%
80%
90%
100%
Total 16+ 16-24 25-34 35-44 45-54 55-64
Account ownership
2012 2013 2014 2015 2016 2017 Q1
0%
10%
20%
30%
40%
50%
60%
70%
80%
90%
100%
Total 16+ 16-24 25-34 35-44 45-54 55-64
Active users monthly
2012 2013 2014 2015 2016 2017 Q1
Source: GlobalWebIndex, 2012 – 2017 Q1, Base Internet Users NL16+,
138
0%
10%
20%
30%
40%
50%
60%
70%
80%
90%
100%
Total 16+ 16-24 25-34 35-44 45-54 55-64
Account ownership
2012 2013 2014 2015 2016 2017 Q1
Account ownership and usage of LinkedIn increases further after a
slight decrease in 2015
0%
10%
20%
30%
40%
50%
60%
70%
80%
90%
100%
Total 16+ 16-24 25-34 35-44 45-54 55-64
Active users monthly
2013 2014 2015 2016 2017 Q1
Source: GlobalWebIndex, 2012 – 2017 Q1, Base Internet Users NL16+,
139
Strong increase for account ownership and activity of Instagram,
for all age groups.
0%
10%
20%
30%
40%
50%
60%
70%
80%
90%
100%
Total 16+ 16-24 25-34 35-44 45-54 55-64
Account ownership
2013 2014 2015 2016 2017 Q1
0%
10%
20%
30%
40%
50%
60%
70%
80%
90%
100%
Total 16+ 16-24 25-34 35-44 45-54 55-64
Active users monthly
2013 2014 2015 2016 2017 Q1
Source: GlobalWebIndex, 2013 – 2017 Q1, Base Internet Users NL16+. Instagram data is available from 2013 Q2
140
Account ownership of YouTube is further increasing, just like
active usage which shows an uplift after 2014.
0%
10%
20%
30%
40%
50%
60%
70%
80%
90%
100%
Total 16+ 16-24 25-34 35-44 45-54 55-64
Account ownership
2012 2013 2014 2015 2016 2017 Q1
0%
10%
20%
30%
40%
50%
60%
70%
80%
90%
100%
Total 16+ 16-24 25-34 35-44 45-54 55-64
Active users monthly
2012 2013 2014 2015 2016 2017 Q1
Source: GlobalWebIndex, 2012 – 2017 Q1, Base Internet Users NL16+
141
Social Media in The Netherlands: privacy concerns are still an issue
Source: Newcom, Dutch National Social Media Survey 2017, TA: 15+
66% is
worried
about their
data being
sold
54% is
worried
about their
data in
general
57% does
not know if
they can
trust social
media
17% has
(a lot of)
trust in
social
media
142
Worries about privacy have slightly increased. Especially the
older age groups are worried.
44%
48%
0% 10% 20% 30% 40% 50% 60%
Worried
Worries about privacy in The Netherlands
2016 2015
Source: Ruigrok NetPanel, Whats happening online 2016, 18+ n=1,239
26%
38%
51% 52%
42% 42%
35% 34%
28%
17%
12% 12%
3% 3%
1% 2%
0%
10%
20%
30%
40%
50%
60%
Digital teenagers Millennials Generation X Babyboomers
Worried about privacy
Worried Neutral Not worried Don't know
143
SURFING ONLINE
144
Trends and developments – I
E-commerce has increased with
16.5% in 2016. The Dutch
online shopper is expected to
spend €811 per person, which is
an increase of €26.64 compared
to 2015.
E-commerce
Source: http://www.marketingonline.nl/nieuws/e-commerce-groeit-dit-jaar-met-165 |http://www.nu.nl/internet/4339731/cookiewet-duur-en-beschermt-onvoldoende.html | https://www.emerce.nl/best-
practice/youtube-begint-afscheid-cookies-pixels | https://radar.avrotros.nl/nieuws/detail/akkoord-over-roaming-binnen-eu/
Cookie law EU Telecom
According to Actal, the much
debated cookie law will
disappear in the future. Just like
in other EU countries, websites
have to ask visitors for
permission for the use of
tracking cookies, but this is
expensive and causes irritation.
YouTube Pixels
Youtube wants to decrease the use
of cookies and pixels and will shift to
‘cloud based measurement’. The
current technology of cookies is less
effective because of the increasing
cross device usage. That’s why data
will be based on Google users in
stead of Cookies. With this choice,
Google makes a big step to ‘people
based marketing’.
From June 15th 2017, phone
users will pay the same amount
of money for roaming, texting
and calling in every European
country. According to the
European Parliament this is a
victory for the European
Telecom consumer.
145
Trends and developments – II
Websites are struggling with ad blockers.
The number of people who are installing
ad blockers on desktop, tablet and
phones is growing. Right now, 4,9% of all
Internet users around the world are not
seeing advertisements. In The
Netherlands, this number is much higher
(26%). For websites this is perceived to
be a big problem as it decreases the
value of online ads.
Half of the Dutch population considers
to install ad blockers. People have a
positive attitude towards advertising in
general, but are annoyed by online ads.
The use of ad blockers is highest on
laptops and desktops. However, the
intention to install ad blockers is
highest for smartphones.
The popular ad-blocker website
AdBlock Plus will give advertisers the
opportunity to serve relevant and good
ads. Advertisers and publishers can be
on a ‘white list’ by paying a certain
amount of money. Also, the ads itself can
not be too irritating for users.
Source: http://nos.nl/artikel/2056954-websites-worstelen-steeds-meer-met-adblockers.html | http://www.adformatie.nl/nieuws/onderzoek-adformatie-helft-nederlanders-wil-aan-de-adblocker I
http://www.emerce.nl/nieuws/adblock-plus-gaat-zelf-advertenties-verkopen
146
Trends and developments – III
0%
5%
10%
15%
20%
25%
30%
35%
40%
45%
50%
Total 16-24 25-34 35-44 45-54 55-64
Using services such as AdBlock in the past month
Q1 2016 (n=801) Q2 2016 (n=755) Q3 2016 (n=754) Q4 2016 (n=754) Q1 2017 (n=1300)
Source: GlobalWebIndex, Q1 2016 – Q1 2017, Base Internet Users NL16+
There seems to be an uplift
in AdBlock use for the older
age groups, whilst the use
for younger age groups is
stagnating or showing a
small decline.
147
Trends and developments – IV
DMA Institute is an international digital media
auditing and quality assurance service empowering
digital leaders and organizations in “Assessing The
True Value Of Digital Media’’.
With DMA you can measure the time for which the
ads have been visible, which audience has seen the
ad and which sites and placements provided
conversions for the brand.
Source: http://www.adformatie.nl/nieuws/dma-institute-begint-met-certificeren | DMAI Year End 2016 Visibility Benchmarks, January 2017. *In View: impression that has been in view for longer
than 1 second. ** Quality View: an impression that has been in view for longer than 5 seconds.
0%
10%
20%
30%
40%
50%
60%
70%
Q1 2016 Q2 2016 Q3 2016 Q4 2016
DMA visibility benchmarks
In View* Quality View*
Total 2016
In View: 59%
Quality View: 41%
148
Cooblue has by far the highest digital spend in Q1 2017*
No. Brand Category Gross spend
Q1 2017
1
Coolblue.nl
Retail
€7,314,613
2
KPN
Telecom
€4,462,506
3
McDonalds
Food
€3,955,668
4
Fisher Investments
Real estate
€3,799,743
5
Vergelijk.nl
Retail
€3,415,488
6
Dela
Financial
€3,402,777
7
Exact
Software
€3,090,669
8
AD
Media
€3,043,463
9
Bijenkorf
Retail
€2,994,552
10
ANWB
Travel
€2,760,757
Source: Nielsen, Q1 2017. * Note: online spend without taking into account social, SEA and in-app advertising.
149
Programmatic Update: Google DoubleClick Bid Manager (DBM)
Cross-environment reporting
shows the effectiveness of
advertising campaigns across all
environments (apps, browsers and
different devices). The metric links
together cookies, web ID’s and
anonymized google sign-ins to
identify a user and determine the
path taken, from seeing an ad to
conversion, across different
environments.
Active View, Google’s
viewability measurement
solution is now available for
YouTube in-stream ads.
Using custom affinity segments
it becomes possible to target
audiences based on the media
they consume (offline and
online) or based on the
products or services they might
be interested in.
Cross-environment
conversion tracking
Active View
Custom affinity
Segments
It will soon be possible to run
programmatic deals on all
inventory, regardless of the
publisher’s ad server, using Tag
Guarantees deals directly. This
will allow to run reservation
campaigns together with
programmatic buys and hence
gather media buying in one
place.
Tag Guarantees
Source: VIVAKI Programmatic
150
Digital ad formats (I/II) - Standard IAB
Source:http://nextday.media/producten/
Half-page ad
300x600
Full banner 468x60
Leaderboard 728x90
Billboard 970x250
Large rectangle 336x280 Medium rectangle
300x250
Wide
Skyscraper
160x600
Skyscraper
120x600
151
33%
14%
15%
37%
42%
14%
18%
38%
46%
17%
20%
41%
44%
16%
20%
40%39%
14%
17%
37%
42%
17%
19%
38%
Social Networks Buying/selling Streaming video Searching for info
2012 2013 2014 2015 2015 II - 2016 I 2017 I
Up until 2014 all online activities have shown an increase in usage.
Online activities done ‘often’ – across time
Source: NPM 2012 I - II to NPM 2017-I, NL 13+ | From 2017, NPM comes out each quarter
152
Activities across platforms are more or less similar, although popularity
differs slightly. Social media and Search are present in top 3 of all devices.
43
46
47
48
53
54
58
59
62
66
Searched for a product or service
you want to buy
Used a map or directions service /
app
Used an internet banking service
Visited a news website / app /
service
Used a chat or instant messaging
service / app
Uploaded / shared a photo
Checked the weather online
Used a webmail service to access,
read or send emails
Visited / used a search engine
Visited / used a social network
Top 10 - Mobile
49
49
55
57
57
61
66
67
68
76
Used a map or directions service /
app
Used an online encyclopedia such
as Wikipedia
Visited a news website / app /
service
Checked the weather online
Purchased a product online
Used an internet banking service
Used a webmail service to access,
read or send emails
Visited / used a social network
Searched for a product or service
you want to buy
Visited / used a search engine
Top 10 - PC / Laptop
14
14
15
18
21
21
21
22
26
30
Used a map or directions service /
app
Used an online encyclopedia such
as Wikipedia
Used an internet banking service
Watched a video clip or visited a
video-sharing site
Visited a news website / app /
service
Searched for a product or service
you want to buy
Checked the weather online
Used a webmail service to access,
read or send emails
Visited / used a social network
Visited / used a search engine
Top 10 - Tablet
Source: GlobalWebIndex, 2017 Q1, Base Internet Users NL16+ (N= 1300), Have done in the past month
153
Online population is slightly more male, but Dutch women spend more
time online compared to other countries. Internet penetration amongst
65+ and lower educated is steadily rising.
Internet penetration NL 2014 2015 2016 Index
Male 93.1% 93.4% 94.9% 100
Female 88.3% 90.7% 91.5% 103
13+ 90.7% 92.1% 93.2% 102
13 – 19 years old 99.1% 99.4% 99.4% 100
20 – 34 years old 99.2% 98.8% 99.2% 100
35 – 49 years old 97.6% 97.7% 99.2% 100
50 – 64 years old 91.8% 94.5% 96.6% 103
65+ 66.4% 71.0% 72.5% 107
High educated 98.2% 98.0% 98.3% 100
Middle educated 93.9% 95.0% 96.4% 101
Low educated 70.5% 74.4% 76.3% 106
Source: Media Standard Survey 2016 (N= 6,000)
154
Most people (79%) have online access at home on a daily basis. Access on
mobile is increasing and becomes number one device for Internet access.
0%
25%
50%
75%
100%
Online access in %
2013 2014 2015 2015 II - 2016 I 2017 I 79%
8% 4% 1% 0% 0% 0% 2% 1% 5%
(Almost)
daily
4-5 days
a wk
2-3 days
a wk
Once a
wk
Once
every 2
wks
Once a
month
< once a
month
Never Don't
know
No
access at
home
Online access - At home
11%
21%
11%
4% 1% 1% 1% 2% 2%
47%
(Almost)
daily
4-5 days
a wk
2-3 days
a wk
Once a
wk
Once
every 2
wks
Once a
month
< once a
month
Never Don't
know
No
access at
work
Online access - At work
Source: NPM 2017-I, base: total NL 13+Source: NPM 2013 I - II to NPM 2017-I, NL 13+ *From 2017, NPM comes out each quarter
155
Strong growth figures for online consumer spends
8.200 9.000 9.800 10.600
13.730
16.090
20.060
6
7
8
9
10
11
12
0
5.000
10.000
15.000
20.000
25.000
€billions
Online shopping spend People buying online
+10% +9%
+8%
+30%
+17%
E-commerce trendsTop 5 branches annual increase in online spend Q1 2017
25%
29%
30%
34%
52%
Child Toys
Sport & Recreation
Home & Garden
Clothing
Health & Beauty
Online
Source: Thuiswinkel Marktmonitor 2010 – 2017 Q1
Online spends Q1 2017: 5.5 billion (+ 11%)
Number online purchases Q1 2017: 44.4 million (+ 11%)
Number online buyers Q1 2017: 11.1 million
+25%
millions
156
ON THE GO
157
MCP: On the Go
On average people spend one hour per day
On the Go. On the Go is stable over the years
although the moments that brands can get in
contact with consumers while they are On the
Go are increasing. This is mostly due to
increased smartphone and mobile
Internet penetration, but also due to new and
innovative digital OOH media solutions.
158
Trends and developments I
Source: http://fonkonline.nl/artikelen/media/rechter-pakt-exterion-hard-aan-38340.html | http://www.jcdecaux.nl/nieuwsberichten/rotterdamse-ret-kent-voorlopige-gunning-alle-outdoor-formaten-toe-aan-jcdecaux |
http://clearchannel.nl/nl/Nieuws/Laatste-nieuws/Clear-Channel-International-lanceert-eerste-out-of-home-programmatic-buying-platform-in-Europa#.|
Clear Channel International has launched,
as first OOH vendor, a programmatic
buying tool for ‘on the go’ advertising in
Europe. From January, this automated
solution is live in Belgium and Clear
Channel has plans to launch the tool in
other European countries soon.
After a false allocation to Exterion Media,
public transport organization of Rotterdam,
RET, has officially granted its outdoor
advertising rights to JCDecaux. JCDecaux
will have exclusive outdoor rights in
Amsterdam, Utrecht and Rotterdam.
159
Factsheet Outdoor II
Source: VivaKi, December 2015
Publisher Objects Location
JCDecaux Ad shells/6s, billboards, odd-sized objects, trams Bus and tram stations
ExterionMedia Ad shells/6s, billboards, buses/trams, railway stations, posters and screens in shopping centres Street, shopping areas, public transport stations
Clear Channel Ad shells/6s, city cells, billboards, masts, parking garages, schools, metro stations Street, schools, highway, tube- and parking
Interbest Masts near highways A0, A1, A2 screens Highways
Centercom Posters in supermarkets Streets, supermarkets
MMD Media Shelters, digital screens, billboards, busses, airports Street, leisure indoor, sports, transport – airports
OOHA Media Masts, LED masts Streets, highway
Blowup Media Scaffolding large formats Streets
Schiphol Media Big variety of media at Schiphol Airport Amsterdam Airport
OV Media & Triple Media Buses, A3 posters in buses Buses
Altermedia Toilet ads, taxi ads and truck ads Leisure indoor and public transport
Boomerang Media Toilet ads, Freecards Leisure indoor horeca
OV Media Bus ads, A3 screens Busses
Triple Media Bus ads, A3 screens Busses
160
Radio by far the most popular media activity On the Go with a
similar level of time spend at home
1:06
1:01
2:17
0:060:18
0:01
0:04
0:14
0:01
0:14
0:05
Average time spend per day in minutes
Radio
TV linear
TV non-linear
Magazine
Newspaper
Social Media
Source: Media:Tijd 2015, base: All adults 13+ (N=2,818)
161
0%
10%
20%
30%
40%
Share of gross media spend OOH
2013 2014 2015 2016 2017 Q1
Others
Outdoor market is dominated in spend by 4 main players. In Q1
2017, relatively low share of spend for Clear Channel.
Source: Nielsen, 2013 – 2017 Q1. Gross spend for out of home only.
162
Total reach per vendor is highest for age group 20-34. JCDecaux
is dominant in billboard advertising.
Source: BRO, March 2017, database version CAFAS 21.1 | Reach is based on total sights per vendor.
68%
77% 77%
67% 64%
59%
68%
73% 76%
69%
64%
58%
74%
81% 82%
75%
70%
64%
26% 26% 27% 26% 25% 23%
0%
20%
40%
60%
80%
100%
13-75 13-29 20-34 35-49 50-64 65-75
Shelters
Exterion (5,174 sides)
JCDecaux (9,124 sides)
Clear Channel (8.172 sides)
MMD (583 sides)
31% 32% 33% 32% 29% 27%
66% 68% 70% 68%
63%
58%
42%
46% 48%
42% 39%
36%
13% 14% 15% 13% 12% 11%
0%
20%
40%
60%
80%
100%
13-75 13-29 20-34 35-49 50-64 65-75
Billboards
Exterion (190 sides)
JCDecaux (998 sides)
Clear Channel (382 sides)
MMD (131 sides)
163
0
10
20
30
40
50
January February March April May June July August September October November December
Outofhome
grossmediaspendinmillions
Out of Home Seasonality
2013 2014 2015 2016 2017 Q1
Although spend slightly peaks in Spring and Q4, outdoor advertising
shows pretty stable levels of ad spend through the year.
Source: Nielsen, 2013 – 2017 Q1. Gross spend for out of home only
Total spend 2017 Q1: € 115,376,021
Total spend 2016 Q1: € 113,460,263
Total spend 2015 Q1: € 108,963,666
Total spend 2014 Q1: € 120,736,977
Total spend 2013 Q1: € 104,567,075
164
T-Mobile dominates the market of OOH spend. In general, the
telecom category is highly visible in OOH advertising.
Brand Category Gross spend Q1 2017
1 T-Mobile Telecom €3,306,045
2 McDonalds Fastfood €3,142,070
3 Corendon Travel €2,441,078
4 Tele2 Telecom €1,980,832
5 Aldi Retail €1,980,721
6 Belsimpel Telecom €1,570,670
7 Samsung Telecom €1,453,220
8 Simpel Telecom €1,370,948
9 Telfort Telecom €1,224,075
10 Zalando Retail €1,172,141
Source: Nielsen, 2017 Q1. Gross spend for out of home only.
165
Street shelterMast Billboard
Standard formats
166
Aerial advertisingScaffold Sampling
Alternative formats I
167
Alternative formats II
Public transport Street objects Toilet advertising
168
Digital Out of Home
Source: Vivaki Digitale Out of Home Update, March 2017
With 12% of the total OOH market and 8,000
screens on 5,000 locations, Digital Out of Home
still has a low share in The Netherlands.
Nevertheless, the Dutch market is experiencing
significant growth. It is expected that the increase
in gross spends (+ 340% in 2016 compared to
2015) will continue in 2017. PwC Outlook predicts
that in 2019 the share of spends of DOOH will
increase to 40% of the total OOH market.
169
Specific Targeting
New opportunities for communication with Digital Out of Home
In the near future, programmatic buying
for DOOH inventory will become bigger.
The only company that currently offers
programmatic buying is ‘MyAdbooker’.
The possibilities are limited because the
main players do not offer this.
It is expected that in the near future it will
be possible to target DOOH campaigns,
in particular the creative materials, at
specific target groups by the use of
Detection Software. This software is able
to anticipate on variables like age,
gender, total passengers, mood.
The opportunity of DOOH for real time
communication are embraced by brands
like Transavia, NS and the
‘Nierstichting’. Here, DOOH was used to
offer real time travel places or to
communicate directly with patients with
a chronic kidney disease.
Programmatic buying Real time communication
Source: Vivaki Digitale Out of Home Update, March 2017| http://www.adformatie.nl/nieuws/transavia-adverteert-realtime-stoelenaanbod-outdoor-campagne | http://www.adformatie.nl/nieuws/programmatic-ooh-
campagne-ns-op-basis-van-real-time-vluchtgegevens | https://www.nierstichting.nl/pers/2016/09/live-stream-op-stationsplein-rotterdam-maakt-wereld-nierpatient-weer-groot/
170
Beacons – consumer interaction 2.0
At 250 locations in Alkmaar and
Purmerend all outdoor objects are
provided with beacons. Exterion Media
has the largest Dutch Beacon network.
Beacons are Bluetooth 4.0 channels
which can be detected by iOS and
Android apps. All interaction takes
place via the app on the user’s phone.
The supplier of the app has many
opportunities to initiate actions that are
focused on place, time and the profile
of the app user.
In 2013, Apple launched their own
iBeacon system. Google has
launched their own Beacon ‘game
changer’ in 2015, called EddyStone.
It makes the deployment of beacons
unprecedentedly simple and
efficient.
Amsterdam has installed a beacon network
in its city center. The bluetooth beacons are
located in several public spaces. The
municipality of Amsterdam works together
with JCDecaux, GVB (public transport), and
Google. JCDecaux already has experience
with this technology, its network is enriched
with beacons (android only).
Source: http://www.adformatie.nl/nieuws/exterion-media-rolt-beacon-netwerk-uit | http://www.adformatie.nl/blog/eddystone-maakt-integratie-van-beacons-marketingmix-tot-kinderspel |
http://www.dktp.nl/wijzen-amsterdamse-bakens-de-weg-in-innovatieland/
171
MAAIKE
DE VRIES
Insights & Data Director
maaike.de.vries@starcom.nl
This media landscape presentation will be updated every quarter. For comments & questions, please contact the Starcom Insights & Data team.
SANDER
GEERLING
Senior Insights & Data Consultant
sander.geerling@starcom.nl
MARJO
VAN DEN AKKER
Insights & Data Consultant
marjo.vandenakker@starcom.nl
172
APPENDIX
173
TV audience measurement I
‘Stichting KijkOnderzoek’ (SKO) is the primary provider of the official television
audience ratings in the Netherlands.
SKO is a non-profit organization, organized as a Joint Industry Committee (JIC).
The Media Standard Survey is used for weighting.
The television audience measurement provides information on how many people
watched a program, when they watch tv and what their characteristics are. Viewing
data is collected second-by-second by means of a metering system that is installed
at 1,250 house holds (2,750 persons) which is representative for the Netherlands.
Ratings are reported minute-by-minute for channels received in the Netherlands
independent of the way their signal is distributed.
Source: www.kijkonderzoek.nl
174
CENSUS DATA
By using VAST
technology for online
video (IAB standard).
Incl. Desktop, Mobile and Tablet
Introduction by SKO:
1 July’14 – 1 January ‘15
PANEL DATA
Who is watching?
What is % reach?
Start 2015
DATA FUSION
Mid 2015
ONLINE VIDEO TOTAAL(RTL, NPO, SBS only)
September 2015
TV TOTAL (Linear & non-linear; via TV screen)
Existing
Video Total (April 2017)
The core of the audience measurement is the
common currency (TV Total). The measurement
includes guest viewing in the panel households and
time shifted viewing (on the day of broadcast plus the
next six days). In order to achieve Video Total (TV +
Online Video) SKO measures census data for online
video and combines this with panel data to calculate
the Online Video Total. Video Total was launched in
April 2017.
SKO also investigates new ways of viewing via so-
called ‘satellites’ studies that are conducted
alongside the currency measurement. This approach
allows SKO to measure new forms of viewing
behaviour (i.e. online video) without influencing the
core currency data.
Source: www.kijkonderzoek.nl
TV audience measurement II
175
Digital audience measurement
In 2015, de Verenigde Internet Exploitanten (VINEX) and
Stichting KijkOnderzoek (SKO) have started het
Nederlands Online Bereik Onderzoek (NOBO).
NOBO, run by Kantar TNS, is the new currency for digital
reach in 2016. NOBO is a collaboration involving more
than twenty major media companies. Participating online
media are provided with a tag. To also include global
players like Facebook, NOBO has built-in an additional
module that can report non-tagged sites.
NOBO is linked to SKO for online video. Also NOM is
involved for digital reach of magazines and newspapers.
DAM
Source: GfK April 2017 | http://www.adformatie.nl/nieuws/nederlands-bereiksonderzoek-nobo-officieel-van-start
There are two providers of digital audience ratings in the Netherlands: DAM and NOBO.
176
Radio audience measurement
NLO is a non-profit organization, organized as a Joint Industry Committee (JIC). The radio audience
ratings are based on a log of a panel of 7,500 respondents. The Media Standard Survey is used for
weighting.
NLO has developed a new technique for measuring listening behavior. A portable electronic device with
audio-matching technique will eventually replace the Radiolog. The new technique calculates radio reach
per minute instead of per 15-minute interval. The release date is not announced yet.
Source: NLO press release | 3 April 2017
‘Nationaal Luister Onderzoek’ (National Listening Research) is the primary
provider of the official radio audience ratings in the Netherlands.
177
Print audience measurement
NOM (Nationaal Onderzoek Multimedia) is responsible for carrying out and
reporting the national readership figures for daily newspapers and magazines. It
reports average issue readership (AIR), which is a currency for newspapers and
magazines in The Netherlands. From 2015, NOM also reports the average
circulation figures and digital census data of newspapers, magazines and
business magazines.
Source: http://www.nommedia.nl | 21st April 2017
NOM is organized as a Joint Industry Committee (JIC), and was founded in 2001.
In addition to the print currency, NOM also conducts a follow-up survey, asking about brand &
product usage as well as a host of lifestyle questions and various areas of interests and hobbies.
The combined survey, called NPDM, includes the print data as well as social demographic- and
lifestyle data and media usage. The data is based on 19,000 respondents (NL 13+) and weighted to
be nationally representative. It is published ones a year via a special software package.
178
Out of home audience measurement I
‘Het Buitenreclame Onderzoek’ (BRO) is the primary provider of the official OOH
audience ratings in the Netherlands. With the launch of BRO in 2011, the new
currency for audience measurement was avaliable for OOH: VAC, the visibility
adjusted contact.
Source: Het Buitenreclame Onderzoek, 21st April ‘17
VAC is based on multiple data sets regarding people,
movement and object classification:
Measuring of all traffic (Mobiliteitsonderzoek Nederland;
Field research to travel behaviour (TNS);
Inventory and classification of street objects;
Differentiates visibility between location of objects (near
pathway, railway stations, shopping centres,
supermarkets, parking garages, petrol stations and traffic
advertisement).
179
Out of home audience measurement II
For measuring all traffic TNS has carried out a travel survey
over a period of nine months (N=10.637). The ‘Gouden
Standaard 2010’ is used for weighting. For this study the
Netherlands has been divided into 30 regions, each one
around a city with at least 75,000 inhabitants. Each of the
individual regions/media owner packages can be analysed via
specialist software developed by BRO: Cafas. Pre-defined
male/female target audiences (13-75 years old) can be used.
Source: Het Buitenreclame Onderzoek, 2nd september ‘15
180
Cinema audience measurement
Commissioned by the ‘Nederlandse Vereniging van Bioscopen en Filmtheaters (NVBF)’ and
‘Filmdistributeurs Nederland (FDN)’, ‘Stichting Filmonderzoek’ periodically studies the range of
cinemas /movie theatres, the frequency of visits and the market share of Dutch cinema visitors. This
provides insight into cinema behavior of the Dutch population.
For the ‘bioscoopmonitor 2016’, quarterly fieldwork took place among a core group of panel members
(N= 11,422) of CentERdata and young panel members of LISS panel.
The panel members were asked whether – and if so, how often – they have been visited the cinemas
and/or movie theatre in the previous quarter and whether they have visited a Dutch movie.
181
Media:tijd is the most recent study released in Q2
2016 and covers time spend of Tuch consumers in
2015. The first release was in 2014 (data of 2013).
Media:tijd is a collaboration between:
Since Q2 2015 Crossmedia:Tijd is available. Crossmedia:Tijd is a
fusion of data from multiple reach and time spend currencies:
Source: Media:tijd 2015
(9 september – 11 oktober 2013)
(1 juli 2012 – 30 juni 2013)
(1 juli 2012 – 30 juni 2013) (28 april 2014 – 26 mei 2014)
(26 augustus – 17 november 2013)
The Crossmedia:Tijd study enables to create campaign scenarios
by using cross media reach.
BRO (JIC out of home reach measurement) has announced that
the OOH reach study will also be part of the next Crossmedia:Tijd
data fusion.
Media:tijd & Crossmedia:tijd
182
Nielsen
Ad spend measurement
Nielsen measures the gross ad spend in more than 1,300 individual channels / titles in 10
media types:
 Television
-Spot and billboards
 Radio
-Spot
 Internet
- Display (desktop, tablet, smartphone)
- Video (desktop, tablet, smartphone)
 Consumer magazines
 Newspapers
- National and local
 Consumer magazines
 Trade magazines
 Out of home
 Cinema
 Door drops
 Direct mail
The ad spend calculation is based on rate card. Discounts or special price agreements
are not taken into account to ensure a fair comparison of the media pressure between
brands and media. The ad spend data is updated twice a week.​

More Related Content

PDF
Dutch media landscape 2016 Q4 update by Starcom
PDF
Dutch media landscape 2016 Q3 update by Starcom
PDF
Dutch media landscape 2016 Q1 update by Starcom
PDF
Dutch media landscape 2016 Q2 update by Starcom
PDF
Dutch media landscape 2017 Q4 update by Starcom
PDF
Dutch media landscape 2015 Q4 update by Starcom
PDF
Dutch Media Landschap 2017 Q2 update by Starcom
PDF
Dutch media landscape 2017 Q3 update by Starcom
Dutch media landscape 2016 Q4 update by Starcom
Dutch media landscape 2016 Q3 update by Starcom
Dutch media landscape 2016 Q1 update by Starcom
Dutch media landscape 2016 Q2 update by Starcom
Dutch media landscape 2017 Q4 update by Starcom
Dutch media landscape 2015 Q4 update by Starcom
Dutch Media Landschap 2017 Q2 update by Starcom
Dutch media landscape 2017 Q3 update by Starcom

What's hot (20)

PPTX
Dutch Media Landscape 2015 Q2 Updated by Starcom
PDF
Dutch media landscape 2018 Q2 update by Starcom
PDF
Dutch media landscape 2018 Q1
PDF
Dutch media landscape 2013 Q4 update by Starcom
PDF
Dutch media landscape 2014 Q1 update by Starcom
PDF
Dutch media landscape 2015 Q3 update by Starcom
PDF
Dutch Media Landscape 2014 Q4 Updated by Starcom
PDF
The Dutch Digital agencies landscape
PDF
Dutch media landscape 2014 Q2 update by Starcom
PDF
Dutch Media Landscape 2018 by Publicis Spine
PDF
Adstream emea ai and the future of television advertising - e book
PDF
Media Market Digest May'18
PDF
Mobile marketing spends between europes 2 biggest markets
PDF
146676513 e marketer-mobile-ad-trends-in-france-and-germany-pdf
PDF
Media & Entertainment Report
PDF
Dutch media landscape 2013 Q3 update by Starcom
PDF
McKinsey Global Media Report 2015
PPTX
The Real World April 2016
PDF
Carat Trends 2021 - The Year of Emotionally Intelligent Marketing
PPT
Presentation On Mobile Marketing By Dan Sodergren From Your Marketing Trainer
Dutch Media Landscape 2015 Q2 Updated by Starcom
Dutch media landscape 2018 Q2 update by Starcom
Dutch media landscape 2018 Q1
Dutch media landscape 2013 Q4 update by Starcom
Dutch media landscape 2014 Q1 update by Starcom
Dutch media landscape 2015 Q3 update by Starcom
Dutch Media Landscape 2014 Q4 Updated by Starcom
The Dutch Digital agencies landscape
Dutch media landscape 2014 Q2 update by Starcom
Dutch Media Landscape 2018 by Publicis Spine
Adstream emea ai and the future of television advertising - e book
Media Market Digest May'18
Mobile marketing spends between europes 2 biggest markets
146676513 e marketer-mobile-ad-trends-in-france-and-germany-pdf
Media & Entertainment Report
Dutch media landscape 2013 Q3 update by Starcom
McKinsey Global Media Report 2015
The Real World April 2016
Carat Trends 2021 - The Year of Emotionally Intelligent Marketing
Presentation On Mobile Marketing By Dan Sodergren From Your Marketing Trainer
Ad

Similar to Dutch Media Landscape 2017 Q1 update by Starcom (20)

PDF
Digital trends in 2017
PDF
Trends to Watch in 2018
PDF
Edelman's Digital Marketing Trends for 2017
PDF
Digital Trends in 2017: Making Business Impact in a Changing World
PDF
Edelman-digital trends 2017
PDF
LCTop10DigitalTrends-FINAL-Report
PDF
Dentsu-e4m-DigitalReport-2025dentsu1.pdf
PDF
Posterscope predictions-2019
DOCX
Top 10 Global Consumer Trends 2020ALISON ANGUS AND GINA
PDF
Mindshare Trends 2024_0.pdf
PPTX
2013 digital trends for healthcare
 
PPTX
Digital Trends 2015
PDF
Marketing Trends 2016
PDF
Mindshare's Global POVs: 2015-2016
PDF
Top 10 India trends 2014 - 15 : DIGITAL & MOBILITY
PDF
Posterscope OOH 2017 predictions
PDF
Advertising in the Age of Multimedia
PPTX
Mobile predictions 2017: 76 predictions from 76 marketing influencers
PDF
2018 Digital and Tech Trends by Online Circle Digital
PDF
Dutch Media Landscape 2015 Q1 update by Starcom
Digital trends in 2017
Trends to Watch in 2018
Edelman's Digital Marketing Trends for 2017
Digital Trends in 2017: Making Business Impact in a Changing World
Edelman-digital trends 2017
LCTop10DigitalTrends-FINAL-Report
Dentsu-e4m-DigitalReport-2025dentsu1.pdf
Posterscope predictions-2019
Top 10 Global Consumer Trends 2020ALISON ANGUS AND GINA
Mindshare Trends 2024_0.pdf
2013 digital trends for healthcare
 
Digital Trends 2015
Marketing Trends 2016
Mindshare's Global POVs: 2015-2016
Top 10 India trends 2014 - 15 : DIGITAL & MOBILITY
Posterscope OOH 2017 predictions
Advertising in the Age of Multimedia
Mobile predictions 2017: 76 predictions from 76 marketing influencers
2018 Digital and Tech Trends by Online Circle Digital
Dutch Media Landscape 2015 Q1 update by Starcom
Ad

Recently uploaded (20)

PPTX
Assignment 2 Task 1 - How Consumers Use Technology and Its Impact on Their Lives
PPTX
Bata_MKT401 marketing career record.pptx
PDF
AI, Automation & SEO: The New Marketing PlaybooK - Eric Ritter, Digital Neighbor
PDF
Ramjilal Ramsaroop || Trending Branding
PDF
AI & Automation: The Future of Marketing or the End of Creativity - Barbara R...
PDF
Digital Marketing Trends: Experts Insights on How to Gain a Competitive Edge ...
PDF
Modernizing IT for the age of AI - Jason Aloia, Freshworks
DOCX
AL-ahly Sabbour un official strategic plan.docx
PDF
Google - Prompt Engineering - como ser um expert
PPTX
Best Leather Products in Trichy | minibaskett.pptx
PDF
The Social Proof Renaissance: Leveraging Testimonial Content for Trust, Conve...
PDF
How a Travel Company Can Implement Content Marketing
PDF
Fly Emirates SEO case study by Rakesh pathak.pdf
PDF
NeuroRank™: The Future of AI-First SEO..
PPTX
Your score increases as you pick a category, fill out a long description and ...
PDF
Buy LinkedIn Accounts In This Years 2025
PDF
AI & Automation: The Future of Marketing or the End of Creativity - Matthew W...
PPTX
Fix or Redesign it? Plan before you Blow Your Budget
PDF
Mastering the Art of the Prompt - Brantley Smith, HomePro Marketing
PDF
EVOLUTION OF RURAL MARKETING IN INDIAN CIVILIZATION
Assignment 2 Task 1 - How Consumers Use Technology and Its Impact on Their Lives
Bata_MKT401 marketing career record.pptx
AI, Automation & SEO: The New Marketing PlaybooK - Eric Ritter, Digital Neighbor
Ramjilal Ramsaroop || Trending Branding
AI & Automation: The Future of Marketing or the End of Creativity - Barbara R...
Digital Marketing Trends: Experts Insights on How to Gain a Competitive Edge ...
Modernizing IT for the age of AI - Jason Aloia, Freshworks
AL-ahly Sabbour un official strategic plan.docx
Google - Prompt Engineering - como ser um expert
Best Leather Products in Trichy | minibaskett.pptx
The Social Proof Renaissance: Leveraging Testimonial Content for Trust, Conve...
How a Travel Company Can Implement Content Marketing
Fly Emirates SEO case study by Rakesh pathak.pdf
NeuroRank™: The Future of AI-First SEO..
Your score increases as you pick a category, fill out a long description and ...
Buy LinkedIn Accounts In This Years 2025
AI & Automation: The Future of Marketing or the End of Creativity - Matthew W...
Fix or Redesign it? Plan before you Blow Your Budget
Mastering the Art of the Prompt - Brantley Smith, HomePro Marketing
EVOLUTION OF RURAL MARKETING IN INDIAN CIVILIZATION

Dutch Media Landscape 2017 Q1 update by Starcom

  • 1. 1
  • 2. 2 WHAT’S NEW Q1 2017 Instagram and Netflix keep on growing; they both enter top 10 apps based on reach. Positive figures market share TV for NPO (in particular NPO 1). New players within traditional TV landscape such as VICELAND and among online streaming services (Amazon Prime). Millennials watch 3 hours more online video per day than 55+. Increasing trend of cinema visitors continues in Q1 2017. Radio channels 3FM and BNR Nieuwsradio lost ground in terms of gross media spend. Blendle shapes online reading landscape by launching monthly subscription option Despite critical market, newspapers AD and De Volkskrant show significant increase in gross media spend. Instagram has highest increase in active users, Whatsapp and Facebook keep growing as well. YouTube is making progress towards people based marketing by avoiding cookies and pixels more. The outdoor rights of ‘RET’ (public transport Rotterdam) are granted to JCDecaux which benefits their position in the OOH landscape.
  • 3. 3 Starcom is the Human Experience Company. At Starcom we believe that experiences are the new communication currency. Experiences enrich lives and facilitate connections between brands and consumers. To create the right experience, understanding people is key. We need to understand our clients’ target audiences throughout the whole marketing funnel. Within this funnel, consumer media behavior plays a very important role. That’s why we no longer divide the media landscape based on media types, but on how people experience media. As such, we differentiate between five key Media Consumption Patterns (MCPs): Watching, Listening, Reading, Communicating and On the Go. Based on these MCPs we will guide you through the Dutch media landscape. We hope you will enjoy it. MEDIA PHILOSOPHY
  • 4. 4 In The Netherlands Starcom is part of Publicis One. Publicis One is a house of brands consisting of twelve labels in media, creative, technology, data & production. We work together in multidisciplinary teams and from one P & L. Customers have access to all our specialized labels, expertise and tools, and we provide them with the best integrated brand, media and (digital) communications solutions at local and international level. This will result in higher quality, speed and costs for our customers.
  • 5. 5
  • 6. 6 Watching Listening Reading Communicating, Social Media, Surfing online Overall media and consumer stats & figures On the go Appendix The Netherlands: general stats & figures CONTENT
  • 8. 8 Dutch population is still growing and getting older. The number of households has grown with 8% since 2006, mostly due to the increasing number of single person households (+16%). 2.502 2,906 4.644 4,815 2,26 2,17 1,0 1,3 1,6 1,9 2,2 2,5 0 2.000 4.000 6.000 8.000 2006 2007 2008 2009 2010 2011 2012 2013 2014 2015 2016 Averageno.peopleinHH #HH(in‘000s) Household (HH) size Single person household Multiple person household Average no. of people in HH Source: CBS, Statline, 2016. 16.334 16.979 16.000 16.200 16.400 16.600 16.800 17.000 17.200 Duizenden Population (in ‘000) 39,2 41.5 38 39 40 41 42 Average age 28,3 29,0 29,4 30,6 32,6 33,1 33,3 33,2 33,3 33,3 33,6 34,2 34,1 25 30 35 2003 2004 2005 2006 2007 2008 2009 2010 2011 2012 2013 2014 2015 €(in‘000s) Annual disposable HH income
  • 9. 9 In 2017 Q1 the Dutch consumer confidence index increased to 124, which is the highest level in at least 10 years and indicates optimism. Source: CBS, Statline, 2016 Source: Nielsen Consumer Confidence, Q4 2016 Consumer confidence worldwide – Q4 2016 -50 -40 -30 -20 -10 0 10 20 30 2008Jan 2008Apr 2008Jul 2008Oct 2009Jan 2009Apr 2009Jul 2009Oct 2010Jan 2010Apr 2010Jul 2010Oct 2011Jan 2011Apr 2011Jul 2011Oct 2012Jan 2012Apr 2012Jul 2012Oct 2013Jan 2013Apr 2013Jul 2013Oct 2014Jan 2014Apr 2014Jul 2014Oct 2015Jan 2015Apr 2015Jul 2015Okt 2016Jan 2016Apr 2016Jul 2016Okt 2017Jan Difference%positivevsnegativeanswers Dutch consumer confidence
  • 10. 10 Unemployment has dropped between 2014 and 2016 but that trend is, just like purchasing power, expected to come to a halt in 2017. Key Economic Indicators NL 2011 2012 2013 2014 2015 2016 2017** Inflation 2.3% 2.5% 2.6% 0.3% 0.2% 0.1% 0.9% Economic growth 1.2% -1.7% -0.5% 1.0% 2.0% 1.7% 1,6% Purchasing power* -1.0% -1.9% -1.3% 1.3% 1.1% 2.7% 0.7% Unemployed (in ‘000s) 389 469 647 660 614 555 560 Unemployment % 5.4% 5.3% 7.3% 7.4% 6.9% 6.2% 6.2% Source: CPB, Kerngegevenstabel 2012- 2015 and 2014-2017, August 9th 2016 (* median for all households; ** estimated figures)
  • 12. 12 Everything is SoLoMo nowadays Social Social media connects people worldwide with events, activities and each other Local Increasing ability for brands and organizations to respond to people’s whereabouts and out-of-home activities Mobile Mobile technology makes it possible to reach people anywhere, anytime Source: SMG Human Experience Strategists Center
  • 14. 14 10 global trends for consumers in 2017 Ageing: A changing narrative In 2017, almost a quarter of everyone on the planet will be over the age of 50, a record. These consumers will be older in terms of lifestyle and are more demanding in their consumptions needs (Longevity Economy). Consumers in training Today’s family demands are launching youngsters into consumption at an earlier stage. Increasingly, the input of children in purchasing decisions is welcomed by their parents, rather than being perceived as a nuisance. Extraordinary We have reached a point when mass-produced items have lost some of their shine. The internet is enabling consumers to purchase and discuss the “long tail” – unique, customized and exotic products and services. Faster shopping In 2017, consumers are impatient. The digital world has schooled more of them into becoming so-called “IWWIWWWI”: “I want what I want when I want it”. Get real: The allure of authenticity Authenticity is a standout consumer value in 2017, heralded by everyone from change makers and celebrities to supermarkets and chefs. Identity in flux The nature of identity itself is in flux with a more elastic understanding of ethnicity and gender. Brands need to rethink who their audiences really are. Personalize it In 2017, we will have come to accept the idea that an industrially-produced product can be customized or personalized, at least in part. Post-purchase In 2017, shoppers will be paying more attention to their post-purchase experience, becoming a more important part of the consumer journey. Privacy and security In our volatile world there is more focus is on personal safety and that of loved ones which results in greater leaning towards home and mobile cocooning. Wellness as status symbol The desire to be fit and healthier seems to be almost universal. Healthy living is becoming a status symbol, as more consumers opt to flaunt their passion for it. Source: Euromonitor International Top 10 Global Consumer Trends for 2017.
  • 15. 15 10 digital trends to watch in 2017: I Artificial Intelligence will not (yet) put marketers out of work Internet users still will not change their behaviors despite hacking scares Sometime in 2017, a live video will win a primetime-sized audience Chatbots are upcoming but will not yet become the reality 2017 will be the year of authetically mobile experiences Source: eMarketer Key Digital Trends for 2017, Dec 2016 Artificial Intelligence Privacy Live video Chatbot Mobile
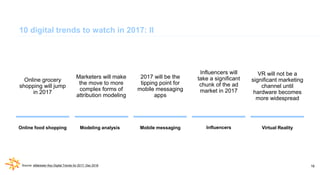
  • 16. 16 10 digital trends to watch in 2017: II Online grocery shopping will jump in 2017 Marketers will make the move to more complex forms of attribution modeling 2017 will be the tipping point for mobile messaging apps Influencers will take a significant chunk of the ad market in 2017 VR will not be a significant marketing channel until hardware becomes more widespread Source: eMarketer Key Digital Trends for 2017, Dec 2016 Online food shopping Modeling analysis Mobile messaging Influencers Virtual Reality
  • 17. 17 5 mobile trends for 2017 VR technology transforms everyday interactions and offers brands a more personal customer service channel Image recognition creates seamless shopping and opportunities for personalization With the use of chatbots, people move to non- human interaction for simple tasks Robots enter the consumer journey and can help brands by providing services Companies are turning focus toward Generation Z using mobile behavior patterns to design relevant services Source: MWC Mobile Trends 2017 Virtual Reality Image recognition Chatbots Robots Generation Z
  • 18. 18 Four important Entertainment & Media shifts which will determine the future of the Dutch media landscape Companies are transforming their business models and redefining their position in a changing landscape. These innovations are reflected in a further increase of digital Entertainment & Media spend, and a decrease in non-digital spend. The way media is consumed and is expected to develop differs crucially between age groups; e.g. born before/ after 1964. The younger audience will focus even more on digital media whereas the older audience will continue to spend most time and money on traditional media. Also in the Netherlands, digital giants like Google, Facebook and Apple are leading in the digital landscape. In order to survive in media it requires: owning a unique asset, providing a niche offering or fully embracing the change created by these giants. Shift 1 Business models Shift 2 Demographics Shift 3 Competition The growth of the Internet provides consumers with more options than ever. The willingness to shop online will continue to change how people spend their time and how companies make money. Shift 4 Consuming media Source: PWC Entertainment & Media Outlook forecast for The Netherlands 2016-2020
  • 20. 20 Competitive reporting in the Netherlands Competitive reporting is based on gross media spend. Bear in mind that most advertisers profit from (heavy) discounting, especially on TV, so the difference with actual spend can be significant. In the gross spend reporting digital spend is not fully reported. For example, search, social media advertising and video are (partially) excluded. Source: Gross spend: Nielsen, 2016 | Net spend: Nielsen jaarrapport Netto Media Bestedingen 2016 | Note: For digital only net spend is available. 0 1.000 2.000 3.000 4.000 Cinema Newspapers Online Out Of Home Magazines Radio TV €millions Media spend 2016 Gross Net
  • 21. 21 Decrease in gross media spend between 2016 and 2015 (excluding digital spend). Stable spend level in 2017 Q1. 0 1.000 2.000 3.000 4.000 5.000 6.000 7.000 8.000 €millions Gross media spends Source: Nielsen, 2012 – 2017 Q1 | Note: digital spend not included. +3,1 % YoY +4,9% YoY -1,1% YoY -5,3% YoY -0,3% YoY
  • 22. 22 After a substantial decline for newspaper spend between 2015 and 2016, spend levels seem to stabilize in Q1 2017. 0 1.000 2.000 3.000 4.000 Cinema Newspapers Direct Mail Door Drops Out Of Home Consumer Magazines Radio TV Trade Press €millions Gross media spend per medium type across time 2013 2014 2015 2016 2016 Q1 2017 Q1 Source: Nielsen, 2012 – 2017 Q1 | Note: digital spend not included.
  • 23. 23 In contrast to the last few years, in Q1 2017 share of spend of newspapers has increased and share of spend for TV has decreased. Source: Nielsen, 2012-2017 Q1 | *Note: digital spend is not included. 18% 17% 16% 16% 11% 13% 15% 7% 7% 6% 4% 3% 4% 5% 2% 2% 2% 2% 2% 2% 2% 7% 7% 7% 7% 7% 8% 8% 7% 7% 6% 6% 6% 5% 6% 9% 10% 10% 11% 12% 12% 12% 48% 48% 52% 53% 57% 55% 52% 1% 1% 1% 1% 1% 1% 1% 0% 10% 20% 30% 40% 50% 60% 70% 80% 90% 100% 2012 2013 2014 2015 2016 2016 Q1 2017 Q1 Media mix Trade Press TV Radio Consumer Magazines Out Of Home Door Drops Direct Mail Newspapers Cinema
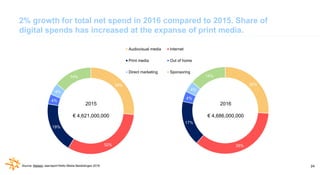
  • 24. 24 2% growth for total net spend in 2016 compared to 2015. Share of digital spends has increased at the expanse of print media. Source: Nielsen Jaarraport Netto Media Bestedingen 2016 26% 35% 17% 4% 4% 14% 26% 32% 19% 4% 4% 14% Audiovisual media Internet Print media Out of home Direct marketing Sponsoring 2015 € 4,621,000,000 2016 € 4,686,000,000
  • 25. 25 Spend of online advertising increased by 11% in revenue in 2016 41% 14% 45% Display Classifieds Search Total online ad spend 52% 16% 18% 14% Embedded Other & text links Video Interruptive Online display spend Source: Deloitte & IAB. Nederland, IAB Report on Online Advertising Spend, The Netherlands 2016, December 2016 2016: 1,683 m€ 2015: 1,512 m€ 2016: 683 m€ 2015: 615 m€
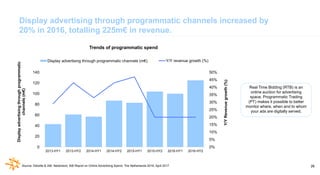
  • 26. 26 0% 5% 10% 15% 20% 25% 30% 35% 40% 45% 50% 0 20 40 60 80 100 120 140 2013-HY1 2013-HY2 2014-HY1 2014-HY2 2015-HY1 2015-HY2 2016-HY1 2016-HY2 Y/YRevenuegrowth(%) Displayadvertisingthroughprogrammatic channels(m€) Trends of programmatic spend Display advertising through programmatic channels (m€) Y/Y revenue growth (%) Real Time Bidding (RTB) is an online auction for advertising space. Programmatic Trading (PT) makes it possible to better monitor where, when and to whom your ads are digitally served. Source: Deloitte & IAB. Nederland, IAB Report on Online Advertising Spend, The Netherlands 2016, April 2017 Display advertising through programmatic channels increased by 20% in 2016, totalling 225m€ in revenue.
  • 27. 27 11% 13% 16% 16% 18% 17% 16% 18% 17% 15% 13% 14% 54% 55% 55% 52% 2013 2014 2015 2016 Allocation of display revenue per format Video Text links/Other Interruptive Embedded (e.g. banners) Video and rich media formats show growth over the last years. Share of spend of banners slightly decreased but remains popular. Source: Deloitte & IAB. Nederland, IAB Report on Online Advertising Spend, The Netherlands 2016, April 2017
  • 28. 28 Growth in total net media spend will mainly be a result of a significant rise in online spend. Print spend is expected to further decrease. 3.967 3.770 3.649 3.730 3.773 3.821 3.877 3.959 3.400 3.600 3.800 4.000 2011 2012 2013 2014 2015 2016 2017 2018 €millions Forecast net spend 0,8% -5,0% -3,2% 2,2% 1,2% 1,3% 1,5% 2,1% -6% -3% 0% 3% 6% Forecast net spend Change (%) to previous year - 500 1.000 1.500 2.000 2.500 Newspapers Magazines TV Radio Cinema Outdoor Internet €millions Net spend per medium type 2011 2012 2013 2014 2015 2016 2017 2018 Source: ZOG Adspend Forecast Netherlands – December 2016 (1980-2018)
  • 29. 29 Top 10 advertisers in Q1 2017 is dominated by FMCG and retail Source: Nielsen, Q1 2017 | Note: gross online spend not included No. Advertiser Category Gross spend Q1 2017 1 Unilever Nederland Rotterdam FMCG €24,479,789 2 Procter & Gamble Nederland Rotterdam FMCG €22,901,254 3 Corendon International Travel Travel €21,192,478 4 Renault Nederland Schiphol-Rijk Automotive €20,725,256 5 A.S. Watson Europe FMCG €20,004,224 6 Vodafone Maastricht Telecom €16,380,283 7 Lidl Nederland Huizen Retail €14,591,494 8 Albert Heijn Zaandam Retail €14,278,302 9 Jumbo Supermarkten Veghel Retail €14,094,758 10 Reckitt Benckiser Nederland Hoofddorp FMCG €12,991,361
  • 30. 30 Top 10 brands in Q1 2017 is dominated by supermarket chains Source: Nielsen, Q1 2017 | Note: gross online spend not included. No. Brand Category Gross spend Q1 2017 1 Corendon Travel €19,492,146 2 Kruidvat Retail €17,937,905 3 Lidl Retail €14,591,494 4 Jumbo supermarkten Retail €14,094,758 5 Albert Heijn Retail €13,998,700 6 Renault Automotive €12,668,859 7 Vodafone Telecom €10,302,059 8 Nationale postcode loterij Lottery €10,078,202 9 KPN Telecom €10,026,471 10 Vriendenloterij Lottery €8,997,199
  • 31. 31 Total sponsor spend and average sponsor spend slightly decreased Total spend top 100 sponsors 2015 2016 Index Total sponsor spend €283,775,000 €274,255,000 97 Average sponsor spend (per brand) €2,837,750 €2,742,550 97 - 100 200 300 400 500 600 Sports Art & Culture Lifestyle Society Media (non-spot) €millions Sponsor spend by type of sponsorship 2010 2011 2012 2013 2014 2015 2016 Source: SponsorMonitor 2016 (Spend is an estimate based on input provided by advertisers. Only direct sponsor budget is included; any activation budget is excluded.)
  • 32. 32 56% 14% 2% 10% 18% Sponsor contracts Sports Art & Culture Lifestyle Society Media (non-spot) In 2016, 283 new (and renewed) sponsorship contracts were signed. This implies a decrease of 42 contracts compared to 2015. The total value of all contracts in 2016 was €230,000,000, averaging €812,720 per contract*. Both the total and the average increased substantially compared to 2015 (total: €154.000.000; average: €474.000 ). Reasons for this increase are big sponsor contracts of Energie direct with football club PSV and the ING Sponsorship with the Royal Dutch Football Association. Source: SponsorMonitor 2016, 2017 (Estimated spend based on input provided by advertisers. Only direct sponsor budget is included; any activation budget is excluded). | Note: The value of contracts differs from the annual sponsorship spend shown on other slides. This can be explained by contracts covering longer periods than just one calendar year.
  • 33. 33 Rabobank is still by far the biggest sponsor. ING, Adidas and Ziggo showed increase in gross sponsor spend. No. Brand Gross spend 2015 Gross spend 2016 1 Rabobank € 34,000,000 € 32,000,000 2 ING € 14,000,000 € 14,500,000 3 Adidas € 13,450,000 € 14,000,000 4 ABN AMRO € 13,000,000 € 12,500,000 5 KPN € 12,700,000 € 12,500,000 6 Heineken € 11,200,000 € 11,000,000 7 Nike € 11,000,000 € 11,000,000 8 Ziggo € 9,800,000 € 11,000,000 9 VriendenLoterij € 9,600,000 € 8,500,000 10 Amstel € 8,500,000 € 7,500,000 Source: SponsorMonitor 2016 (Spend is an estimate based on input provided by advertisers. Only direct sponsor budget is included; any activation budget is excluded)
  • 35. 35 Dutch consumers spend more than 3 hours per day on media* 2:29 0:14 1:01 2:01 4:10 2:26 3:08 8:28 2:25 0:12 0:52 2:07 0:57 4:18 3:36 9:29 0:00 1:12 2:24 3:36 4:48 6:00 7:12 8:24 9:36 10:48 12:00 Eating and personal care Other On the go Housework, groceries, shopping Work, study, school Leisure time Media* Sleeping Hours per day Main activities – average time spent per day Weekend Weekdays Source: Media:tijd 2015, base: all adults 13+ (N=2,953) | * media consumption not combined with any other activity
  • 36. 36 Watching and listening are most time consuming media activities 2:42 3:04 0:43 1:06 0:18 0:18 0:20 Listening (online or offline) Watching (online or offline) Reading (paper or electronic) Communicating (through media) Gaming (electronic) Internet other Media other Media activities – average time spent per day Hours per day Source: Media:tijd 2015, base: all adults 13+ (N=2,953) Definitions: Listening: to radio, (own) music/audio – offline, online or apps + live or non-linear Watching: TV programs, videos or pictures - offline, online or apps + live or non-linear Reading: books, magazines, newspapers, door drops, newsletters – offline, online or apps Communicating: text messages, chat, e-mail, social media, forums, letters – offline, online or apps Gaming: consoles or game websites - offline, online or apps – except for board games and gambling Internet (other): online shopping, e-banking, search information – offline, online or apps Media (other): administration on computer, installation and use of software
  • 37. 37 Overall media consumption shows stable patterns. Time spent watching shows strong peak in the evening, for listening this is higher during the day. 0 10 20 30 40 Minutes Media activities on an average day Listening (online or offline) Watching (online or offline) Reading (paper or electronic) Communicating (through media) Gaming (electronic) Internet other Media other Source: Media:tijd 2015, base: all adults 13+ (N=2,953)
  • 38. 38 0% 25% 50% 75% 100% 2010 2011 2012 2013 2014 2015 2015-II2016-I Honderden TV No answer TV heavy (24+ hours per week) TV mid (14-24 hours per week) TV light (0-14 hours per week) No TV 0% 25% 50% 75% 100% 2010 2011 2012 2013 2014 2015 2015-II2016-I Honderden Radio No answer No answer Radio heavy (20+ hours per week) Radio mid (5-20 hours per week) Radio light (0-5 hours per week) No Radio Time spent online has increased over the years 0% 25% 50% 75% 100% 2010 2011 2012 2013 2014 2015 2015-II2016-I Honderden Online No answer Internet heavy (13+ hours per week) Internet mid (5-13 hours per week) Internet light (0-4 hours per week) No Internet connection Source: NPDM releases: 2010 I – 2010 II to 2015 II – 2016 I, base: All adults 13+ (N= 17.171)
  • 40. 40 Slightly higher smartphone penetration (83%) in 2016 39% 45% 48% 58% 65% 67% 70% 76% 80% 80% 83% 0% 20% 40% 60% 80% 100% Historical development of smartphone penetration in NL 11.1 million Smartphone users in 2016 Source: “Trends in Digital Media”, GfK Intomart, Dec 2016, base: online population 13+ (N=1,251); Global Mobile Landscape 2015, eMarketer. 13.9 million Smartphone users in 2019
  • 41. 41 All age groups are becoming more mobile over the years. Significant increase of tablet usage among age group 13-17. 0% 25% 50% 75% 100% Men Women Age 13-17 Age 18-34Age 35-49 Age 50-64 Age 65+ % using a tablet 0% 25% 50% 75% 100% Men Women Age 13-34 Age 35-49 Age 50-64 Age 65+ % using a smartphone dec-12 jun-13 dec-13 jun-14 dec-14 jun-15 dec-15 dec-16 Source: “Trends in Digital Media”, GfK Intomart, Dec 2016, base: online population 13+ (N=1,150)
  • 42. 42 0 1 2 3 4 5 6 7 8 9 10 11 12 13 14 15 Averagetimespentinminutes Smartphone and tablet usage during the day Smartphone '15 Tablet '15 Smartphone '14 Tablet '14 Tablet and mobile show a similar pattern in usage during the day, with a peak in the evening. Time spent on both devices increased significantly. Source: Media:tijd 2014, base: 13+ (N=2,989) | Media:tijd 2015, base: 13+ (N=2,953)
  • 43. 43 Watching TV still most popular via traditional TV set despite growing popularity of other devices. Smartphone beats laptop for using the Internet.71,3% 23,8% 28,1% 17,0% 9,1% 54,0% 10,7% 28,1% 17,0% 8,7% 74,8% 16,1% 29,0% 14,8% 14,1% 56,6% 23,0% 21,1% 12,5% 6,8% 91,5% 21,1% 3,6% 0,9% 2,6% 11,1% 2,6% 72,5% 74,9% Medium type per device Laptop PC/desktop Mobile phone Tablet Traditional TV set* Media player* Game console* Paper* Source: Media Standard Survey 2016 (N=5,100), Base: All adults 13+, (* device is not relevant for each medium type)
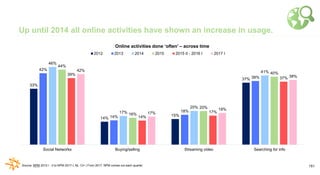
  • 45. 45 Percentage of Dutch population owning phones and tablets is growing strongly, just like social usage. The number of Newspaper readers decreased. 0% 20% 40% 60% 80% 100% Broadcast TV viewers Mobile phone owners Internet users Radio listeners Magazine readers Smartphone owners Social network users Mobile phone internet users Tablet owners Newspaper readers Digital video viewers Cable TV viewers Media penetration in the Netherlands, 2011 - 2015 2011 2012 2013 2014 2015 Source: The global media intelligence report (November 2016) – eMarketer & SMG
  • 46. 46 The Netherlands has the 9th highest internet penetration worldwide. Mainly wealthy and/or relatively small countries in top 20. 80% 90% 100% Internet access by country (top 20) in 2016 Source: http://www.internetlivestats.com/internet-users-by-country/, penetration based on total population | https://www.emerce.nl/nieuws/75plussers-sterkst-groeiende-groep-internetters In the Netherlands, Internet penetration among people older than 75 has grown substantially. In 2016, 60% of 75+ has Internet access and 50% used it. In 2012, access and usage was around 40% for this specific age group.
  • 47. 47 90% 44% 25% 92% 45% 32% 93% 45% 40% 94% 46% 49% 95% 48% 55% 95% 50,70% 59,80% At home At work Elsewhere Internet access by location 2011 2012 2013 2014 2015 2016 Internet access ‘elsewhere’ (on the go) has increased substantially Source: Media Standard Survey 2011-2016 (N= 5,100), base: All adults 13+.
  • 48. 48 Google is leading in terms of reach across platforms Source: GfK DAM, base: 13+, average monthly reach Q1 2017 (all platforms) No. Top 10 brands Average monthly reach 1 Google 77% 2 Facebook 67% 3 WhatsApp Messenger 63% 4 Youtube 60% 5 Facebook Messenger 51% 6 Google maps 51% 7 Google Search (app) 49% 8 Bol.com 47% 9 Digid.nl 43% 10 Marktplaats.nl 42%
  • 49. 49 Main mobile activities are focused on communication in every possible way. Banking, online shopping and TV increased in usage. 83% 76% 29% 14% 22% 37% 43% 16% 70% 5%52% 67% 26% 83% 65% 27% 72% Mobile activities Internet E-mail Video TV Radio Navigation Games As e-ticket Camera Books Online banking Social media Online shopping Call Text messages Music Chat Source: “Trends in Digital Media”, GfK Intomart, Dec 2016, base: online population 13+ (N=1,065)
  • 50. 50 All-round activities for tablet such as surfing the web, e-mail, social media and games. Less visual activities (photos, video) than on mobile. 29% 32% 3% 58% 13% 34% 36% 8% 15% 85% 55% 66% 13% 29% 4%16% 4% Tablet activities Video TV Text messages Social media Radio Online shopping Online banking Navigation Music Internet Games E-mail Chat Camera Call Books As e-ticket Source: “Trends in Digital Media”, GfK Intomart, Dec 2016, base: online population 13+ (N=824)
  • 51. 51 Smartphone is the most used device for communication, especially among younger age groups. 7% 7% 19% 19% 48% 1% Share of all communication per device Landline/home phone Tablet Laptop PC Smartphone Other 0% 20% 40% 60% Total 13+ Men Women 13-19 20-34 35-49 50-64 65+ Share of communication per device per age group Landline/home phone Smartphone Tablet Laptop PC Source: Media:tijd 2015, base: all adults 13+ (N=2,953)
  • 52. 52 0 10 20 30 40 50 Smartphone Average number of mobile apps 2011 2012 2013 2014 2015 2016 In 2016, also the number of mobile apps seems to stabilize Average # of apps on mobile in 2016: 27 Source: “Trends in Digital Media”, GfK Intomart, Dec 2016, base: online population 13+ (N=1,065) 0 10 20 30 40 50 Tablet Average number of tablet apps 2011 2012 2013 2014 2015 2016 Average # of apps on tablet in 2016: 24
  • 53. 53 WhatsApp most popular mobile app. Facebook and YouTube show high reach on both devices. Netflix and Instagram are new in top 10. Source: GfK DAM, base: 13+, average monthly reach Q1 2017 25% 26% 27% 29% 38% 41% 42% 55% 50% 63% Instagram Drive Google Play-services Gmail Google Search Facebook Messenger Google Maps Youtube Facebook WhatsApp Messenger Overall top smartphone apps Phone reach % 11% 11% 11% 12% 16% 18% 20% 21% 32% 35% ING Bankieren NOS Netflix Marktplaats Gmail Google Maps Facebook Messenger Google Search YouTube Facebook Overall top tablet apps Tablet reach %
  • 55. 55 MCP: Watching The way people consume audio visual content is rapidly changing. These days the consumption of video content can be on multiple devices, in multiple places and at every moment. As a result, the way consumers experience video content is changing as well.
  • 56. 56 88% Households with digital TV 1.6 Average # of TVs per household 36.8% Hard disc recorder ownership 2015 31% 37% Connected TV penetration 2015 vs. 2016 Source: Media Standard Survey 2016 Trends & developments – I
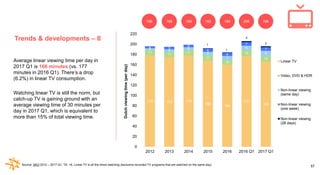
  • 57. 57Source: SKO 2012 – 2017 Q1, TA: +6, Linear TV is all the direct watching (exclusive recorded TV programs that are watched on the same day) Average linear viewing time per day in 2017 Q1 is 166 minutes (vs. 177 minutes in 2016 Q1). There’s a drop (6.2%) in linear TV consumption. Watching linear TV is still the norm, but catch-up TV is gaining ground with an average viewing time of 30 minutes per day in 2017 Q1, which is equivalent to more than 15% of total viewing time. 178 175 178 168 160 177 166 11 11 11 11 10 12 12 3 4 5 6 7 8 9 4 5 5 6 6 7 7 1 1 2 2 0 20 40 60 80 100 120 140 160 180 200 220 2012 2013 2014 2015 2016 2016 Q1 2017 Q1 Dutchviewingtime(perday) Linear TV Video, DVD & HDR Non-linear viewing (same day) Non-linear viewing (one week) Non-linear viewing (28 days) 196 Trends & developments – II 196 195 199 192 184 206
  • 58. 58 Trends & developments – III RTL and Triade Media extend their portfolio with three international channels: AMC, Food Network and Fine Living. AMC offers many popular movies and TV shows from all genres and has own productions. Food Network focuses on cooking shows and Fine Living offers programs about home decoration and interior design. Online publisher VICE has started a new TV-channel for millennials: VICELAND. The new TV-channel launched March 1st and is exclusively accessible for Ziggo subscribers. Benelux-CEO Thijs Boon states that VICELAND offers exclusive content with a focus on youth culture and hereby wants to become the place to reach millennials offline. Source: http://www.emerce.nl/nieuws/uitgesteld-kijken-naar-25-procent-in-2025 | http://www.adformatie.nl/nieuws/vice-komt-nederland-met-tv-kanaal-voor-millennials | http://www.adformatie.nl/achtergrond/vice- benelux-ceo-thijs-boon-viceland-moet-het-leidende-tv-kanaal-voor-jongeren-worden | | https://www.rtl.nl/adverterenbij/nieuwsberichten/rtl-en-triade-media-breiden-portfolio-uit According to research of ABN Amro, postponed TV-watching is winning popularity. It is expected that 25% of all TV content will be consumed non-linear within the next 10 years.
  • 59. 59 Consumers will be exposed to more advertising on smart TV’s of Philips. After Philips updates the software consumers will see more ads in the menu’s. TP Vision, the manufacturer of Philips TV’s, has a lot of information about viewing behavior. In the near future, Philips will possibly be capable of personalized advertising. More brands (such as Samsung) are currently working on this development since watching linear TV is decreasing and people are using more apps and online services. The number of house holds with smart TV’s is still increasing but the growth seems to flatten out, reports Telecompaper. With smart TV’s people have the ability to connect to the Internet to make use of services as Netflix and YouTube and new services like Amazon Prime. Not every smart-TV is connected to Internet, but at this moment more than 50% of all house holds has at least one ‘connected’ television. https://www.emerce.nl/nieuws/aantal-huishoudens-smart-tv-stijgt-groei-neemt-af | http://nos.nl/artikel/2154753-meer-reclame-op-smart-tv-s-van-philips.html Trends & developments – IV : Smart TV
  • 60. 60 Dutch TV channels, with advertising possibilities (I/II) STER (Public Broadcasting) RTL RTL/Triade SBS Source: retriever.nl, Q1 2017 | Note: As of January 2016 RTL is also responsible for the advertising on the Triade channels. Note: RTL Lounge, RTL Crime, Boomerang, Telekids and Crime + Investigation are paid (digital) channels Note: mostly paid (digital) channels
  • 61. 61 Dutch TV channels, with advertising possibilities (II/II) The Walt Disney Company Benelux 57 regional channels Note: Disney XD shares a channel with Veronica Source: retriever.nl, Q1 2017
  • 62. 62 Market share of NPO is increasing. In Q1 2017, SBS and BrandDeli seem to show a slight decrease in market share. 0% 10% 20% 30% 40% NPO RTL/Triade SBS BrandDeli TV market share 2014 2015 2016 2017 Q1 Source: SKO 2014 – 2017 Q1, 02.00-26.00, base: all adults 13+| Note: Full audit channels only.
  • 63. 63 NPO 1 continues trend of increase in market share Source: SKO 2014 – 2017 Q1, 02.00-26.00 base: all adults 13+ | Note: Full audit channels only. STER RTL/Triade SBS BrandDeli Disney Other 0 5 10 15 20 25 30 % Market share 2014 2015 2016 2017 Q1
  • 64. 64 Growth in gross media spend for all SBS channels (+11%). RTL 4 shows strongest decline. Source: Nielsen, 2016 Q1 and 2017 Q1. | Note: Only gross spend for TV. | Note: As of January 2016 RTL is also responsible for the advertising on the Triade channels. SBSRTLSTER BrandDeli RTL/Triade Disney 0 50 100 150 200 250 €millions Gross media spend per channel Q1 2016 Q1 2017 - 10%
  • 65. 65 TV spend shows a clear seasonality pattern with highest spend levels in spring and fall and relatively low spend during summer. Monthly indices are used to reflect the seasonality in rate cards. Source: Nielsen, 2013 – 2017 Q1 | Note: Only gross spend for TV. 0 100 200 300 400 500 January February March April May June July August September October November December Grossmediaspend(inmillion€) TV seasonality (based on spend) 2013 2014 2015 2016 2017 Q1 Total spend 2017 Q1: € 776,092,821 Total spend 2016 Q1: € 774,534,884 Total spend 2015 Q1: € 727,121,996 Total spend 2014 Q1: € 732,229,310 Total spend 2013 Q1: € 621,144,126
  • 66. 66 Retail brands (supermarkets specifically) are main TV advertisers Source: Nielsen, 2017 Q1 | Note: Only gross spend for TV. No. Brand Category TV gross spend Q1 2017 1 Jumbo supermarkten Retail €12,805,780 2 Kruidvat Retail €10,327,439 3 Albert Heijn Retail €10,140,184 4 Lidl Retail €8,817,451 5 Coop Retail €8,087,164 6 Renault Automotive €7,898,370 7 Corendon Travel €7,005,157 8 Omega Pharma FMCG €6,249,780 9 HG FMCG €6,207,113 10 Plus Retail €6,144,100
  • 67. 67 The market for young females is more saturated than for young males Source: SKO, 2017 Q1, all day (02:00 – 26:00), base: all adults 13+ Female
  • 68. 68 Multi-tasking on phone while watching TV is becoming more popular and consists mainly of social media, chatting, emails and games 0% 10% 20% 30% 40% 50% 60% Desktop PC e-Reader Laptop PC Mobile phone Tablet device None of the above Multi tasking while watching TV Q1 2016 Q2 2016 Q3 2016 Q4 2016 Q1 2017 0% 10% 20% 30% 40% 50% Multi tasking activities Q1 2016 Q2 2016 Q3 2016 Q4 2016 Q1 2017 Source: GlobalWebIndex, 2016-2017 Q1, Base: Internet users NL16+
  • 69. 69 Multitasker is mostly 16-34 years old with average to high income and rather interested in gadgets, fashion and sports 51% 49% 24% 22% 21% 21% 13% 0 50 100 150 0% 25% 50% % Index Source: GlobalWebIndex, 2017 Q1, Base: Internet Users NL16+ (N= 1300), TA: MultiTasker while watching TV (N=365) 23% 51% 26% Low (Bottom 25% income) (index 92) Mid (Mid 50% income) (index 101) High (Top 25% income) (index 107) Interests 0 50 100 150 0% 10% 20% 30% 40% 50% 60% % Agree Index Age groups Interests Income
  • 71. 71 Two options for non-linear TV viewing: On TV screen (smart TV, settopbox, video or DVD recorder) Non-linear TV viewing within 6 days of programming is added to the regular TV viewing ratings. Online (laptop/tablet/mobile) VIDEO ON DEMAND Non-linear TV-viewing (broadcast by traditional broadcasters, i.e. RTL, SBS and STER) Paid professional content via non-traditional broadcasters (i.e. Netflix, Videoland) ‘Video on demand’ definition clarified Non-paid (user-generated/professional/branded) content (i.e. YouTube, Dumpert, LINDA.tv)
  • 72. 72 Trends & developments- I 49% of all Dutch consumers watch paid online video content 69% of all consumers have a payed VoD subscription 14% have two subscriptions 17% have two or more 39% of all VoD subscribers have downgraded their linear TV subscription For consumers without a VoD subscription this is 15% Source: GfK Viewscape 2017, base: NL18+
  • 73. 73 Trends & developments – II STER starts a trial of programmatic buying on ‘NPO Gemist’ with technology of SpotX. When watching NPO Gemist, people will be exposed to more relevant ads, matched to their own consumer profile. YouTube Red, a new, paid streaming service of YouTube will be launched in Europe in 2017. YouTube Red shows videos without advertising and has unique content, just like competitors Netflix and Amazon. It is not yet confirmed that/when YouTube Red will be launched in the Benelux. Netflix grew in 2016 to 94 million subscribers and to 2,4 billion dollar revenue worldwide. The biggest growth originates from outside the US. In the Netherlands, Netflix reaches more than 28% of all house holds. However, 41% quit Netflix after the free trial. Source: http:// http://www.emerce.nl/nieuws/ster-tekent-spotx-programmatic-videocampagnes | http://www.emerce.nl/nieuws/youtube-red-europa | https://www.emerce.nl/nieuws/resultate-netflix-beter-dan- verwacht I https://tweakers.net/nieuws/118993/amazon-maakt-prime-video-dienst-beschikbaar-in-nederland-en-belgie.html Amazon launched its new video streaming service: Amazon Prime. From December 2016 on, the service is available in the Netherlands. Amazon offers movies and TV-shows, including exclusive content. A subscription costs 6 euro p/month, the first half year 3 euro p/month.
  • 74. 74 Trends & Developments - III : Streaming services with opportunity to watch content offline Videoland is planning to offer content offline. At the end of 2016 it is already possible to watch children’s programs offline. In 2017 more content will be available to watch without an Internet connection. Videoland is a streaming service of RTL and offers national and international movies and TV shows. Netflix seems to be following the trend of music streaming services to let subscribers consume content offline. Currently it is only possible to watch Netflix- original content offline. Netflix is dependent on responsible film companies in order to offer more content in the offline version. Source: http://www.emerce.nl/nieuws/videoland-maakt-offline-kijken-kinderfilms-series-mogelijk | http://www.metronieuws.nl/xl/digitaal/2016/06/netflix-test-met-nieuwe-offline-modus
  • 75. 75 Main players VoD – non-linear TV viewing Hard disk recorder ‘RTL XL’ & ‘Kijk’ A selection of TV content from the RTL/SBS channels. It also includes previews of shows and a selection of movies and series (mostly paid content). RTL offers content on subscription base; ‘RTL XL Premium’ (€4.- per month). Available via laptop, smartphone, tablet and smart TV. ‘NPO Plus’ (NPO) TV content from all the public TV channels. Free and available via laptop, smartphone, tablet and smart TV. NLziet (NPO, RTL, SBS) NLziet is a subscription (€8.- per month) for the three online platforms NPO Plus, RTLXL and Kijk. Subscribers can watch all content of Dutch TV up until 365 days after broadcasting. No advertising. Available via laptop, smartphone and tablet. ‘KNIPPR’ KNIPPR offers a fixed, online TV subscription with options to extend with additional channels for €11 per month.
  • 76. 76 Main players VoD – non-traditional Cinema media owner Pathé developed a platform to watch movies at home (pay-per-movie). Available via laptop, tablet, smartphone and smart TV. Netflix entered the Dutch market in September 2013. For €8.- per month users have a basic account and have unlimited access to movies and series. Next to the basic subscription Netflix also offers a standard (€10.-) and premium (€12.-) subscription. Available via laptop, tablet, smartphone and smart TV. YouTube offers mostly user-generated content. The first paid channels have already been introduced. Available via laptop, tablet, smartphone and smart TV. Videoland was once the biggest offline movie rental company in the Netherlands. They now offer a lot of on-demand movies (pay-per-movie). Available via laptop, tablet, smartphone and smart TV. In August 2013 RTL took over Videoland. Ziggo introduced the Movies & Series XL service in 2017. Combined with a TV subscription (including 55 TV channels) it is possible to watch all HBO produced content from the last years on demand for €7.- per month on TV, laptop, tablet and smartphone. OTHER
  • 77. 77 YouTube is leading VoD channel followed by Netflix. Both NPO and KIJK show annual growth. Source: GfK DAM, base: 13+, average monthly reach 2016 – 2017 Q1 0% 10% 20% 30% 40% 50% 60% 70% 80% 90% Jan '16 Feb '16 Mar '16 Apr '16 Mei '16 Jun '16 Jul '16 Aug '16 Sep '16 Oct '16 Nov '16 Dec '16 Jan '17 Feb '17 Mar '17 Video on Demand – average monthly reach YouTube RTL XL Netflix NPO gemist Vimeo KIJK.nl NLziet
  • 78. 78 Netflix is especially popular among younger age groups. For SBS, it is more difficult to reach youngsters (13-19). 0% 5% 10% 15% 20% 25% 30% 35% 40% 45% Total 13+ 13-19 years 20-34 years 35-49 years 50-64 years 65 + Monthly reach Netflix RTL XL NPO gemist KIJK.nl Source: DAM 13+, Jan 2017 – Mar 2017 (average monthly reach) | SKO 13+, Jan 2017 – Mar 2017, all day, average monthly reach within period STER: 97% RTL: 96% SBS: 95% STER: 94% RTL: 93% SBS: 92% STER: 98% RTL: 98% SBS: 97% STER: 99% RTL: 99% SBS: 98% STER: 96% RTL: 96% SBS: 95% STER: 93% RTL: 93% SBS: 88%
  • 79. 79 Watching TV on smartphone is gaining popularity Source: GfK Trends in Digitale Media, Dec 2016 (N=1.251) | Source: GWI on-demand media service Q4 2015 – Q1 2017, base: NL 20-49 28% 30% 11% 18% 26% 31% 8% 24%24% 32% 12% 26% 25% 31% 14% 27% 23% 31% 15% 26% 24% 29% 15% 26% 21% 28% 17% 25% 0% 5% 10% 15% 20% 25% 30% 35% Desktop (PC) Laptop/Netbook Smartphone Tablet Devices used by people to watch television Jun 13 Dec 13 Jun 14 Dec 14 Jun 15 Dec 15 Dec 16 21,0% 11,9% 3,4% 27,2% 15,1% 5,6% 31% 11% 4% 35,2% 14,1% 2,9% 38,2% 17,2% 5,6% 0% 5% 10% 15% 20% 25% 30% 35% 40% 45% Netflix RTL XL Videoland Which of the following content services have you used in the last month? 2016 Q1 2016 Q2 2016 Q3 2016 Q4 2017 Q1
  • 80. 80 0 50 100 150 200 250 18-34 year 35-54 year 55+ year Minutesperday Online video consumption 3.40 hours 1.30 hours 0.40 hours Big differences in time spend watching online video between age groups. Millennials watch more than 3 hours per day. Source: GfK Viewscape 2017, base: NL18+
  • 81. 81 NPO programs and TV series are popular for catch up TV Date Day Program top 10 Channel GRP’s 1 25-02-2017 Sat Wie is de mol NPO 1 779 2 03-02-2017 Fri Flikken Maastricht NPO 1 525 3 26-02-2017 Sun Boer zoekt vrouw internationaal NPO 1 471 4 20-01-2017 Fri Ik vertrek NPO 1 444 5 26-02-2017 Sun Floortje naar het einde van de wereld NPO 1 420 6 22-01-2017 Sun Zondag met lubach NPO 3 418 7 16-03-2017 Tue Klem NPO 1 379 8 25-02-2017 Sat Moltalk NPO 1 333 9 20-02-2017 Ma Geheime leven van 4 jarigen NPO 1 294 10 06-03-2017 Ma Celblok H SBS 6 281 Source: SKO, best watched catch-up tv shows via television,+ 02:00-26:00 UUR, 6+, 2017 Q1
  • 82. 82 Cooking, sports, traveling and special interests are most popular topics for online video content 31% 6% 8% 8% 11% 11% 15% 18% 19% 23% 26% 29% 33% 0% 5% 10% 15% 20% 25% 30% 35% 40% 45% 50% None Other Banking (Raising) kids Energy Health Beauty Electronics Cultivate Traveling Sports Hobby Cooking Topics watched – Online video % watched in the last year Source: Online Video Monitor 2017 – SAMR Smartagent Marketingresponse, Base: NL 18-54 69% of Dutch population (18-54) watch online videos
  • 83. 83 Kwebbelkop, the vlogger with most subscribers, has more than 2 billion views in total Rank User Total Video Views Subscribers Category 1 Kwebbelkop 2,087,994,143 2,830,014 Vlogs 2 EnzoKnol 1,081,890,272 1,454,240 Vlogs 3 Heroes TEAM 628,801,562 982,054 Vlogs 4 NikkieTutorials 463,865,622 6,385,539 Vlogs 5 StukTV 372,415,886 1,351,738 Vlogs Source: Socialblade, Top 10 YouTubers in The Netherlands by most viewed | 09/02/2017
  • 85. 85 34.1 million cinema visitors in 2016 (+3.7%) €8.42Average price per ticket (+0.5%) €287.1million in ticket revenue in 2016 Trends & developments – I Source: https://foxscreen.nl/2017/01/11/bioscoopbezoek-groeit-naar-ruim-34-miljoen/ | http://www.marketingtribune.nl/media/nieuws/2016/09/nederlandse-bioscopen-koersen-op-recordjaar-van- 293-miljoen-euro-omzet/index.xm | From 2015 to 2016 the number of cinema visitors went up by 3.7%. The total number of cinema visitors is at a historically high level (only seen in 1967 and 2015).
  • 86. 86 Trends & developments – II The positive cinema developments of 2016 seem to continue in 2017 Q1. In the first months of this year, the number of visitors increased with 18% compared to the same period in 2016. Movies Sing, Fifty Shades Darker and Beauty and the Beast were the most popular titles. After the opening of Kinepolis Jaarbeurs cinema in Utrecht with 14 halls and 3.200 seats, Jean Mineur Mediavision will further extend the network in July with 15 new VUE cinema’s. Jean Mineur hereby strengthened its position as market leader. Source: http://www.marketingtribune.nl/media/nieuws/2017/05/uitbreiding-bioscoopnetwerk-jean-mineur-mediavision/index.xml
  • 87. 87 In 2016, he movie ‘Bridget Jones’s Baby’ was the most popular film Title Revenue (in ‘000) Visits (in ‘000) Bridget Jones’s Baby € 10,300 1,191 Finding Dory € 8,900 1,082 Huisdiergeheimen € 8,100 1,024 The Jungle Book €9,446 967 Fantastic Beasts €8,658 874 Source: Nederlandse Vereniging van Filmdistributeurs (Dutch Film Distributors Association) and Nederlandse Vereniging van Bioscoopexploitanten (Dutch Association of Cinema Media Owners), annual report 2016
  • 88. 88 #locations #cinema halls #seats #visitors Q1 Pathé(incl. CineMec) 25 202 42,136 4,435,828 Kinepolis 15 103 20,198 858,745 VUE 6 41 8,306 547,625 Other 29 131 20,060 1,442,752 Total 75 (54%) 477 (65%) 90,700 (70%) 7,284,950 (78%) #locations #cinema halls #seats #visitors Q1 VUE 15 71 12,845 612,912 RSB Cinemas 6 20 2,329 220,032 Other 43 164 23,560 1,224,019 Total 64 (46%) 255 (35%) 38,734 (30%) 2,056,963 (22%) Source: Jean Mineur & Fox Screen, Q1 2017 FoxScreen entered the market in 2015 but with a market share of 78%, Jean Mineur remains dominant.
  • 89. 89 Number of cinema visitors increased in line with the number of film releases - 100 200 300 400 500 0 5 10 15 20 25 30 35 40 2006 2007 2008 2009 2010 2011 2012 2013 2014 2015 2016 #Cinemas&FilmReleases Visitorsinmillion # Visitors (million) # Film releases # Cinemas Source: Nederlandse Vereniging van Filmdistributeurs (Dutch Film Distributors Association) and Nederlandse Vereniging van Bioscoopexploitanten (Dutch Association of Cinema Media Owners), annual report 2016
  • 90. 90 Increase of cinema visits mainly because of relatively high number of visits in August, September and October. 0 500 1.000 1.500 2.000 2.500 3.000 3.500 4.000 4.500 Visitsin‘000 Cinema visits per 4 weeks 2016 2015 2014 Source: Nederlandse Vereniging van Filmdistributeurs (Dutch Film Distributors Association) and Nederlandse Vereniging van Bioscoopexploitanten (Dutch Association of Cinema Media Owners), annual report 2016
  • 91. 91 For cinema there is a clear increase in gross media spend towards the end of the year. Cinema vendors use monthly indices to reflect seasonality patterns in their rate cards. Source: Nielsen, 2014 – 2017 Q1 | Only gross spend for cinema 0,0 0,5 1,0 1,5 2,0 2,5 3,0 3,5 4,0 4,5 5,0 January February March April May June July August September October November December GrossMediaspend(in€millions) Seasonality cinema 2013 2014 2015 2016 2017 Q1 Total spend 2017 Q1: 3,366,699 Total spend 2016 Q1: 4,212,792 Total spend 2015 Q1: 3,307,903 Total spend 2014 Q1: 2,904,074 Total spend 2013 Q1: 3,653,400
  • 92. 92 Regular cinema visitors are younger than average. High social class for both regular as non-regular and 50/50 on gender. 50% 50% Profile regular cinema visitor Source: NOM Print & Doelgroep Monitor 2015 II – 2016 I, base: total NL 13+ (N= 17.171) | * Regular cinema visitor is defined as someone who visits a cinema at least once a month, non-regular visitors are people who visit the cinema less than once a month, excluding people who never visit the cinema. Profile non-regular cinema visitor 3% 30% 19% 21% 17% 11% 13-14 (index 105) 15-24 (index 201) 25-34 (index (131) 35-49 (index 83) 50-64 (index 71) 65+ (index 57) Social class % Index A 33% 150 B1 26% 112 B2 22% 107 C 9% 62 D 10% 51 Social class % Index A 27% 125 B1 26% 114 B2 23% 112 C 13% 84 D 11% 56 48% 52% 4% 20% 17% 31% 19% 9% 13-14 (index 154) 15-24 (index 138) 25-34 (index (122) 35-49 (index 123) 50-64 (index 79) 65+ (index 45)
  • 93. 93 In 2016, cinema reach among age group 16-39 increased significantly 75% 83% 73% 61% 59% 62% 43% 32% 76% 72% 89% 84% 70% 60% 42% 31% 0% 10% 20% 30% 40% 50% 60% 70% 80% 90% 100% 6-11 12-15 16-23 24-29 30-39 40-54 55-64 65+ Cinema reach 2015 2016 Source: Bioscoopmonitor 2016, Stichting Filmonderzoek
  • 95. 95 MCP: Listening Consumers´ listening patterns are constantly changing. Players such as Spotify have entered the market and are changing the way consumers experience music. The availability of music and radio via multiple devices further impacts how people experience listening to music.
  • 96. 96 Trends & developments - I The Media Exchange and OMS are ending their co- operation after a very successful year (turnover and number of advertisers). With a growing online radio industry, both publishers expect to serve the market better apart from each other. Soundcloud has launched paid subscriptions ‘Go-’ and ‘Go+’, in the Netherlands. ‘Go-’ will cost €6,- per month and ‘Go+’ €10,- per month based on the size of the music offer. For both subscriptions users are not exposed to advertising and are able to listen music offline. STER starts with advertising sale for radio channel FunX. FunX is the urban channel for young people. STER sees this partnership as a complement to its own, current channel, NPO 3FM. Source: https://www.emerce.nl/nieuws/omzet-online-radioreclame-verdubbelde-2016 |http://onemediasales.cmail19.com/t/| https://www.emerce.nl/nieuws/betaalde-abonnementen-soundcloud-nederland | http://www.adformatie.nl/nieuws/ster-doet-landelijke-reclameverkoop-npo-funx | https://www.radiofreak.nl/rtl-nederland-helemaal-gestopt-met-radio/ RTL fully stopped with radio, after it said farewell to digital radio channel RTL Lounge Radio. Talpa Radio has replaced the FM channel with ‘Sky Radio Smooth Hits’. Previously, RTL owned radio channels Yorin FM, RTL FM and partially Radio 538.
  • 97. 97 Trends & developments - II The current broadcasting licenses of commercial radio for broadcasting via FM, AM and DAB+ originally expired in 2017, but are extended until 2022. The government will assign new licenses by auction, an idea that caused a lot of resistance. By the extension, minister Kamp meets the needs of radio stations and the Dutch House of Representatives. Radio stations who want to broadcast on FM, also have to broadcast through DAB+. Since 2015 also DAB+ licenses without FM are sold by the government. The Media Exchange supports real time buying of radio spots the same way online display advertisements are bought. The independent platform offers real-time programmatic buying at theme stations (e.g. 538 dance department, Sky radio lounge, etc). MobPro and Spotify created a technical link to give advertisers the possibility to programmatically buy advertising space within the Spotify app. Advertisers are able to target on preferences of listeners and can buy both display banners and audio spots. Source: http://www.themediaexchange.nl/?mc_cid=b905d536f1&mc_eid=5ced93674c I http://www.emerce.nl/nieuws/mobpro-koppelt-spotify-audioreclame
  • 98. 98 Dutch radio stations, with advertising possibilities (I/II) STER One Media Sales Q-Music NL TMG Source: retriever.nl, Q1 2017
  • 99. 99 Dutch radio stations, with advertising possibilities (II/II) E-power advertising* FD Mediagroep ORN* 22 online stations Source: retriever.nl, Q1 2017 * ORN (government) and E-Power are responsible for approximately 30 regional stations
  • 100. 100 Market share of NPO 3FM is further decreasing, NPO Radio 2 shows growth. Q1 2017 was particularly successful for Sky Radio, Q-music and Radio 538. Source: NLO, 2016 May-Jun - 2017 Mar-Apr. Base: NL 10+ 0% 5% 10% 15% Market share (%) May-Jun 2016 Jul-Aug 2016 Sep-Oct 2016 Nov-Dec 2016 Jan-Feb 2017 Mar-Apr 2017
  • 101. 101 Increase of spend for NPO Radio 2 and Q-music. Decrease for NPO 3 FM and for BNR Nieuwsradio. 0 5 10 15 20 25 30 35 40 45 MediaSpendperStation(inMillions) Gross Media Spend 2016 Q1 2017 Q1 +7% -26% +339% -40% +25% Source: Nielsen, 2016 Q1 – 2017 Q1. Gross spend for radio only.
  • 102. 102 0 10.000 20.000 30.000 40.000 50.000 60.000 70.000 80.000 90.000 100.000 January February March April May June July August September October November December X1000 Gross media spend Radio 2013 2014 2015 2016 2017 Q1 Seasonality of radio shows low spend in Summer period and high peak in Q4 (Christmas and top lists at the end of the year). Some Radio vendors use monthly indices to reflect the seasonality influences in their rate card. Source: Nielsen, 2014 – 2017 Q1. Gross spend for radio only. Total spend 2017 Q1: € 181,989,537 Total spend 2016 Q1: € 182,788,075 Total spend 2015 Q1: € 178,544,011 Total spend 2014 Q1: € 151,617,468 Total spend 2013 Q1: € 143,566,478
  • 103. 103 The automotive category is well represented within top 10 radio advertisers Brand Category Gross radio spend Q1 2017 1 Kruidvat Retail €4,704,014 2 Renault Automotive €4,651,772 3 Mercedes Benz Automotive €3,737,800 4 Volkswagen Automotive €3,495,220 5 ZIGGO Internet €3,289,352 6 Fiat Automotive €2,918,192 7 LIDL Retail €2,634,921 8 Vodafone Telecom €2,583,653 9 Aldi Retail €2,581,976 10 KPN Telecom €2,539,394 Source: Nielsen, Q1 2017. Gross spend for radio only.
  • 104. 104 Some clutter in channels aimed at older audiences. A young and more female station is missing in the radio landscape. Source: NLO, 2017 (Mar-Apr), TA: NL 10+ Young Female Radio Veronica ‘Oldies’ (music more than 5 years old) BNR Nieuws Radio News SLAM! Dance and new hits Sublime FM Jazz, soul, latin and lounge 100% NL Dutch Male Old
  • 105. 105 Streaming music Application-based music streaming service with 6,8 million users. Free and paid subscription options; 40% of the Dutch users are paying for the streaming service. Average monthly reach Q1 2017: 24,7% Audio platform that originally enables sound creators to share their created sounds. Streaming music available for free or through paid subscription. Average monthly reach Q1 2017: 4,1% Music streaming service for web and app. Spot advertising within playlist possible. Free and paid subscription options. Average monthly reach Q1 2017: 1,2% Music application of Apple for streaming music and an extension of iTunes. Only available through paid subscription. Average monthly reach Q1 2017: 19% Source: Spotify | DAM Q1 2017 (TA 13+ N=1,091), Average monthly reach all platforms | Ownership Spotify - Trends in Digital Media, GfK Intomart, Dec 2014, base: online population 13+ who own a tablet and/or smartphone AND have al least one app
  • 106. 106 TV is the most popular device for listening to radio. Strong increase for listening radio through smartphone. 0% 5% 10% 15% 20% 25% 30% 35% 40% June '12 Dec '12 June '13 Dec '13 June '13 Dec '14 Juni '15 Dec'15 Dec'16 %Agreetolistenviadevice Digital radio listening* Desktop Laptop Smartphone Tablet Television** Streaming- network audioplayer Source: Trends in Digital Media 2016, GfK Intomart, December 2015, base: online population 13+ (N=1,151) *Claims to listen radio via device **Television was previously reported as SettopBox. Since the December 2015 publication it’s categorized under television.
  • 107. 107 Most time spent on online radio via TV. Radio station apps are becoming more popular, although Spotify remains dominant. 45 107 21 60 36 11 0 50 100 150 200 250 300 Average minutes per week Desktop TV Laptop Streaming-/network player Smartphone Tablet 0% 5% 10% 15% 20% 25% Spotify Radio 538 NPO 3FM Q-music Nederland.fm NPO radio 2 NPO radio 1 Sky Radio 100%NL Radio Veronica Radio 10 Radio Apps (downloaded) Tablet (n=808) Smartphone (n=1056) Source: Trends in Digital Media, GfK Intomart, December 2016, base: All (n=1.151) Source: Trends in Digital Media, GfK Intomart, December 2016, base: owners of tablet and/or smartphone
  • 109. 109 MCP: Reading Reading is slowly shifting from paper to (online) screens. More and more people are reading newspapers on their tablet or mobile phone. Increasingly, news content is being accessed via free news sites or apps. These new possibilities to get news and read magazines are changing the experience of reading.
  • 110. 110 Trends & Developments – I : pay-per-article/micropayments Blendle (alternatives: Maggy, Elinea) is a micropayment platform for quality content. Subscribers can top up their Blendle wallet and are then only one click away from buying articles from various newspapers and magazines. After steadily expanding in its Dutch home market since its launch in 2014, the platform has also been launched in Germany (2015) and is in a beta trial phase in the US (2016). As part of its international expansion plan, Blendle has expanded its portfolio by adding international newspaper titles such as The New York Times, The Wall Street Journal and The Washington Post, as well as Times Inc magazines, amongst others. In 2016, Blendle acquired the similar digital reading app ‘Paper’ of De Persgroep.
  • 111. 111 Trends & developments - II Research from PWC shows that ‘print’ consumption will further decrease because consumers are shifting more to online media. PWC calculated a revenue drop of 3.3% for magazines and 1.9% for newspapers within 5 years. Source: http://www.emerce.nl/nieuws/blendle-test-premiumdienst-vast-bedrag-per-maand | http://www.bladendokter.nl/pwc-uitgevers-blijven-komende-5-jaar-moeilijk-houden/ | http://www.emerce.nl/nieuws/nrc- stapt-uit-blendle-na-introductie-premium-abonnement | https://www.emerce.nl/nieuws/fd-heeft-grootste-betaalde-digitale-oplage Online kiosk Blende starts a new monthly subscription service ‘Blendle Premium’. For €10.- per month, users don’t need to pay per article anymore, which was the only payment possibility. Also, Blende does not offer all articles but makes a selection based on user profiles. NRC decided to quit its partnership with Blendle. Chief Editor Vandermeersch argues that Blendle is not contributing to high quality journalism because of the ‘cheap’ premium option and the lack of interactive possibilities (such as video). Of all national newspapers, ‘Financieel Dagblad’ has relatively the largest digital circulation. 60% of the total circulation is digital, compared to an average of 30%. With 68,646 digital subscribers, FD follows Telegraaf (232,039) and Volkskrant (88,535).
  • 112. 112 Trends & developments - III Source: http://www.adformatie.nl/nieuws/nrc-handelsblad-en-nrcnext-vanaf-volgend-jaar-een-krant | http://www.bladendokter.nl/het-verschil-tussen-chantal-linda-en-wendy/ | https://www.emerce.nl/nieuws/papieren-editie-hitkrant-stopt NRC combined it’s newspapers ‘Handelsblad’ and ‘Next’. All readers will receive the same newspaper. NRC Next stays a morning newspaper and NRC Handelsblad an afternoon version. After 40 years, ‘Hitkrant’ stops with its paper version and shifts focus to the online platform and social media. On March 28th the magazine launched for the very last time with a special extended edition. From now on, a paper version will be published only six times per year with extra posters and images. Chantal Janzen launches a new glossy ‘&C’ focused on fashion, beauty, food and lifestyle. Chantal follows colleagues ‘Linda de Mol’ and ‘Wendy van Dijk’ who are all TV personalities with a magazine. The circulation of &C will be 100,000 per month and next to a paper edition there will be an app, website and online shop.
  • 113. 113 Newspapers print circulation is dominated by national newspapers 1.427 1.138 377 - 200 400 600 800 1.000 1.200 1.400 1.600 2016 Q2 - 2017 Q1 €x1000 Moving year average circulation figures (in ‘000s) National newspapers Regional newspapers Free sheets Source: NOM, 2016 Q2 – 2017 Q1 | moving year average circulation figures. Based on print only (all paid-for and free-of-charge circulation)
  • 114. 114 Top 10 ranking Title Newspaper type Total annual paid circulation 2016 Q2 – 2017 Q1 Total annual circulation 2016 Q2 – 2017 Q1 1 De Telegraaf National 373351 415306 2 Metro Free sheets 0 376728 3 AD National 311723 360799 4 de Volkskrant National 215409 258783 5 NRC Handelsblad National 134191 143821 6 De Limburger Regional 122189 127113 7 De Gelderlander Regional 104359 115049 8 Trouw National 87819 104530 9 De Stentor Regional 89593 99036 10 Dagblad van het Noorden Regional 92851 98418 De Telegraaf is leading in terms of print circulation. Source: NOM, 2016 Q2 – 2017 Q1 annual moving average circulation figures for newspapers. Based on print only (all paid-for and free-of-charge circulation), excluding digital circulation figures.
  • 115. 115 National papers AD and Telegraaf are leading in terms of reach. Ranking National newspapers in terms of audience reach Average issue reach amongst NL 13+ (in ‘000s) Average issue reach amongst NL13+ (%) 1 AD Dagbladen 1.317,5 9,2 2 De Telegraaf 1.296,5 9,0 3 Metro 1.080,3 7,5 4 de Volkskrant 749,2 5,2 5 NRC Handelsblad 355,2 2,5 6 Trouw 337,1 2,4 7 Reformatorisch Dagblad 170,4 1,2 8 NRC.next 128,6 0,9 9 Het Financieele Dagblad 124,6 0,9 Source: NOM Print Monitor 2017-I, base: total NL 13+ (N=17,179)
  • 116. 116 Higher online reach for news site Nu.nl than digital replica of traditional print titles. Nevertheless, more visits and higher visit frequency for NOS. No. Top 10 online News brands Reach (%) Reach (‘000) # Visits (‘000) Avg visit frequency 1 NU.nl 48,6 6.920.000 151.479 21,9 2 NOS 48,5 6.915.000 232.472 33,6 3 AD 39,3 5.605.000 96.841 17,3 4 Telegraaf 36,8 5.236.000 139.489 26,6 5 RPO 34,6 4.933.000 90.301 18,3 6 RTL Nieuws 24,9 3.546.000 30.283 8,5 7 De Volkskrant 17,7 2.520.000 23.581 9,4 8 Prive 12,3 1.757.000 10.241 5,8 9 NRC 10,7 1.518.000 10.217 6,7 10 Omroep brabant 9,3 1.327.000 17.046 12,8 Source: DAM, base: 13+, average reach Q1 2017 all platforms
  • 117. 117 0 20 40 60 80 100 120 140 January February March April May June July August September October November December Grossspendnewspapers(inMillions) Seasonality newspapers 2013 2014 2015 2016 2017 Q1 Lower ad spend in dailies in Summer. 2017 Q1 spend levels are higher than 2016 Q1, but still lower than previous years. Source: Nielsen, 2013 -2017 Q1. Gross spend for newspaper advertising only. Total spend 2017 Q1: € 220,349,390 Total spend 2016 Q1: € 178,879,156 Total spend 2015 Q1: € 275,585,434 Total spend 2014 Q1: € 255,306,640 Total spend 2013 Q1: € 292,194,772
  • 118. 118 No. Brand Category Newspapers gross spend Q1 2017 1 Corendon Travel €8,510,062 2 Kras reizen Travel €7,659,468 3 Stip reizen Travel €7,365,124 4 Koopjedeal.nl Travel €5,127,126 5 Bolderman Travel €4,724,796 6 Zadkine media Media €3,642,475 7 Effeweg.nl Travel €3,438,069 8 NRC Media €2,976,658 9 Stella Transport €2,942,864 10 NRC Live Media €2,717,400 Travel brands are dominating the top 10 advertisers in newspapers Source: Nielsen, 2017 Q1 | Gross spend for newspapers only.
  • 119. 119 High increase of spend for AD Nieuwsmedia and De Volkskrant compared to 2016 Q1. Spend for Telegraaf decreased. 0 5 10 15 20 25 30 35 Mediaspend(inmillions) Gross media spend Newspapers 2016 Q1 2017 Q1 +88% -24% Source: Nielsen, 2016 Q1 – 2017 Q1. Gross spend for newspapers only. +87%
  • 120. 120 The growth of digital use of newspapers seems to have stagnated over the last year across all devices. 38% 20% 20% 36% 21% 23% 35% 22% 24% 39% 27% 28% 36% 27% 27% Pc/Laptop Mobile Tablet NPDM 2013 I - 2013 II NPDM 2013 II - 2014 I NPDM 2014 I - 2014 II NPDM 2015 I - 2015 II NPDM 2015 II - 2016 I Source: NPDM releases: 2013 I – 2016 I, base: total NL 13+ Digital use of newspapers
  • 121. 121 Family, culinary and women’s titles show highest circulation figures, with increase for culinary and travel. 0 500 1000 1500 2000 2500 3000 3500 4000 4500 Family Culinary mags (incl sponsored) Women's TV listings Newspaper magazines Home decoration, gardening & DIY Special interest Mind & body Travel Popular Science Youth Education Moving year average total circulation (in ‘000s) Q1 2016 - Q4 2016 Source: NOM, 2016 Q2 – 2017 Q1 annual moving average circulation figures. Based on total magazines (all paid-for and free-of-charge circulation).
  • 122. 122 High circulation numbers for sponsored magazines. Kampioen has by far the highest total circulation. Top 10 Title Magazine type Total paid circulation 2016 Q2 – 2017 Q1 Total circulation 2016 Q2 – 2017 Q1 1 Kampioen Family 3409112 3409112 2 Allerhande Culinary sponsored 0 2019907 3 Boodschappen Culinary sponsored 0 1901586 4 Eigen Huis magazine Home decoration, gardening & DIY 751803 751803 5 Vrouw Women’s 0 510743 6 Vrij Newspaper mags 0 507136 7 Burgerkracht Special Interest 0 496119 8 AD Magazine Newspaper mags 0 411997 9 Het Volkskrant Magazine Newspaper mags 0 370736 10 Libelle Women’s 292255 297778 Source: NOM, 2016 Q2 – 2017 Q1 annual moving average print circulation figures for magazines
  • 123. 123 Source: NOM Print Monitor 2017-I, base: total NL 13+ (N=17,179) Women’s and family titles have highest reach Top 10 magazine titles in terms of audience reach Publication type Average issue reach amongst NL 13+ (in ‘000s) Average issue reach amongst NL13+ (%) Kampioen Family 4.852,1 33,8 Allerhande Culinary sponsored 4.239,6 29,6 Libelle Women’s 1.622,1 11,3 Donald Duck Kids 1.396,3 9,7 LINDA. Women’s 1.192,7 8,3 Vrouw Women’s 1.137,0 7,9 Privé Celebrity 1.041,2 7,3 Margriet Women’s 1.036,1 7,2 Veronica Magazine Television magazine 984,9 6,9 Quest Science 975,4 6,8
  • 124. 124 0 10 20 30 40 50 60 January February March April May June July August September Oktober November December Magazines grossmediaspendinmillions Seasonality Magazines 2013 2014 2015 2016 2017 Q1 Ad spend in magazines peak in Spring, early Summer and during the holiday season (December). Source: Nielsen, 2013 – 2017 Q1. Gross spend for consumer magazines only. Total spend 2017 Q1: € 83,860,128 Total spend 2016 Q1: € 82,193,705 Total spend 2015 Q1: € 86,926,763 Total spend 2014 Q1: € 98,803,815 Total spend 2013 Q1: € 113,873,869
  • 125. 125 No. Brand Category Gross spend in Q1 2017 1 Sanoma Media € 1,148,783 2 Hollands Nieuwe Telecom € 1,147,852 3 Corendon Travel € 1,140,911 4 Unox FMCG € 1,071,013 5 ANWB Travel € 1,055,265 6 Elsevier Media € 999,144 7 Cookloveshare.nl Media € 958,999 8 Albert Heijn Retail € 824,350 9 Otolift Home € 768,392 10 Voordeeluitjes.nl Travel € 754,112 When looking at individual brand level, Sanoma and Hollands Nieuwe are main print advertisers. Source: Nielsen, 2017 Q1. Gross spend for consumer magazines only.
  • 126. 126 Libelle shows high increase of spend levels and is now leading in stead of Allerhande. Woman titles show overall increase of spend. 0 1 2 3 4 5 6 7 8 9 Mediaspend(inmillions) Gross media spend magazines 2016 Q1 2017 Q1-21% +54% Source: Nielsen, 2016 Q1 – 2017 Q1. Gross spend for consumer magazines only.
  • 127. 127 High consumption of door drops mainly by older generations. 91% 86% 82% 78% 73% 64% 62% 0% 10% 20% 30% 40% 50% 60% 70% 80% 90% 100% Total Reach % 25% 15% 27% 33% 41% 47% 0% 5% 10% 15% 20% 25% 30% 35% 40% 45% 50% 13-14 15-24 25-34 35-49 50-64 65+ Total Reach % High consumption of door drops (> 13.5 titles)Reach per category Source: NOM folder monitor 2017 *Media imperatives are based on frequency of appearance
  • 128. 128 Albert Heijn door drops have highest reach, both print as digital No. Brand Category REACH PRINT (IN %) REACH DIGITAL (IN %) 1 Albert Heijn Supermarket 55.9% 12.4% 2 Kruidvat Drugstore 54.1% 9.7% 3 Lidl Supermarket 45.8% 9.1% 4 Blokker Household 44.7% 5.9% 5 Aldi Supermarket 44.4% 6.6% 6 Hema Household 41.4% 6.5% 7 Mediamarkt Electronic 37.3% 6.2% 8 Gamma House / Garden 37.0% 4.4% 9 Praxis House / Garden 35.4% 4.1% 10 Karwei House / Garden 32.5% 3.3% Source: NOM Folder Monitor 2017
  • 130. 130 MCP: Communicating Human beings are a social species, with communication taking place throughout the day. Face-to-face interaction won´t disappear anytime yet but the younger generations don’t differentiate so much anymore between online/offline communications. The social experience around communication is changing as communicating via Facebook Messenger, WhatsApp, Snapchat and the like is getting more and more accepted.
  • 132. 132 Trends & developments – I Facebook extends the video possibilities for advertisers by offering the ‘mid-roll’ format. From now on, video content can be interrupted with commercials. The same applies to live video. Source: http://fonkonline.nl/artikelen/tech/amerikaanse-verkiezingen-schudden-google-en-facebook-wakker-38544.html | https://www.emerce.nl/nieuws/instagram-stories-krijgt-full-screen-reclame | https://www.emerce.nl/nieuws/facebook-alle-remmen-los-video-advertenties Google and Facebook will try to avoid (or delete) advertisements on pages with fake news. This was a reaction after the American elections. It appeared that Facebook and Google were determining for the outcome of the US elections. Instagram Stories will offer full screen advertising options within the new Story feature of full screen content that disappears after 24 hours. Brands also have the opportunity to use the ‘Stories’ feature in the same way as consumers (this only can be seen by users who follow the brand).
  • 133. 133 Trends & developments – II Source: https://www.iculture.nl/nieuws/whatsapp-status-snapchat/ | https://www.emerce.nl/nieuws/snapchat-ontbreekt-meeste-nederlandse-mediaplannen | https://www.emerce.nl/nieuws/groei- snapchat-nederland-neemt-laatste-maanden-snel-af | https://www.emerce.nl/nieuws/twitter-jaarcijfers After Snapchat, Instagram and Facebook Messenger, people can now also share their ‘live’ or daily content on WhatsApp with ‘WhatsApp status’. Just as for the other platforms users are able to share their story with contacts for 24 hours, after that it will be removed automatically. In Q4 2016, the turnover of Twitter was 717 million dollars in stead of the expected 740 million dollars. The net loss was 167 million dollars, twice as much as in 2015. The number of monthly, active users of Twitter is not growing. As a result of disappointing developments the Dutch offices closed before. BrandDeli is now responsible for sales of Twitter. Based on research of MeMo2, Snapchat is not yet included in many media plans since it is hard to justify budgets while the results are hard to measure/compare with other media types. Nevertheless is 54% of users between 12 and 24 using it daily and 70% using it monthly. Telecompaper reveals that the growth of Snapchat stagnated, in terms of followers and usage. The photo app seems to be especially popular among teenagers and young millennials.
  • 134. 134Source: Newcom, Dutch National Social Media Survey 2017, TA: 15+ WhatsApp and Facebook still show growth in usage. Highest increase for Instagram, slight decrease for Twitter. Social media usage
  • 135. 135 Highest usage for WhatsApp and Facebook. Replacing Twitter, Instagram enters top 5. Main platforms: 3.2 million Dutch people use Instagram, 1.5 million use it daily 4.3 million Dutch people use LinkedIn, 0.4 million use it daily 7.5 million Dutch people use YouTube, 1.7 million use it daily 10.4 million Dutch people use Facebook, 7.5 million use it daily 10.9 million Dutch people use Whatsapp, 7.8 million use it daily Source: Newcom, Dutch National Social Media Survey 2017, TA: 15+ Other platforms: 0.1 million Dutch people use Foursquare , 46 K use it daily 0.1 million Dutch people use WeChat, 63 K use it daily 0.4 million Dutch people use Tumblr, 101 K use it daily 1.9 million Dutch people use SnapChat, 960 K use it daily 2.4 million Dutch people use Pinterest, 381 K use it daily 2.6 million Dutch people use Twitter, 871 K use it daily
  • 136. 136 Snapchat and Tumblr are mainly used by younger age groups 10% 10% 8% 14% 10% 10% 28% 22% 24% 25% 27% 28% 27% 20% 35% 30% 27% 28% 29% 28% 29% 28% 23% 26% 25% 24% 26% 20% 24% 26% 10% 17% 14% 12% 11% 10% 10% 16% 3% Facebook Twitter LinkedIn Instagram Pinterest Google+ Snapchat Tumblr Age distribution of social networking sites in NL 13-19 20-34 35-49 50-64 65+ Source: GfK DAM, base: 13+, Q1 2017
  • 137. 137 Facebook account ownership is stable at a high level. Active usage is again increasing after dip in 2014 0% 10% 20% 30% 40% 50% 60% 70% 80% 90% 100% Total 16+ 16-24 25-34 35-44 45-54 55-64 Account ownership 2012 2013 2014 2015 2016 2017 Q1 0% 10% 20% 30% 40% 50% 60% 70% 80% 90% 100% Total 16+ 16-24 25-34 35-44 45-54 55-64 Active users monthly 2012 2013 2014 2015 2016 2017 Q1 Source: GlobalWebIndex, 2012 – 2017 Q1, Base Internet Users NL16+,
  • 138. 138 0% 10% 20% 30% 40% 50% 60% 70% 80% 90% 100% Total 16+ 16-24 25-34 35-44 45-54 55-64 Account ownership 2012 2013 2014 2015 2016 2017 Q1 Account ownership and usage of LinkedIn increases further after a slight decrease in 2015 0% 10% 20% 30% 40% 50% 60% 70% 80% 90% 100% Total 16+ 16-24 25-34 35-44 45-54 55-64 Active users monthly 2013 2014 2015 2016 2017 Q1 Source: GlobalWebIndex, 2012 – 2017 Q1, Base Internet Users NL16+,
  • 139. 139 Strong increase for account ownership and activity of Instagram, for all age groups. 0% 10% 20% 30% 40% 50% 60% 70% 80% 90% 100% Total 16+ 16-24 25-34 35-44 45-54 55-64 Account ownership 2013 2014 2015 2016 2017 Q1 0% 10% 20% 30% 40% 50% 60% 70% 80% 90% 100% Total 16+ 16-24 25-34 35-44 45-54 55-64 Active users monthly 2013 2014 2015 2016 2017 Q1 Source: GlobalWebIndex, 2013 – 2017 Q1, Base Internet Users NL16+. Instagram data is available from 2013 Q2
  • 140. 140 Account ownership of YouTube is further increasing, just like active usage which shows an uplift after 2014. 0% 10% 20% 30% 40% 50% 60% 70% 80% 90% 100% Total 16+ 16-24 25-34 35-44 45-54 55-64 Account ownership 2012 2013 2014 2015 2016 2017 Q1 0% 10% 20% 30% 40% 50% 60% 70% 80% 90% 100% Total 16+ 16-24 25-34 35-44 45-54 55-64 Active users monthly 2012 2013 2014 2015 2016 2017 Q1 Source: GlobalWebIndex, 2012 – 2017 Q1, Base Internet Users NL16+
  • 141. 141 Social Media in The Netherlands: privacy concerns are still an issue Source: Newcom, Dutch National Social Media Survey 2017, TA: 15+ 66% is worried about their data being sold 54% is worried about their data in general 57% does not know if they can trust social media 17% has (a lot of) trust in social media
  • 142. 142 Worries about privacy have slightly increased. Especially the older age groups are worried. 44% 48% 0% 10% 20% 30% 40% 50% 60% Worried Worries about privacy in The Netherlands 2016 2015 Source: Ruigrok NetPanel, Whats happening online 2016, 18+ n=1,239 26% 38% 51% 52% 42% 42% 35% 34% 28% 17% 12% 12% 3% 3% 1% 2% 0% 10% 20% 30% 40% 50% 60% Digital teenagers Millennials Generation X Babyboomers Worried about privacy Worried Neutral Not worried Don't know
  • 144. 144 Trends and developments – I E-commerce has increased with 16.5% in 2016. The Dutch online shopper is expected to spend €811 per person, which is an increase of €26.64 compared to 2015. E-commerce Source: http://www.marketingonline.nl/nieuws/e-commerce-groeit-dit-jaar-met-165 |http://www.nu.nl/internet/4339731/cookiewet-duur-en-beschermt-onvoldoende.html | https://www.emerce.nl/best- practice/youtube-begint-afscheid-cookies-pixels | https://radar.avrotros.nl/nieuws/detail/akkoord-over-roaming-binnen-eu/ Cookie law EU Telecom According to Actal, the much debated cookie law will disappear in the future. Just like in other EU countries, websites have to ask visitors for permission for the use of tracking cookies, but this is expensive and causes irritation. YouTube Pixels Youtube wants to decrease the use of cookies and pixels and will shift to ‘cloud based measurement’. The current technology of cookies is less effective because of the increasing cross device usage. That’s why data will be based on Google users in stead of Cookies. With this choice, Google makes a big step to ‘people based marketing’. From June 15th 2017, phone users will pay the same amount of money for roaming, texting and calling in every European country. According to the European Parliament this is a victory for the European Telecom consumer.
  • 145. 145 Trends and developments – II Websites are struggling with ad blockers. The number of people who are installing ad blockers on desktop, tablet and phones is growing. Right now, 4,9% of all Internet users around the world are not seeing advertisements. In The Netherlands, this number is much higher (26%). For websites this is perceived to be a big problem as it decreases the value of online ads. Half of the Dutch population considers to install ad blockers. People have a positive attitude towards advertising in general, but are annoyed by online ads. The use of ad blockers is highest on laptops and desktops. However, the intention to install ad blockers is highest for smartphones. The popular ad-blocker website AdBlock Plus will give advertisers the opportunity to serve relevant and good ads. Advertisers and publishers can be on a ‘white list’ by paying a certain amount of money. Also, the ads itself can not be too irritating for users. Source: http://nos.nl/artikel/2056954-websites-worstelen-steeds-meer-met-adblockers.html | http://www.adformatie.nl/nieuws/onderzoek-adformatie-helft-nederlanders-wil-aan-de-adblocker I http://www.emerce.nl/nieuws/adblock-plus-gaat-zelf-advertenties-verkopen
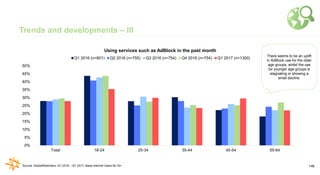
  • 146. 146 Trends and developments – III 0% 5% 10% 15% 20% 25% 30% 35% 40% 45% 50% Total 16-24 25-34 35-44 45-54 55-64 Using services such as AdBlock in the past month Q1 2016 (n=801) Q2 2016 (n=755) Q3 2016 (n=754) Q4 2016 (n=754) Q1 2017 (n=1300) Source: GlobalWebIndex, Q1 2016 – Q1 2017, Base Internet Users NL16+ There seems to be an uplift in AdBlock use for the older age groups, whilst the use for younger age groups is stagnating or showing a small decline.
  • 147. 147 Trends and developments – IV DMA Institute is an international digital media auditing and quality assurance service empowering digital leaders and organizations in “Assessing The True Value Of Digital Media’’. With DMA you can measure the time for which the ads have been visible, which audience has seen the ad and which sites and placements provided conversions for the brand. Source: http://www.adformatie.nl/nieuws/dma-institute-begint-met-certificeren | DMAI Year End 2016 Visibility Benchmarks, January 2017. *In View: impression that has been in view for longer than 1 second. ** Quality View: an impression that has been in view for longer than 5 seconds. 0% 10% 20% 30% 40% 50% 60% 70% Q1 2016 Q2 2016 Q3 2016 Q4 2016 DMA visibility benchmarks In View* Quality View* Total 2016 In View: 59% Quality View: 41%
  • 148. 148 Cooblue has by far the highest digital spend in Q1 2017* No. Brand Category Gross spend Q1 2017 1 Coolblue.nl Retail €7,314,613 2 KPN Telecom €4,462,506 3 McDonalds Food €3,955,668 4 Fisher Investments Real estate €3,799,743 5 Vergelijk.nl Retail €3,415,488 6 Dela Financial €3,402,777 7 Exact Software €3,090,669 8 AD Media €3,043,463 9 Bijenkorf Retail €2,994,552 10 ANWB Travel €2,760,757 Source: Nielsen, Q1 2017. * Note: online spend without taking into account social, SEA and in-app advertising.
  • 149. 149 Programmatic Update: Google DoubleClick Bid Manager (DBM) Cross-environment reporting shows the effectiveness of advertising campaigns across all environments (apps, browsers and different devices). The metric links together cookies, web ID’s and anonymized google sign-ins to identify a user and determine the path taken, from seeing an ad to conversion, across different environments. Active View, Google’s viewability measurement solution is now available for YouTube in-stream ads. Using custom affinity segments it becomes possible to target audiences based on the media they consume (offline and online) or based on the products or services they might be interested in. Cross-environment conversion tracking Active View Custom affinity Segments It will soon be possible to run programmatic deals on all inventory, regardless of the publisher’s ad server, using Tag Guarantees deals directly. This will allow to run reservation campaigns together with programmatic buys and hence gather media buying in one place. Tag Guarantees Source: VIVAKI Programmatic
  • 150. 150 Digital ad formats (I/II) - Standard IAB Source:http://nextday.media/producten/ Half-page ad 300x600 Full banner 468x60 Leaderboard 728x90 Billboard 970x250 Large rectangle 336x280 Medium rectangle 300x250 Wide Skyscraper 160x600 Skyscraper 120x600
  • 151. 151 33% 14% 15% 37% 42% 14% 18% 38% 46% 17% 20% 41% 44% 16% 20% 40%39% 14% 17% 37% 42% 17% 19% 38% Social Networks Buying/selling Streaming video Searching for info 2012 2013 2014 2015 2015 II - 2016 I 2017 I Up until 2014 all online activities have shown an increase in usage. Online activities done ‘often’ – across time Source: NPM 2012 I - II to NPM 2017-I, NL 13+ | From 2017, NPM comes out each quarter
  • 152. 152 Activities across platforms are more or less similar, although popularity differs slightly. Social media and Search are present in top 3 of all devices. 43 46 47 48 53 54 58 59 62 66 Searched for a product or service you want to buy Used a map or directions service / app Used an internet banking service Visited a news website / app / service Used a chat or instant messaging service / app Uploaded / shared a photo Checked the weather online Used a webmail service to access, read or send emails Visited / used a search engine Visited / used a social network Top 10 - Mobile 49 49 55 57 57 61 66 67 68 76 Used a map or directions service / app Used an online encyclopedia such as Wikipedia Visited a news website / app / service Checked the weather online Purchased a product online Used an internet banking service Used a webmail service to access, read or send emails Visited / used a social network Searched for a product or service you want to buy Visited / used a search engine Top 10 - PC / Laptop 14 14 15 18 21 21 21 22 26 30 Used a map or directions service / app Used an online encyclopedia such as Wikipedia Used an internet banking service Watched a video clip or visited a video-sharing site Visited a news website / app / service Searched for a product or service you want to buy Checked the weather online Used a webmail service to access, read or send emails Visited / used a social network Visited / used a search engine Top 10 - Tablet Source: GlobalWebIndex, 2017 Q1, Base Internet Users NL16+ (N= 1300), Have done in the past month
  • 153. 153 Online population is slightly more male, but Dutch women spend more time online compared to other countries. Internet penetration amongst 65+ and lower educated is steadily rising. Internet penetration NL 2014 2015 2016 Index Male 93.1% 93.4% 94.9% 100 Female 88.3% 90.7% 91.5% 103 13+ 90.7% 92.1% 93.2% 102 13 – 19 years old 99.1% 99.4% 99.4% 100 20 – 34 years old 99.2% 98.8% 99.2% 100 35 – 49 years old 97.6% 97.7% 99.2% 100 50 – 64 years old 91.8% 94.5% 96.6% 103 65+ 66.4% 71.0% 72.5% 107 High educated 98.2% 98.0% 98.3% 100 Middle educated 93.9% 95.0% 96.4% 101 Low educated 70.5% 74.4% 76.3% 106 Source: Media Standard Survey 2016 (N= 6,000)
  • 154. 154 Most people (79%) have online access at home on a daily basis. Access on mobile is increasing and becomes number one device for Internet access. 0% 25% 50% 75% 100% Online access in % 2013 2014 2015 2015 II - 2016 I 2017 I 79% 8% 4% 1% 0% 0% 0% 2% 1% 5% (Almost) daily 4-5 days a wk 2-3 days a wk Once a wk Once every 2 wks Once a month < once a month Never Don't know No access at home Online access - At home 11% 21% 11% 4% 1% 1% 1% 2% 2% 47% (Almost) daily 4-5 days a wk 2-3 days a wk Once a wk Once every 2 wks Once a month < once a month Never Don't know No access at work Online access - At work Source: NPM 2017-I, base: total NL 13+Source: NPM 2013 I - II to NPM 2017-I, NL 13+ *From 2017, NPM comes out each quarter
  • 155. 155 Strong growth figures for online consumer spends 8.200 9.000 9.800 10.600 13.730 16.090 20.060 6 7 8 9 10 11 12 0 5.000 10.000 15.000 20.000 25.000 €billions Online shopping spend People buying online +10% +9% +8% +30% +17% E-commerce trendsTop 5 branches annual increase in online spend Q1 2017 25% 29% 30% 34% 52% Child Toys Sport & Recreation Home & Garden Clothing Health & Beauty Online Source: Thuiswinkel Marktmonitor 2010 – 2017 Q1 Online spends Q1 2017: 5.5 billion (+ 11%) Number online purchases Q1 2017: 44.4 million (+ 11%) Number online buyers Q1 2017: 11.1 million +25% millions
  • 157. 157 MCP: On the Go On average people spend one hour per day On the Go. On the Go is stable over the years although the moments that brands can get in contact with consumers while they are On the Go are increasing. This is mostly due to increased smartphone and mobile Internet penetration, but also due to new and innovative digital OOH media solutions.
  • 158. 158 Trends and developments I Source: http://fonkonline.nl/artikelen/media/rechter-pakt-exterion-hard-aan-38340.html | http://www.jcdecaux.nl/nieuwsberichten/rotterdamse-ret-kent-voorlopige-gunning-alle-outdoor-formaten-toe-aan-jcdecaux | http://clearchannel.nl/nl/Nieuws/Laatste-nieuws/Clear-Channel-International-lanceert-eerste-out-of-home-programmatic-buying-platform-in-Europa#.| Clear Channel International has launched, as first OOH vendor, a programmatic buying tool for ‘on the go’ advertising in Europe. From January, this automated solution is live in Belgium and Clear Channel has plans to launch the tool in other European countries soon. After a false allocation to Exterion Media, public transport organization of Rotterdam, RET, has officially granted its outdoor advertising rights to JCDecaux. JCDecaux will have exclusive outdoor rights in Amsterdam, Utrecht and Rotterdam.
  • 159. 159 Factsheet Outdoor II Source: VivaKi, December 2015 Publisher Objects Location JCDecaux Ad shells/6s, billboards, odd-sized objects, trams Bus and tram stations ExterionMedia Ad shells/6s, billboards, buses/trams, railway stations, posters and screens in shopping centres Street, shopping areas, public transport stations Clear Channel Ad shells/6s, city cells, billboards, masts, parking garages, schools, metro stations Street, schools, highway, tube- and parking Interbest Masts near highways A0, A1, A2 screens Highways Centercom Posters in supermarkets Streets, supermarkets MMD Media Shelters, digital screens, billboards, busses, airports Street, leisure indoor, sports, transport – airports OOHA Media Masts, LED masts Streets, highway Blowup Media Scaffolding large formats Streets Schiphol Media Big variety of media at Schiphol Airport Amsterdam Airport OV Media & Triple Media Buses, A3 posters in buses Buses Altermedia Toilet ads, taxi ads and truck ads Leisure indoor and public transport Boomerang Media Toilet ads, Freecards Leisure indoor horeca OV Media Bus ads, A3 screens Busses Triple Media Bus ads, A3 screens Busses
  • 160. 160 Radio by far the most popular media activity On the Go with a similar level of time spend at home 1:06 1:01 2:17 0:060:18 0:01 0:04 0:14 0:01 0:14 0:05 Average time spend per day in minutes Radio TV linear TV non-linear Magazine Newspaper Social Media Source: Media:Tijd 2015, base: All adults 13+ (N=2,818)
  • 161. 161 0% 10% 20% 30% 40% Share of gross media spend OOH 2013 2014 2015 2016 2017 Q1 Others Outdoor market is dominated in spend by 4 main players. In Q1 2017, relatively low share of spend for Clear Channel. Source: Nielsen, 2013 – 2017 Q1. Gross spend for out of home only.
  • 162. 162 Total reach per vendor is highest for age group 20-34. JCDecaux is dominant in billboard advertising. Source: BRO, March 2017, database version CAFAS 21.1 | Reach is based on total sights per vendor. 68% 77% 77% 67% 64% 59% 68% 73% 76% 69% 64% 58% 74% 81% 82% 75% 70% 64% 26% 26% 27% 26% 25% 23% 0% 20% 40% 60% 80% 100% 13-75 13-29 20-34 35-49 50-64 65-75 Shelters Exterion (5,174 sides) JCDecaux (9,124 sides) Clear Channel (8.172 sides) MMD (583 sides) 31% 32% 33% 32% 29% 27% 66% 68% 70% 68% 63% 58% 42% 46% 48% 42% 39% 36% 13% 14% 15% 13% 12% 11% 0% 20% 40% 60% 80% 100% 13-75 13-29 20-34 35-49 50-64 65-75 Billboards Exterion (190 sides) JCDecaux (998 sides) Clear Channel (382 sides) MMD (131 sides)
  • 163. 163 0 10 20 30 40 50 January February March April May June July August September October November December Outofhome grossmediaspendinmillions Out of Home Seasonality 2013 2014 2015 2016 2017 Q1 Although spend slightly peaks in Spring and Q4, outdoor advertising shows pretty stable levels of ad spend through the year. Source: Nielsen, 2013 – 2017 Q1. Gross spend for out of home only Total spend 2017 Q1: € 115,376,021 Total spend 2016 Q1: € 113,460,263 Total spend 2015 Q1: € 108,963,666 Total spend 2014 Q1: € 120,736,977 Total spend 2013 Q1: € 104,567,075
  • 164. 164 T-Mobile dominates the market of OOH spend. In general, the telecom category is highly visible in OOH advertising. Brand Category Gross spend Q1 2017 1 T-Mobile Telecom €3,306,045 2 McDonalds Fastfood €3,142,070 3 Corendon Travel €2,441,078 4 Tele2 Telecom €1,980,832 5 Aldi Retail €1,980,721 6 Belsimpel Telecom €1,570,670 7 Samsung Telecom €1,453,220 8 Simpel Telecom €1,370,948 9 Telfort Telecom €1,224,075 10 Zalando Retail €1,172,141 Source: Nielsen, 2017 Q1. Gross spend for out of home only.
  • 167. 167 Alternative formats II Public transport Street objects Toilet advertising
  • 168. 168 Digital Out of Home Source: Vivaki Digitale Out of Home Update, March 2017 With 12% of the total OOH market and 8,000 screens on 5,000 locations, Digital Out of Home still has a low share in The Netherlands. Nevertheless, the Dutch market is experiencing significant growth. It is expected that the increase in gross spends (+ 340% in 2016 compared to 2015) will continue in 2017. PwC Outlook predicts that in 2019 the share of spends of DOOH will increase to 40% of the total OOH market.
  • 169. 169 Specific Targeting New opportunities for communication with Digital Out of Home In the near future, programmatic buying for DOOH inventory will become bigger. The only company that currently offers programmatic buying is ‘MyAdbooker’. The possibilities are limited because the main players do not offer this. It is expected that in the near future it will be possible to target DOOH campaigns, in particular the creative materials, at specific target groups by the use of Detection Software. This software is able to anticipate on variables like age, gender, total passengers, mood. The opportunity of DOOH for real time communication are embraced by brands like Transavia, NS and the ‘Nierstichting’. Here, DOOH was used to offer real time travel places or to communicate directly with patients with a chronic kidney disease. Programmatic buying Real time communication Source: Vivaki Digitale Out of Home Update, March 2017| http://www.adformatie.nl/nieuws/transavia-adverteert-realtime-stoelenaanbod-outdoor-campagne | http://www.adformatie.nl/nieuws/programmatic-ooh- campagne-ns-op-basis-van-real-time-vluchtgegevens | https://www.nierstichting.nl/pers/2016/09/live-stream-op-stationsplein-rotterdam-maakt-wereld-nierpatient-weer-groot/
  • 170. 170 Beacons – consumer interaction 2.0 At 250 locations in Alkmaar and Purmerend all outdoor objects are provided with beacons. Exterion Media has the largest Dutch Beacon network. Beacons are Bluetooth 4.0 channels which can be detected by iOS and Android apps. All interaction takes place via the app on the user’s phone. The supplier of the app has many opportunities to initiate actions that are focused on place, time and the profile of the app user. In 2013, Apple launched their own iBeacon system. Google has launched their own Beacon ‘game changer’ in 2015, called EddyStone. It makes the deployment of beacons unprecedentedly simple and efficient. Amsterdam has installed a beacon network in its city center. The bluetooth beacons are located in several public spaces. The municipality of Amsterdam works together with JCDecaux, GVB (public transport), and Google. JCDecaux already has experience with this technology, its network is enriched with beacons (android only). Source: http://www.adformatie.nl/nieuws/exterion-media-rolt-beacon-netwerk-uit | http://www.adformatie.nl/blog/eddystone-maakt-integratie-van-beacons-marketingmix-tot-kinderspel | http://www.dktp.nl/wijzen-amsterdamse-bakens-de-weg-in-innovatieland/
  • 171. 171 MAAIKE DE VRIES Insights & Data Director [email protected] This media landscape presentation will be updated every quarter. For comments & questions, please contact the Starcom Insights & Data team. SANDER GEERLING Senior Insights & Data Consultant [email protected] MARJO VAN DEN AKKER Insights & Data Consultant [email protected]
  • 173. 173 TV audience measurement I ‘Stichting KijkOnderzoek’ (SKO) is the primary provider of the official television audience ratings in the Netherlands. SKO is a non-profit organization, organized as a Joint Industry Committee (JIC). The Media Standard Survey is used for weighting. The television audience measurement provides information on how many people watched a program, when they watch tv and what their characteristics are. Viewing data is collected second-by-second by means of a metering system that is installed at 1,250 house holds (2,750 persons) which is representative for the Netherlands. Ratings are reported minute-by-minute for channels received in the Netherlands independent of the way their signal is distributed. Source: www.kijkonderzoek.nl
  • 174. 174 CENSUS DATA By using VAST technology for online video (IAB standard). Incl. Desktop, Mobile and Tablet Introduction by SKO: 1 July’14 – 1 January ‘15 PANEL DATA Who is watching? What is % reach? Start 2015 DATA FUSION Mid 2015 ONLINE VIDEO TOTAAL(RTL, NPO, SBS only) September 2015 TV TOTAL (Linear & non-linear; via TV screen) Existing Video Total (April 2017) The core of the audience measurement is the common currency (TV Total). The measurement includes guest viewing in the panel households and time shifted viewing (on the day of broadcast plus the next six days). In order to achieve Video Total (TV + Online Video) SKO measures census data for online video and combines this with panel data to calculate the Online Video Total. Video Total was launched in April 2017. SKO also investigates new ways of viewing via so- called ‘satellites’ studies that are conducted alongside the currency measurement. This approach allows SKO to measure new forms of viewing behaviour (i.e. online video) without influencing the core currency data. Source: www.kijkonderzoek.nl TV audience measurement II
  • 175. 175 Digital audience measurement In 2015, de Verenigde Internet Exploitanten (VINEX) and Stichting KijkOnderzoek (SKO) have started het Nederlands Online Bereik Onderzoek (NOBO). NOBO, run by Kantar TNS, is the new currency for digital reach in 2016. NOBO is a collaboration involving more than twenty major media companies. Participating online media are provided with a tag. To also include global players like Facebook, NOBO has built-in an additional module that can report non-tagged sites. NOBO is linked to SKO for online video. Also NOM is involved for digital reach of magazines and newspapers. DAM Source: GfK April 2017 | http://www.adformatie.nl/nieuws/nederlands-bereiksonderzoek-nobo-officieel-van-start There are two providers of digital audience ratings in the Netherlands: DAM and NOBO.
  • 176. 176 Radio audience measurement NLO is a non-profit organization, organized as a Joint Industry Committee (JIC). The radio audience ratings are based on a log of a panel of 7,500 respondents. The Media Standard Survey is used for weighting. NLO has developed a new technique for measuring listening behavior. A portable electronic device with audio-matching technique will eventually replace the Radiolog. The new technique calculates radio reach per minute instead of per 15-minute interval. The release date is not announced yet. Source: NLO press release | 3 April 2017 ‘Nationaal Luister Onderzoek’ (National Listening Research) is the primary provider of the official radio audience ratings in the Netherlands.
  • 177. 177 Print audience measurement NOM (Nationaal Onderzoek Multimedia) is responsible for carrying out and reporting the national readership figures for daily newspapers and magazines. It reports average issue readership (AIR), which is a currency for newspapers and magazines in The Netherlands. From 2015, NOM also reports the average circulation figures and digital census data of newspapers, magazines and business magazines. Source: http://www.nommedia.nl | 21st April 2017 NOM is organized as a Joint Industry Committee (JIC), and was founded in 2001. In addition to the print currency, NOM also conducts a follow-up survey, asking about brand & product usage as well as a host of lifestyle questions and various areas of interests and hobbies. The combined survey, called NPDM, includes the print data as well as social demographic- and lifestyle data and media usage. The data is based on 19,000 respondents (NL 13+) and weighted to be nationally representative. It is published ones a year via a special software package.
  • 178. 178 Out of home audience measurement I ‘Het Buitenreclame Onderzoek’ (BRO) is the primary provider of the official OOH audience ratings in the Netherlands. With the launch of BRO in 2011, the new currency for audience measurement was avaliable for OOH: VAC, the visibility adjusted contact. Source: Het Buitenreclame Onderzoek, 21st April ‘17 VAC is based on multiple data sets regarding people, movement and object classification: Measuring of all traffic (Mobiliteitsonderzoek Nederland; Field research to travel behaviour (TNS); Inventory and classification of street objects; Differentiates visibility between location of objects (near pathway, railway stations, shopping centres, supermarkets, parking garages, petrol stations and traffic advertisement).
  • 179. 179 Out of home audience measurement II For measuring all traffic TNS has carried out a travel survey over a period of nine months (N=10.637). The ‘Gouden Standaard 2010’ is used for weighting. For this study the Netherlands has been divided into 30 regions, each one around a city with at least 75,000 inhabitants. Each of the individual regions/media owner packages can be analysed via specialist software developed by BRO: Cafas. Pre-defined male/female target audiences (13-75 years old) can be used. Source: Het Buitenreclame Onderzoek, 2nd september ‘15
  • 180. 180 Cinema audience measurement Commissioned by the ‘Nederlandse Vereniging van Bioscopen en Filmtheaters (NVBF)’ and ‘Filmdistributeurs Nederland (FDN)’, ‘Stichting Filmonderzoek’ periodically studies the range of cinemas /movie theatres, the frequency of visits and the market share of Dutch cinema visitors. This provides insight into cinema behavior of the Dutch population. For the ‘bioscoopmonitor 2016’, quarterly fieldwork took place among a core group of panel members (N= 11,422) of CentERdata and young panel members of LISS panel. The panel members were asked whether – and if so, how often – they have been visited the cinemas and/or movie theatre in the previous quarter and whether they have visited a Dutch movie.
  • 181. 181 Media:tijd is the most recent study released in Q2 2016 and covers time spend of Tuch consumers in 2015. The first release was in 2014 (data of 2013). Media:tijd is a collaboration between: Since Q2 2015 Crossmedia:Tijd is available. Crossmedia:Tijd is a fusion of data from multiple reach and time spend currencies: Source: Media:tijd 2015 (9 september – 11 oktober 2013) (1 juli 2012 – 30 juni 2013) (1 juli 2012 – 30 juni 2013) (28 april 2014 – 26 mei 2014) (26 augustus – 17 november 2013) The Crossmedia:Tijd study enables to create campaign scenarios by using cross media reach. BRO (JIC out of home reach measurement) has announced that the OOH reach study will also be part of the next Crossmedia:Tijd data fusion. Media:tijd & Crossmedia:tijd
  • 182. 182 Nielsen Ad spend measurement Nielsen measures the gross ad spend in more than 1,300 individual channels / titles in 10 media types:  Television -Spot and billboards  Radio -Spot  Internet - Display (desktop, tablet, smartphone) - Video (desktop, tablet, smartphone)  Consumer magazines  Newspapers - National and local  Consumer magazines  Trade magazines  Out of home  Cinema  Door drops  Direct mail The ad spend calculation is based on rate card. Discounts or special price agreements are not taken into account to ensure a fair comparison of the media pressure between brands and media. The ad spend data is updated twice a week.​