O Giracoro é um grupo de canto coral com cerca de vinte integrantes de Florianópolis que executa arranjos vocais e instrumentais de músicas da tradição oral brasileira, acompanhados de danças e brincadeiras populares. O grupo se formou em 2010 e se reúne semanalmente para ensaiar sob a liderança da maestrina Ive Luna.
Este documento describe diferentes tipos de robots. Incluye robots sedentarios con movimiento limitado que se usan en áreas de trabajo amplias, robots móviles en plataformas que transportan piezas en cadenas de fabricación, y androides humanoides que intentan imitar la forma y movimiento humanos pero aún no son muy avanzados. También describe robots zoomórficos multípedos que imitan la locomoción de animales y podrían usarse para exploración espacial o volcanes, y robots híbridos que combinan características de varios tipos.
Sterling Medical Device Company Profile 2015Daniela Levy
Sterling Medical Registration provides regulatory and quality consulting services for medical device companies. They have over 17 years of experience in the medical device field, specializing in dental implant systems. Their services include quality system implementation, product testing, clinical testing, registrations, and more to help companies meet applicable regulations and achieve their market goals.
This workshop has been held at Legal Business Day on 20 September 2012.
This workshop provided the inside scoop on the latest trends and threats in anti-piracy enforcement on the Internet. Teaming up with the cybercrime experts from the well-known firm Fox IT, this workshop gave a joint approach on how attorneys and forensic investigators should deal with anti-piracy and cybercrime. Strategies, costs, forensic investigation and legal remedies will be discussed.
Grey water recycling and reuse has many benefits but also poses some risks if not done properly. Treated grey water can be used for applications that don't require drinking water quality, such as toilet flushing and irrigation, in order to reduce fresh water usage. However, precautions must be taken to ensure the treated grey water is hygienically safe and not a source of odors or contamination. Separate plumbing is required for grey water and factors like the treatment system used, existing infrastructure, and end use of the water must all be considered to safely implement grey water recycling.
El documento presenta la información de 5 estudiantes que pertenecen al Grupo N°2 del paralelo T-1 en el aula B-107. Incluye una matriz guía con preguntas sobre temas históricos y una investigación, análisis y deberes de ciudadanos de acuerdo a la Constitución del Ecuador.
This document describes how to create a Stock Requirements Report in SAP BW similar to transaction MD04 in SAP R/3. It involves creating a generic datasource using a function module that extracts stock requirement data from R/3 and loads it into a virtual infocube in BW, allowing users to report on the current stock levels with different filters and selections, similar to the transactional MD04 report.
The document introduces a new UI for cost center planning in SAP ECC 6.0 EhP6. It provides the benefits of the new solution such as reduced TCO, high end user acceptance, and adaptability to business needs. It describes cost center primary cost planning as the role model, covering features like the web and excel frontends, manual data entry, integration with ERP, and query adaptations. Other renovated planning applications are also discussed along with implementation details.
What’s new in SAP BusinessObject BI 4.1? (part1)tasmc
The document discusses SAP's BusinessObjects Business Intelligence 4.1 software. It focuses on SAP's strategic priorities of core BI capabilities, self-service analytics, mobile BI, big data and social BI. The software suite provides unified and personalized insights through powerful visualizations to enable faster, more accurate decisions. It offers a single standard for enterprise BI with a professional grade platform and broad ecosystem support. New features in version 4.1 include improved deployment tools, multi-tenancy, offline mobile dashboards and support for additional data sources and languages.
SAP NetWeaver Portal 7.3 - top 5 Reasons to upgrade your portaltasmc
The document discusses 5 reasons to upgrade to SAP NetWeaver Portal 7.3: 1) A new Ajax framework provides improved usability, performance, and development capabilities. 2) End users can create their own pages and workspaces to access and share content. 3) The portal can be consumed on mobile devices. 4) An integrated document management solution improves content governance and collaboration. 5) Future investments will focus on social capabilities, tablet/mobile access, and integration with SAP HANA.
This document discusses dashboards in SAP BusinessObjects (BO). It begins with an agenda that outlines an introduction to BO dashboards and what's new in version 4.1. It then discusses how dashboards provide visual displays of information for strategic decision making and monitoring KPIs. The document outlines features of BO dashboards like interactivity, predefined visualizations, flexibility in data connections, and export options. It reviews new capabilities in version 4.1 like offline support and mobile compatibility. It demos dashboard design in BO and provides best practices for performance like reducing initialization time by optimizing queries, calculations, and bindings.
This document discusses SAP's BusinessObjects Design Studio and dashboards. It begins with an agenda that covers an introduction and live demo of Design Studio in Part 1 and dashboards in Part 2. It then discusses SAP's BI strategy of providing a single platform for all analytics needs. Several slides provide overviews and definitions of dashboards and how Design Studio can be used to build engaging experiences and applications. Key features of Design Studio highlighted include creating analysis applications and dashboards for browsers and mobile devices using BW and HANA data sources. Live demos of Design Studio iPad samples are also provided.
1. The document provides steps for exercises using SAP Lumira to connect to a HANA database, acquire and enrich data, perform transformations like filtering, and create visualizations.
2. The exercises cover acquiring data from HANA, performing semantic enrichment on measures, time, and geography dimensions, correcting errors and modifying dimension values, filtering datasets, and creating charts to analyze revenue by genre, region, and retailer.
3. Analysis of revenue by state and retailer identified low values for retailers in specific cities, suggesting the need to adjust marketing strategies to increase revenue in those areas.
This document provides instructions for hands-on exercises using SAP Web Intelligence (WEBI) to create reports on operational analysis using a HANA database. The exercises demonstrate how to: 1) create a basic monthly operating report using dimensions like Year, Month and Revenue; 2) enhance the report with graphs and additional dimensions for product analysis; and 3) add ranking capabilities to analyze data like revenue rankings across cities for each product genre. The goal is to learn fundamental WEBI reporting, charting, and analysis features to produce easy-to-understand operational and performance reports.
The document discusses new business intelligence tools from SAP that leverage the HANA in-memory platform. It introduces SAP Lumira for self-service data exploration and visualization, SAP Predictive Analysis for forecasting and trend analysis, and SAP Design Studio for creating analytic applications and dashboards. It emphasizes how these tools combined with HANA allow for real-time insights and predictive analytics on large data sets.
SAP provides a complete enterprise BI solution that includes tools to provide executives and general business users with key performance indicators and reports to improve accuracy and efficiency in decision making. It also supports a single platform for housing large amounts of operational data so that businesses can see the full state of operations through a single entry point. The solution includes tools for self-service analytics, visualization, and faster decision making, a single place for all company information, and a standard approach to enterprise BI for solid and faster, more accurate decisions.
SAP BusinessObjects Dashboards (Xcelsius) 能夠提供高互動性的What-If假設分析,也能協助您從即時的資料來源進行分析,台灣應用(tasmc) BI team具有提供客製個人化的儀表板,且幫助客戶提升儀表板執行效率的豐富經驗,希望藉由分享此文件協助您了解Dashboards (Xcelsius) 執行時的整體架構,並根據各執行階段分析如何提升儀表板的執行度。
This document discusses SAP's mobile business intelligence solutions. It begins with an overview of the trend of enterprise mobile analytics, noting that by 2015 over 1.3 billion workers, or 37.2% of the total workforce, will be mobile. It then covers SAP's main mobile BI offerings: SAP BusinessObjects Mobile for accessing Web Intelligence reports and Dashboards on mobile devices, and SAP BusinessObjects Explorer for self-service search and visual exploration of BI data on mobile. Several screenshots demonstrate examples of Web Intelligence reports, Dashboards, and location-based analytics on iPad. The document concludes with a discussion of SAP BusinessObjects Explorer's features for mobile.
1. SAP BI 4.0 on HANA Workshop Dashboard Hands-on / Solutions
SAP BI 4.0 on HANA Workshop
Dashboard
Hands-on /Solutions
2. P. 01
2013. June 28
本篇文章版權為台灣應用管理顧問股份有限公司所有,未經書面同意,嚴禁複製、轉載!
Overview of the Business Case
SAP BusinessObjects Dashboard is a data visualization tool that displays the current status of
metrics and key performance indicators (KPIs) for an enterprise. Dashboards consolidate and
arrange numbers, metrics and sometimes performance scorecards on a single screen. They
may be tailored for a specific role and display metrics targeted for a single point of view or
department. The essential features of a BI dashboard product include a customizable
interface and the ability to pull real-time data from multiple sources.
We will learn how to use Dashboard connect HANA by using Universe as data source. Adding
query and do data visualization for our focusing KPIs.
Exercise 1:Establish Dashboard
Objective: In this exercise, you will learn how to establish a simple visualization dashboard
with interactive function.
Steps:
1. Start the application and click on “Blank Mode” in the window.
3. P. 02
2013. June 28
本篇文章版權為台灣應用管理顧問股份有限公司所有,未經書面同意,嚴禁複製、轉載!
2. 找到左方控制面板:查詢瀏覽器,按下“新增查詢”
3. Enter BOE logon Information as below.
系統:W2K8CH-R2
使用者名稱:administrator
密碼:Passw0rd
驗證:Enterprise
4. P. 03
2013. June 28
本篇文章版權為台灣應用管理顧問股份有限公司所有,未經書面同意,嚴禁複製、轉載!
4. 選擇語意層做為資料來源,按下下一步.
5. 選取 DVD_RENTAL_ANAYLSIS.unx,按下下一步.
5. P. 04
2013. June 28
本篇文章版權為台灣應用管理顧問股份有限公司所有,未經書面同意,嚴禁複製、轉載!
6. 建立查詢面板,我們要在儀表板上呈現每月毛利是否達成
a. 在結果物件的地方選擇 Month, Margin Gross, Target
b. 在結果集的部分,可以按下重新整理預覽所選的維度的資料
c. 按下下一步
6. P. 05
2013. June 28
本篇文章版權為台灣應用管理顧問股份有限公司所有,未經書面同意,嚴禁複製、轉載!
7. 預覽全部資料的結果,按下確定
8. 回到儀表板的畫面中,可看到查詢瀏覽器出現剛才建立好了新查詢
7. P. 06
2013. June 28
本篇文章版權為台灣應用管理顧問股份有限公司所有,未經書面同意,嚴禁複製、轉載!
9. 在左方的元件面板中,找到組合圖,並拉至畫布
10. 選擇組合圖,可看到右方屬性設定面板。設定圖表的標題以及在圖表中要呈現的維度與數字
a. 設定圖表標題:年度毛利與預算
b. 設定資料來源:依數列,按下下方的“+”號,可看到新增了一個數列 1
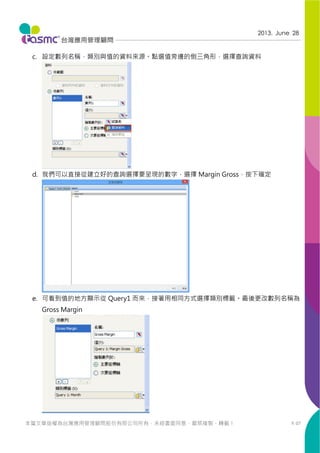
8. P. 07
2013. June 28
本篇文章版權為台灣應用管理顧問股份有限公司所有,未經書面同意,嚴禁複製、轉載!
c. 設定數列名稱,類別與值的資料來源。點選值旁邊的倒三角形,選擇查詢資料
d. 我們可以直接從建立好的查詢選擇要呈現的數字,選擇 Margin Gross,按下確定
e. 可看到值的地方顯示從 Query1 而來,接著用相同方式選擇類別標籤。最後更改數列名稱為
Gross Margin
9. P. 08
2013. June 28
本篇文章版權為台灣應用管理顧問股份有限公司所有,未經書面同意,嚴禁複製、轉載!
f. 在建立一個新的樹列為 Target,利用相同方式選擇值
g. 建立好之後,按下上方工具列的預覽,可以預覽做好的組合圖
11. 接著,選取儀表圖來呈現整年度的 Total Revenue。將儀表圖拉至畫布
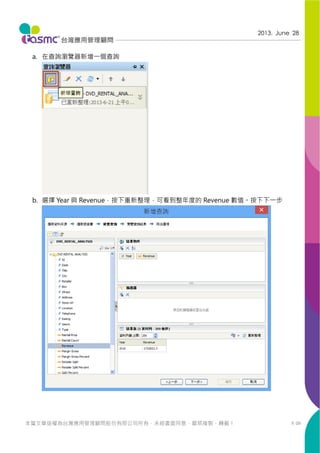
10. P. 09
2013. June 28
本篇文章版權為台灣應用管理顧問股份有限公司所有,未經書面同意,嚴禁複製、轉載!
a. 在查詢瀏覽器新增一個查詢
b. 選擇 Year 與 Revenue,按下重新整理,可看到整年度的 Revenue 數值。按下下一步
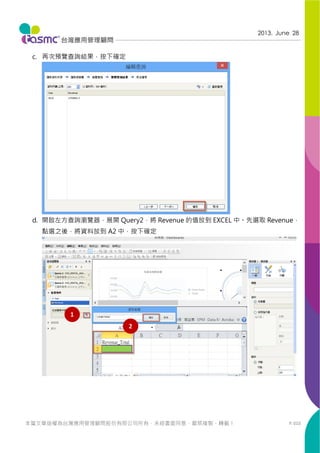
11. P. 010
2013. June 28
本篇文章版權為台灣應用管理顧問股份有限公司所有,未經書面同意,嚴禁複製、轉載!
c. 再次預覽查詢結果,按下確定
d. 開啟左方查詢瀏覽器,展開 Query2,將 Revenue 的值放到 EXCEL 中。先選取 Revenue,
點選之後,將資料放到 A2 中,按下確定
12. P. 011
2013. June 28
本篇文章版權為台灣應用管理顧問股份有限公司所有,未經書面同意,嚴禁複製、轉載!
e. 接著設定儀表圖的資料來源,點選儀表圖,設定標題為 Total Revenue。設定資料來源,選
擇依範圍,點選剛才設定在 EXCEL 中 A2 的格子當成資料來源,按下確定
f. 設定儀表圖指針縮放,選擇自動->零基準
g. 按下預覽
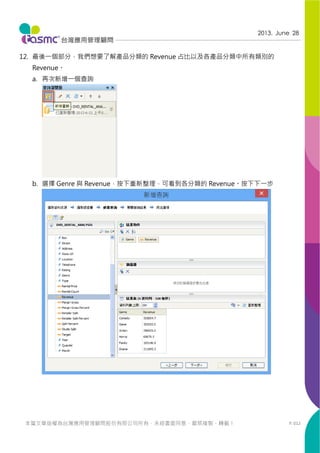
13. P. 012
2013. June 28
本篇文章版權為台灣應用管理顧問股份有限公司所有,未經書面同意,嚴禁複製、轉載!
12. 最後一個部分,我們想要了解產品分類的 Revenue 占比以及各產品分類中所有類別的
Revenue。
a. 再次新增一個查詢
b. 選擇 Genre 與 Revenue,按下重新整理,可看到各分類的 Revenue。按下下一步
14. P. 013
2013. June 28
本篇文章版權為台灣應用管理顧問股份有限公司所有,未經書面同意,嚴禁複製、轉載!
c. 預覽查詢結果
d. 選取圓形圖並拉至畫布
15. P. 014
2013. June 28
本篇文章版權為台灣應用管理顧問股份有限公司所有,未經書面同意,嚴禁複製、轉載!
e. 設定圓形圖圖表標題為各類別銷售額與資料來源(設定值與標籤:選取剛才建立的 Query3)
f. 從 Query3 中選取值與標籤,值:Revenue,標籤:Genre,按下確定即設定完成
16. P. 015
2013. June 28
本篇文章版權為台灣應用管理顧問股份有限公司所有,未經書面同意,嚴禁複製、轉載!
g. 建立第四個查詢,這個查詢會根據選取圓餅圖中的值帶出各類別中類型的銷售額。選取 Type
與 Revenue。在篩選器的部分,新增 Genre,點選下拉式選單,選擇提示
h. 設定提示:依照下圖勾選所有打勾項目,並設定預設值為 Comedy
i. 完成篩選的設定之後,按下確定設定完成 Query4
13. 設定圖形 Drill Down(Interactive)功能
a. 選取 Query3,將 Genre 的值插入至 EXCEL 中(綠色底部分 D2:D7)。接著在插入的 TAB 中,
17. P. 016
2013. June 28
本篇文章版權為台灣應用管理顧問股份有限公司所有,未經書面同意,嚴禁複製、轉載!
勾選啟用資料插入
b. 設定資料插入的來源資料。來源資料為剛才插入至 EXCEL 中的範圍(綠色底部分 D2:D7)
18. P. 017
2013. June 28
本篇文章版權為台灣應用管理顧問股份有限公司所有,未經書面同意,嚴禁複製、轉載!
c. 設定資料選取後要放置在哪個 EXCEL 格子。我們將資料放在 D8(黃色底部分 D8)
d. 接著選取直條圖拉到畫布並放置在圓形圖旁邊
e. 設定直條圖的標題:根據選擇到的類別呈現,選擇 D8
19. P. 018
2013. June 28
本篇文章版權為台灣應用管理顧問股份有限公司所有,未經書面同意,嚴禁複製、轉載!
f. 設定直條圖的資料來源:新增一數列,選擇 Query4 中的 Revenue 以及 Type 為值和類別
g. 設定 Query 為依據選取類別而產生資料。點選 Query4,按下編輯
20. P. 019
2013. June 28
本篇文章版權為台灣應用管理顧問股份有限公司所有,未經書面同意,嚴禁複製、轉載!
h. 在預覽查詢結果後,按下下一步,設定這隻 Query 要依據哪個值觸發並產生資料。在觸發儲
存格的地方設定為 D8 後,按下確定
i. 除了需要設定觸發儲存格之外,也需要設定 Query4 中設置的提示(查訊面板中篩選清單)
的選取值從哪個位置而來,選擇 D8
j. 按下預覽,即可依據選取的類別呈現該類別個產品的銷售額