SlideShare a Scribd company logo
Using AWR For Wait AnalysisMike Ault, Oracle GuruMarch  2011The World’s Fastest Storage® for over thirty years!
Michael R. Ault, Oracle Guru Nuclear Navy 6 years
 Nuclear Chemist/Programmer 10 years
 Kennedy Western University Graduate
 Bachelors Degree Computer Science
 Certified in all Oracle Versions Since 6
 Oracle DBA, author, since 1990Books by Michael R. Ault
StatspackAnalyzer.comFree Statspack/AWR Analysis Sponsored by Texas Memory SystemsLooks for IO bottlenecks and other configuration issues.
Straightforward tuning adviceIntroductionStatspack was introduced in 8.1.7AWR came out in Oracle10gBoth are very similarBoth provide a top-down look at performance statistics
What Is AWR?A background processA set of tablesA set of reportsTakes snapshots of statistics every hourTakes snapshot of high-cost SQL every hour
Preparation for AnalysisKnow your systems normal performance fingerprintBe familiar with Concepts and Tuning GuidesHave “normal” AWR/Statspacks for comparison
Top-Down ApproachReport starts with settings overviewNext provides Top-5 waitsUse the Waits to guide further investigation
AWR Report HeaderWORKLOAD REPOSITORY report forDB Name         DB Id    Instance     Inst Num Startup Time    Release     RAC------------ ----------- ------------ -------- --------------- ----------- ---AULTDB        4030696936 aultdb1             1 04-Aug-08 10:16 11.1.0.6.0  YESHost Name        Platform                         CPUs Cores Sockets Memory(GB)---------------- -------------------------------- ---- ----- ------- ----------aultlinux3       Linux IA (32-bit)                   2     1       1       2.97              Snap Id      Snap Time      Sessions Curs/Sess--------- ------------------- -------- ---------Begin Snap:        91 04-Aug-08 12:00:15        41       1.2  End Snap:        92 04-Aug-08 13:00:28        47       1.1Elapsed:               60.22 (mins)   DB Time:              139.52 (mins)Cache Sizes                       Begin        End~~~~~~~~~~~                  ---------- ----------               Buffer Cache:     1,312M     1,312M  Std Block Size:         8K           Shared Pool Size:       224M       224M      Log Buffer:    10,604K
Know Your Load Type!Online Transaction ProcessingFew readsMany writesMany small transactionsLook for redo/undo and sequential read issuesDecision Support/Data WarehouseMany readsFew writes (other then possible temp)Few transactionsLook for sort/workarea and scattered read issuesMixed or Hybrid
Load Profile SectionLoad Profile              Per Second    Per Transaction   Per Exec   Per Call~~~~~~~~~~~~         ---------------    --------------- ---------- ----------      DB Time(s):                2.3                7.1       0.63       1.05       DB CPU(s):                0.3                0.9       0.07       0.13       Redo size:              800.5            2,461.8   Logical reads:            6,307.6           19,396.7   Block changes:                3.6               10.9  Physical reads:            2,704.9            8,317.8 Physical writes:               86.9              267.3      User calls:                2.2                6.8          Parses:                2.0                6.1     Hard parses:                0.0                0.1W/A MB processed:          932,965.4        2,868,990.9          Logons:                0.1                0.2        Executes:                3.7               11.3       Rollbacks:                0.1                0.3    Transactions:                0.3
What Are Your EfficienciesShould be close to 100%Parse issues usually are a result of:Bad bind variable usageInsufficient memoryWill also be co-indicated by low percentage of memory for multiple SQL execution
Load Profile SectionInstance Efficiency Percentages (Target 100%)~~~~~~~~~~~~~~~~~~~~~~~~~~~~~~~~~~~~~~~~~~~~~            Buffer Nowait %:  100.00       Redo NoWait %:   99.97            Buffer  Hit   %:   96.09    In-memory Sort %:  100.00            Library Hit   %:   98.17        Soft Parse %:   97.88         Execute to Parse %:   45.80         Latch Hit %:   99.95Parse CPU to ParseElapsd %:    0.00     % Non-Parse CPU:   99.77Shared Pool Statistics        Begin    End                              ------  ------             Memory Usage %:   81.53   85.39    % SQL with executions>1:   79.29   79.48  % Memory for SQL w/exec>1:   76.73   78.19
Top 5 Waits SectionCritical to look closely at this sectionUse highest wait times to guide investigationDB FILE type waits – physical IOBUFFER type waits – Logical IOLOG type waits – Redo relatedPX – Parallel QueryGC – Global Cache (RAC related)Undo – Undo or rollback segment related
Top 5 Waits SectionTop 5 Timed Foreground Events~~~~~~~~~~~~~~~~~~~~~~~~~~~~~Avg                                                          wait   % DBEvent                                 Waits     Time(s)   (ms)   time Wait Class------------------------------ ------------ ----------- ------ ------ ----------db file sequential read             465,020       3,969      9   47.4 User I/ODB CPU                                              995          11.9db file parallel read                 2,251         322    143    3.8 User I/Odb file scattered read               15,268         153     10    1.8 User I/Ogc current block 2-way              108,739         116      1    1.4 Cluster
DB File Type WaitsDB File Sequential Reads – memory starvation, non-selective indexesDB File Scattered Reads – full table scans, insufficient indexingDirect Path Writes – Appends, data loadsDirect Path Reads – Parallel slaves used to retrieve dataDB File Parallel Writes – Backup and partition useDB File Parallel Reads – Partition useDB File Single Write – File header writes, excessive data filesDirect path read temp – Temp file activity (sorts, hashes, temp tables,  bitmaps)Direct path write temp – Temp file activity (sorts, hashes, temp tables, bitmaps)
Buffer Type Waitslatch: cache buffers chains – Hot blocks, check for hot objectsfree buffer waits – Insufficient buffers, processes holding buffers too 	long, IO subsystem over loadedbuffer busy waits – See what is causing them further along in reportgc buffer busy – Overloaded interconnect, find problem objects and tunelog buffer space – High load, too small a log buffer, increase log buffer sizelatch: cache buffers lru chain – Freelist issues, hot blockslatch: cache buffer handles – Freelist issues, hot blocksbuffer busy - See what is causing them further along in reportno free buffers – Insufficient buffers, dbwr contention
Buffer Type Waitslatch: cache buffers chains – Hot blocks, check for hot objectsfree buffer waits – Insufficient buffers, processes holding buffers 	too long, IO subsystem over loadedbuffer busy waits – See what is causing them further along in reportgc buffer busy – Overloaded interconnect, find problem objects and tunelog buffer space – High load, too small a log buffer, increase log buffer sizelatch: cache buffers lru chain – Freelist issues, hot blockslatch: cache buffer handles – Freelist issues, hot blocksbuffer busy - See what is causing them further along in reportno free buffers – Insufficient buffers, dbwr contention
Buffer Type Waitslatch: cache buffers chains – Hot blocks, check for hot objectsfree buffer waits – Insufficient buffers, processes holding buffers too long, IO subsystem over loadedbuffer busy waits – See what is causing them further along in reportgc buffer busy – Overloaded interconnect, find problem objects and tunelog buffer space – High load, too small a log buffer, increase log buffer sizelatch: cache buffers lru chain – Freelist issues, hot blockslatch: cache buffer handles – Freelist issues, hot blocksbuffer busy - See what is causing them further along in reportno free buffers – Insufficient buffers, dbwr contention
Log Type Waitslog file parallel write – Look  for log file contentionlog buffer space – Look at increasing log buffer sizelog file switch (checkpoint incomplete) – May indicate excessive db files or slow IO subsystemlog file switch (archiving needed) – Indicates archive files are written too slowlylog file switch completion – May need more log files per threadlog file sync – Could indicate excessive commits
PX Type WaitsPX Deq: Msg Fragment – PEM maybe too smallPX qref latch - Data is produced faster than it is consumed, look at PEMPX Deq Credit: send blkd – Look at PEM size and parallel query into non-parallel DML
GC Eventsgccr multi block request – Full table or index scansgc current multi block request – Full table or index scansgccr block 2-way – Blocks are busy in another instance, check for block level contention or hot blocksgccr block 3-way – Blocks are busy in another instance, check for block level contention or hot blocksgccr block busy – Blocks are busy in another instance, check for block level contention or hot blocksgccr block congested – cr block congestion, check for hot blocks or busy interconnectgccr block lost – Indicates interconnect issues and contentiongc current block 2-way – Blocks are busy in another instance, check for block level contention or hot blocksgc current block 3-way – Blocks are busy in another instance, check for block level contention or hot blocksgc current block busy – Block is already involved in GC operation, shows hot blocks or congestiongc current block congested – current block congestion, check for hot blocks or busy interconnectgc current block lost - Indicates interconnect issues and contention
Undo Eventsundo segment extension – If excessive, tune undolatch: In memory undo latch – If excessive could be bug, check for your version, may have to turn off in memory undowait for a undo record – Usually only during recovery of large transactions, look at turning off parallel undo recovery.
Ad

More Related Content

What's hot (20)

MongoDB Performance Debugging
MongoDB Performance DebuggingMongoDB Performance Debugging
MongoDB Performance Debugging
MongoDB
 
Oracle statistics by example
Oracle statistics by exampleOracle statistics by example
Oracle statistics by example
Mauro Pagano
 
Oracle Database統合のベスト・プラクティス
Oracle Database統合のベスト・プラクティスOracle Database統合のベスト・プラクティス
Oracle Database統合のベスト・プラクティス
オラクルエンジニア通信
 
Oracle db performance tuning
Oracle db performance tuningOracle db performance tuning
Oracle db performance tuning
Simon Huang
 
The Oracle RAC Family of Solutions - Presentation
The Oracle RAC Family of Solutions - PresentationThe Oracle RAC Family of Solutions - Presentation
The Oracle RAC Family of Solutions - Presentation
Markus Michalewicz
 
MS-SQL SERVER ARCHITECTURE
MS-SQL SERVER ARCHITECTUREMS-SQL SERVER ARCHITECTURE
MS-SQL SERVER ARCHITECTURE
Douglas Bernardini
 
How to Use EXAchk Effectively to Manage Exadata Environments
How to Use EXAchk Effectively to Manage Exadata EnvironmentsHow to Use EXAchk Effectively to Manage Exadata Environments
How to Use EXAchk Effectively to Manage Exadata Environments
Sandesh Rao
 
Move your oracle apps to oci
Move your oracle apps to ociMove your oracle apps to oci
Move your oracle apps to oci
VamsiKrishna815
 
Analyzing and Interpreting AWR
Analyzing and Interpreting AWRAnalyzing and Interpreting AWR
Analyzing and Interpreting AWR
pasalapudi
 
New Generation Oracle RAC Performance
New Generation Oracle RAC PerformanceNew Generation Oracle RAC Performance
New Generation Oracle RAC Performance
Anil Nair
 
Tanel Poder - Performance stories from Exadata Migrations
Tanel Poder - Performance stories from Exadata MigrationsTanel Poder - Performance stories from Exadata Migrations
Tanel Poder - Performance stories from Exadata Migrations
Tanel Poder
 
Understanding oracle rac internals part 1 - slides
Understanding oracle rac internals   part 1 - slidesUnderstanding oracle rac internals   part 1 - slides
Understanding oracle rac internals part 1 - slides
Mohamed Farouk
 
Your tuning arsenal: AWR, ADDM, ASH, Metrics and Advisors
Your tuning arsenal: AWR, ADDM, ASH, Metrics and AdvisorsYour tuning arsenal: AWR, ADDM, ASH, Metrics and Advisors
Your tuning arsenal: AWR, ADDM, ASH, Metrics and Advisors
John Kanagaraj
 
An Introduction To Oracle Database
An Introduction To Oracle DatabaseAn Introduction To Oracle Database
An Introduction To Oracle Database
Meysam Javadi
 
Oracle RAC - New Generation
Oracle RAC - New GenerationOracle RAC - New Generation
Oracle RAC - New Generation
Anil Nair
 
シンプルでシステマチックな Oracle Database, Exadata 性能分析
シンプルでシステマチックな Oracle Database, Exadata 性能分析シンプルでシステマチックな Oracle Database, Exadata 性能分析
シンプルでシステマチックな Oracle Database, Exadata 性能分析
Yohei Azekatsu
 
Oracle RAC 19c and Later - Best Practices #OOWLON
Oracle RAC 19c and Later - Best Practices #OOWLONOracle RAC 19c and Later - Best Practices #OOWLON
Oracle RAC 19c and Later - Best Practices #OOWLON
Markus Michalewicz
 
Data Guard Architecture & Setup
Data Guard Architecture & SetupData Guard Architecture & Setup
Data Guard Architecture & Setup
Satishbabu Gunukula
 
Introducing the Oracle Cloud Infrastructure (OCI) Best Practices Framework
Introducing the Oracle Cloud Infrastructure (OCI) Best Practices FrameworkIntroducing the Oracle Cloud Infrastructure (OCI) Best Practices Framework
Introducing the Oracle Cloud Infrastructure (OCI) Best Practices Framework
Revelation Technologies
 
Oracle GoldenGate 21c New Features and Best Practices
Oracle GoldenGate 21c New Features and Best PracticesOracle GoldenGate 21c New Features and Best Practices
Oracle GoldenGate 21c New Features and Best Practices
Bobby Curtis
 
MongoDB Performance Debugging
MongoDB Performance DebuggingMongoDB Performance Debugging
MongoDB Performance Debugging
MongoDB
 
Oracle statistics by example
Oracle statistics by exampleOracle statistics by example
Oracle statistics by example
Mauro Pagano
 
Oracle db performance tuning
Oracle db performance tuningOracle db performance tuning
Oracle db performance tuning
Simon Huang
 
The Oracle RAC Family of Solutions - Presentation
The Oracle RAC Family of Solutions - PresentationThe Oracle RAC Family of Solutions - Presentation
The Oracle RAC Family of Solutions - Presentation
Markus Michalewicz
 
How to Use EXAchk Effectively to Manage Exadata Environments
How to Use EXAchk Effectively to Manage Exadata EnvironmentsHow to Use EXAchk Effectively to Manage Exadata Environments
How to Use EXAchk Effectively to Manage Exadata Environments
Sandesh Rao
 
Move your oracle apps to oci
Move your oracle apps to ociMove your oracle apps to oci
Move your oracle apps to oci
VamsiKrishna815
 
Analyzing and Interpreting AWR
Analyzing and Interpreting AWRAnalyzing and Interpreting AWR
Analyzing and Interpreting AWR
pasalapudi
 
New Generation Oracle RAC Performance
New Generation Oracle RAC PerformanceNew Generation Oracle RAC Performance
New Generation Oracle RAC Performance
Anil Nair
 
Tanel Poder - Performance stories from Exadata Migrations
Tanel Poder - Performance stories from Exadata MigrationsTanel Poder - Performance stories from Exadata Migrations
Tanel Poder - Performance stories from Exadata Migrations
Tanel Poder
 
Understanding oracle rac internals part 1 - slides
Understanding oracle rac internals   part 1 - slidesUnderstanding oracle rac internals   part 1 - slides
Understanding oracle rac internals part 1 - slides
Mohamed Farouk
 
Your tuning arsenal: AWR, ADDM, ASH, Metrics and Advisors
Your tuning arsenal: AWR, ADDM, ASH, Metrics and AdvisorsYour tuning arsenal: AWR, ADDM, ASH, Metrics and Advisors
Your tuning arsenal: AWR, ADDM, ASH, Metrics and Advisors
John Kanagaraj
 
An Introduction To Oracle Database
An Introduction To Oracle DatabaseAn Introduction To Oracle Database
An Introduction To Oracle Database
Meysam Javadi
 
Oracle RAC - New Generation
Oracle RAC - New GenerationOracle RAC - New Generation
Oracle RAC - New Generation
Anil Nair
 
シンプルでシステマチックな Oracle Database, Exadata 性能分析
シンプルでシステマチックな Oracle Database, Exadata 性能分析シンプルでシステマチックな Oracle Database, Exadata 性能分析
シンプルでシステマチックな Oracle Database, Exadata 性能分析
Yohei Azekatsu
 
Oracle RAC 19c and Later - Best Practices #OOWLON
Oracle RAC 19c and Later - Best Practices #OOWLONOracle RAC 19c and Later - Best Practices #OOWLON
Oracle RAC 19c and Later - Best Practices #OOWLON
Markus Michalewicz
 
Introducing the Oracle Cloud Infrastructure (OCI) Best Practices Framework
Introducing the Oracle Cloud Infrastructure (OCI) Best Practices FrameworkIntroducing the Oracle Cloud Infrastructure (OCI) Best Practices Framework
Introducing the Oracle Cloud Infrastructure (OCI) Best Practices Framework
Revelation Technologies
 
Oracle GoldenGate 21c New Features and Best Practices
Oracle GoldenGate 21c New Features and Best PracticesOracle GoldenGate 21c New Features and Best Practices
Oracle GoldenGate 21c New Features and Best Practices
Bobby Curtis
 

Viewers also liked (20)

Performance Tuning With Oracle ASH and AWR. Part 1 How And What
Performance Tuning With Oracle ASH and AWR. Part 1 How And WhatPerformance Tuning With Oracle ASH and AWR. Part 1 How And What
Performance Tuning With Oracle ASH and AWR. Part 1 How And What
udaymoogala
 
Reading AWR or Statspack Report - Straight to the Goal
Reading AWR or Statspack Report - Straight to the GoalReading AWR or Statspack Report - Straight to the Goal
Reading AWR or Statspack Report - Straight to the Goal
Franck Pachot
 
Oracle Performance Tuning Fundamentals
Oracle Performance Tuning FundamentalsOracle Performance Tuning Fundamentals
Oracle Performance Tuning Fundamentals
Enkitec
 
Oracle Oracle Performance Tuning
Oracle Oracle Performance Tuning Oracle Oracle Performance Tuning
Oracle Oracle Performance Tuning
Kernel Training
 
Using AWR for SQL Analysis
Using AWR for SQL AnalysisUsing AWR for SQL Analysis
Using AWR for SQL Analysis
Texas Memory Systems, and IBM Company
 
AWR, ASH with EM13 at HotSos 2016
AWR, ASH with EM13 at HotSos 2016AWR, ASH with EM13 at HotSos 2016
AWR, ASH with EM13 at HotSos 2016
Kellyn Pot'Vin-Gorman
 
FlashSystems 2016 update
FlashSystems 2016 updateFlashSystems 2016 update
FlashSystems 2016 update
Joe Krotz
 
Oracle 11G SCAN: Concepts and Implementation Experience Sharing
Oracle 11G SCAN: Concepts and Implementation Experience SharingOracle 11G SCAN: Concepts and Implementation Experience Sharing
Oracle 11G SCAN: Concepts and Implementation Experience Sharing
Yury Velikanov
 
Oracle SQL tuning with SQL Plan Management
Oracle SQL tuning with SQL Plan ManagementOracle SQL tuning with SQL Plan Management
Oracle SQL tuning with SQL Plan Management
Bjoern Rost
 
3 ways to reduce Oracle license costs
3 ways to reduce Oracle license costs3 ways to reduce Oracle license costs
3 ways to reduce Oracle license costs
William Macleod
 
Awr1page - Sanity checking time instrumentation in AWR reports
Awr1page - Sanity checking time instrumentation in AWR reportsAwr1page - Sanity checking time instrumentation in AWR reports
Awr1page - Sanity checking time instrumentation in AWR reports
John Beresniewicz
 
Using SQL Plan Management (SPM) to balance Plan Flexibility and Plan Stability
Using SQL Plan Management (SPM) to balance Plan Flexibility and Plan StabilityUsing SQL Plan Management (SPM) to balance Plan Flexibility and Plan Stability
Using SQL Plan Management (SPM) to balance Plan Flexibility and Plan Stability
Carlos Sierra
 
My Experience Using Oracle SQL Plan Baselines 11g/12c
My Experience Using Oracle SQL Plan Baselines 11g/12cMy Experience Using Oracle SQL Plan Baselines 11g/12c
My Experience Using Oracle SQL Plan Baselines 11g/12c
Nelson Calero
 
How a Developer can Troubleshoot a SQL performing poorly on a Production DB
How a Developer can Troubleshoot a SQL performing poorly on a Production DBHow a Developer can Troubleshoot a SQL performing poorly on a Production DB
How a Developer can Troubleshoot a SQL performing poorly on a Production DB
Carlos Sierra
 
Benchmarking Oracle I/O Performance with Orion by Alex Gorbachev
Benchmarking Oracle I/O Performance with Orion by Alex GorbachevBenchmarking Oracle I/O Performance with Orion by Alex Gorbachev
Benchmarking Oracle I/O Performance with Orion by Alex Gorbachev
Alex Gorbachev
 
Oracle AWR Data mining
Oracle AWR Data miningOracle AWR Data mining
Oracle AWR Data mining
Yury Velikanov
 
Oracle SQL Performance Tuning and Optimization v26 chapter 1
Oracle SQL Performance Tuning and Optimization v26 chapter 1Oracle SQL Performance Tuning and Optimization v26 chapter 1
Oracle SQL Performance Tuning and Optimization v26 chapter 1
Kevin Meade
 
Oracle sql tuning
Oracle sql tuningOracle sql tuning
Oracle sql tuning
bishnupriya Panda
 
Lecture 5 1_mass_and_density
Lecture 5 1_mass_and_densityLecture 5 1_mass_and_density
Lecture 5 1_mass_and_density
Khairul Azhar
 
Lecture 8 2_magnetic_force
Lecture 8 2_magnetic_forceLecture 8 2_magnetic_force
Lecture 8 2_magnetic_force
Khairul Azhar
 
Performance Tuning With Oracle ASH and AWR. Part 1 How And What
Performance Tuning With Oracle ASH and AWR. Part 1 How And WhatPerformance Tuning With Oracle ASH and AWR. Part 1 How And What
Performance Tuning With Oracle ASH and AWR. Part 1 How And What
udaymoogala
 
Reading AWR or Statspack Report - Straight to the Goal
Reading AWR or Statspack Report - Straight to the GoalReading AWR or Statspack Report - Straight to the Goal
Reading AWR or Statspack Report - Straight to the Goal
Franck Pachot
 
Oracle Performance Tuning Fundamentals
Oracle Performance Tuning FundamentalsOracle Performance Tuning Fundamentals
Oracle Performance Tuning Fundamentals
Enkitec
 
Oracle Oracle Performance Tuning
Oracle Oracle Performance Tuning Oracle Oracle Performance Tuning
Oracle Oracle Performance Tuning
Kernel Training
 
FlashSystems 2016 update
FlashSystems 2016 updateFlashSystems 2016 update
FlashSystems 2016 update
Joe Krotz
 
Oracle 11G SCAN: Concepts and Implementation Experience Sharing
Oracle 11G SCAN: Concepts and Implementation Experience SharingOracle 11G SCAN: Concepts and Implementation Experience Sharing
Oracle 11G SCAN: Concepts and Implementation Experience Sharing
Yury Velikanov
 
Oracle SQL tuning with SQL Plan Management
Oracle SQL tuning with SQL Plan ManagementOracle SQL tuning with SQL Plan Management
Oracle SQL tuning with SQL Plan Management
Bjoern Rost
 
3 ways to reduce Oracle license costs
3 ways to reduce Oracle license costs3 ways to reduce Oracle license costs
3 ways to reduce Oracle license costs
William Macleod
 
Awr1page - Sanity checking time instrumentation in AWR reports
Awr1page - Sanity checking time instrumentation in AWR reportsAwr1page - Sanity checking time instrumentation in AWR reports
Awr1page - Sanity checking time instrumentation in AWR reports
John Beresniewicz
 
Using SQL Plan Management (SPM) to balance Plan Flexibility and Plan Stability
Using SQL Plan Management (SPM) to balance Plan Flexibility and Plan StabilityUsing SQL Plan Management (SPM) to balance Plan Flexibility and Plan Stability
Using SQL Plan Management (SPM) to balance Plan Flexibility and Plan Stability
Carlos Sierra
 
My Experience Using Oracle SQL Plan Baselines 11g/12c
My Experience Using Oracle SQL Plan Baselines 11g/12cMy Experience Using Oracle SQL Plan Baselines 11g/12c
My Experience Using Oracle SQL Plan Baselines 11g/12c
Nelson Calero
 
How a Developer can Troubleshoot a SQL performing poorly on a Production DB
How a Developer can Troubleshoot a SQL performing poorly on a Production DBHow a Developer can Troubleshoot a SQL performing poorly on a Production DB
How a Developer can Troubleshoot a SQL performing poorly on a Production DB
Carlos Sierra
 
Benchmarking Oracle I/O Performance with Orion by Alex Gorbachev
Benchmarking Oracle I/O Performance with Orion by Alex GorbachevBenchmarking Oracle I/O Performance with Orion by Alex Gorbachev
Benchmarking Oracle I/O Performance with Orion by Alex Gorbachev
Alex Gorbachev
 
Oracle AWR Data mining
Oracle AWR Data miningOracle AWR Data mining
Oracle AWR Data mining
Yury Velikanov
 
Oracle SQL Performance Tuning and Optimization v26 chapter 1
Oracle SQL Performance Tuning and Optimization v26 chapter 1Oracle SQL Performance Tuning and Optimization v26 chapter 1
Oracle SQL Performance Tuning and Optimization v26 chapter 1
Kevin Meade
 
Lecture 5 1_mass_and_density
Lecture 5 1_mass_and_densityLecture 5 1_mass_and_density
Lecture 5 1_mass_and_density
Khairul Azhar
 
Lecture 8 2_magnetic_force
Lecture 8 2_magnetic_forceLecture 8 2_magnetic_force
Lecture 8 2_magnetic_force
Khairul Azhar
 
Ad

Similar to Using AWR/Statspack for Wait Analysis (20)

Using Statspack and AWR for Memory Monitoring and Tuning
Using Statspack and AWR for Memory Monitoring and TuningUsing Statspack and AWR for Memory Monitoring and Tuning
Using Statspack and AWR for Memory Monitoring and Tuning
Texas Memory Systems, and IBM Company
 
Awrrpt 1 3004_3005
Awrrpt 1 3004_3005Awrrpt 1 3004_3005
Awrrpt 1 3004_3005
Kam Chan
 
Using AWR for IO Subsystem Analysis
Using AWR for IO Subsystem AnalysisUsing AWR for IO Subsystem Analysis
Using AWR for IO Subsystem Analysis
Texas Memory Systems, and IBM Company
 
Thomas+Niewel+ +Oracletuning
Thomas+Niewel+ +OracletuningThomas+Niewel+ +Oracletuning
Thomas+Niewel+ +Oracletuning
afa reg
 
AWR Ambiguity: Performance reasoning when the numbers don't add up
AWR Ambiguity: Performance reasoning when the numbers don't add upAWR Ambiguity: Performance reasoning when the numbers don't add up
AWR Ambiguity: Performance reasoning when the numbers don't add up
John Beresniewicz
 
Troubleshooting Complex Oracle Performance Problems with Tanel Poder
Troubleshooting Complex Oracle Performance Problems with Tanel PoderTroubleshooting Complex Oracle Performance Problems with Tanel Poder
Troubleshooting Complex Oracle Performance Problems with Tanel Poder
Tanel Poder
 
AWR, ADDM, ASH, Metrics and Advisors.ppt
AWR, ADDM, ASH, Metrics and Advisors.pptAWR, ADDM, ASH, Metrics and Advisors.ppt
AWR, ADDM, ASH, Metrics and Advisors.ppt
bugzbinny
 
Oracle Open World Thursday 230 ashmasters
Oracle Open World Thursday 230 ashmastersOracle Open World Thursday 230 ashmasters
Oracle Open World Thursday 230 ashmasters
Kyle Hailey
 
EMC Dteata domain advanced command troubleshoot
EMC Dteata domain advanced command troubleshootEMC Dteata domain advanced command troubleshoot
EMC Dteata domain advanced command troubleshoot
solarisyougood
 
Oow2007 performance
Oow2007 performanceOow2007 performance
Oow2007 performance
Ricky Zhu
 
Oracle 10g Performance: chapter 00 statspack
Oracle 10g Performance: chapter 00 statspackOracle 10g Performance: chapter 00 statspack
Oracle 10g Performance: chapter 00 statspack
Kyle Hailey
 
Ash masters : advanced ash analytics on Oracle
Ash masters : advanced ash analytics on Oracle Ash masters : advanced ash analytics on Oracle
Ash masters : advanced ash analytics on Oracle
Kyle Hailey
 
Troubleshooting Complex Performance issues - Oracle SEG$ contention
Troubleshooting Complex Performance issues - Oracle SEG$ contentionTroubleshooting Complex Performance issues - Oracle SEG$ contention
Troubleshooting Complex Performance issues - Oracle SEG$ contention
Tanel Poder
 
RMAN – The Pocket Knife of a DBA
RMAN – The Pocket Knife of a DBA RMAN – The Pocket Knife of a DBA
RMAN – The Pocket Knife of a DBA
Guatemala User Group
 
Build an High-Performance and High-Durable Block Storage Service Based on Ceph
Build an High-Performance and High-Durable Block Storage Service Based on CephBuild an High-Performance and High-Durable Block Storage Service Based on Ceph
Build an High-Performance and High-Durable Block Storage Service Based on Ceph
Rongze Zhu
 
System Capa Planning_DBA oracle edu
System Capa Planning_DBA oracle eduSystem Capa Planning_DBA oracle edu
System Capa Planning_DBA oracle edu
엑셈
 
Rmoug ashmaster
Rmoug ashmasterRmoug ashmaster
Rmoug ashmaster
Kyle Hailey
 
SQLIO - measuring storage performance
SQLIO - measuring storage performanceSQLIO - measuring storage performance
SQLIO - measuring storage performance
valerian_ceaus
 
Rman duplicate-database-on-the-same-host1
Rman duplicate-database-on-the-same-host1Rman duplicate-database-on-the-same-host1
Rman duplicate-database-on-the-same-host1
hunghtc83
 
les_02.ppt of the Oracle course train_2 file
les_02.ppt of the Oracle course train_2 fileles_02.ppt of the Oracle course train_2 file
les_02.ppt of the Oracle course train_2 file
YulinLiu27
 
Awrrpt 1 3004_3005
Awrrpt 1 3004_3005Awrrpt 1 3004_3005
Awrrpt 1 3004_3005
Kam Chan
 
Thomas+Niewel+ +Oracletuning
Thomas+Niewel+ +OracletuningThomas+Niewel+ +Oracletuning
Thomas+Niewel+ +Oracletuning
afa reg
 
AWR Ambiguity: Performance reasoning when the numbers don't add up
AWR Ambiguity: Performance reasoning when the numbers don't add upAWR Ambiguity: Performance reasoning when the numbers don't add up
AWR Ambiguity: Performance reasoning when the numbers don't add up
John Beresniewicz
 
Troubleshooting Complex Oracle Performance Problems with Tanel Poder
Troubleshooting Complex Oracle Performance Problems with Tanel PoderTroubleshooting Complex Oracle Performance Problems with Tanel Poder
Troubleshooting Complex Oracle Performance Problems with Tanel Poder
Tanel Poder
 
AWR, ADDM, ASH, Metrics and Advisors.ppt
AWR, ADDM, ASH, Metrics and Advisors.pptAWR, ADDM, ASH, Metrics and Advisors.ppt
AWR, ADDM, ASH, Metrics and Advisors.ppt
bugzbinny
 
Oracle Open World Thursday 230 ashmasters
Oracle Open World Thursday 230 ashmastersOracle Open World Thursday 230 ashmasters
Oracle Open World Thursday 230 ashmasters
Kyle Hailey
 
EMC Dteata domain advanced command troubleshoot
EMC Dteata domain advanced command troubleshootEMC Dteata domain advanced command troubleshoot
EMC Dteata domain advanced command troubleshoot
solarisyougood
 
Oow2007 performance
Oow2007 performanceOow2007 performance
Oow2007 performance
Ricky Zhu
 
Oracle 10g Performance: chapter 00 statspack
Oracle 10g Performance: chapter 00 statspackOracle 10g Performance: chapter 00 statspack
Oracle 10g Performance: chapter 00 statspack
Kyle Hailey
 
Ash masters : advanced ash analytics on Oracle
Ash masters : advanced ash analytics on Oracle Ash masters : advanced ash analytics on Oracle
Ash masters : advanced ash analytics on Oracle
Kyle Hailey
 
Troubleshooting Complex Performance issues - Oracle SEG$ contention
Troubleshooting Complex Performance issues - Oracle SEG$ contentionTroubleshooting Complex Performance issues - Oracle SEG$ contention
Troubleshooting Complex Performance issues - Oracle SEG$ contention
Tanel Poder
 
Build an High-Performance and High-Durable Block Storage Service Based on Ceph
Build an High-Performance and High-Durable Block Storage Service Based on CephBuild an High-Performance and High-Durable Block Storage Service Based on Ceph
Build an High-Performance and High-Durable Block Storage Service Based on Ceph
Rongze Zhu
 
System Capa Planning_DBA oracle edu
System Capa Planning_DBA oracle eduSystem Capa Planning_DBA oracle edu
System Capa Planning_DBA oracle edu
엑셈
 
SQLIO - measuring storage performance
SQLIO - measuring storage performanceSQLIO - measuring storage performance
SQLIO - measuring storage performance
valerian_ceaus
 
Rman duplicate-database-on-the-same-host1
Rman duplicate-database-on-the-same-host1Rman duplicate-database-on-the-same-host1
Rman duplicate-database-on-the-same-host1
hunghtc83
 
les_02.ppt of the Oracle course train_2 file
les_02.ppt of the Oracle course train_2 fileles_02.ppt of the Oracle course train_2 file
les_02.ppt of the Oracle course train_2 file
YulinLiu27
 
Ad

Recently uploaded (20)

ThousandEyes Partner Innovation Updates for May 2025
ThousandEyes Partner Innovation Updates for May 2025ThousandEyes Partner Innovation Updates for May 2025
ThousandEyes Partner Innovation Updates for May 2025
ThousandEyes
 
TrustArc Webinar: Consumer Expectations vs Corporate Realities on Data Broker...
TrustArc Webinar: Consumer Expectations vs Corporate Realities on Data Broker...TrustArc Webinar: Consumer Expectations vs Corporate Realities on Data Broker...
TrustArc Webinar: Consumer Expectations vs Corporate Realities on Data Broker...
TrustArc
 
Into The Box Conference Keynote Day 1 (ITB2025)
Into The Box Conference Keynote Day 1 (ITB2025)Into The Box Conference Keynote Day 1 (ITB2025)
Into The Box Conference Keynote Day 1 (ITB2025)
Ortus Solutions, Corp
 
tecnologias de las primeras civilizaciones.pdf
tecnologias de las primeras civilizaciones.pdftecnologias de las primeras civilizaciones.pdf
tecnologias de las primeras civilizaciones.pdf
fjgm517
 
Increasing Retail Store Efficiency How can Planograms Save Time and Money.pptx
Increasing Retail Store Efficiency How can Planograms Save Time and Money.pptxIncreasing Retail Store Efficiency How can Planograms Save Time and Money.pptx
Increasing Retail Store Efficiency How can Planograms Save Time and Money.pptx
Anoop Ashok
 
Dev Dives: Automate and orchestrate your processes with UiPath Maestro
Dev Dives: Automate and orchestrate your processes with UiPath MaestroDev Dives: Automate and orchestrate your processes with UiPath Maestro
Dev Dives: Automate and orchestrate your processes with UiPath Maestro
UiPathCommunity
 
Complete Guide to Advanced Logistics Management Software in Riyadh.pdf
Complete Guide to Advanced Logistics Management Software in Riyadh.pdfComplete Guide to Advanced Logistics Management Software in Riyadh.pdf
Complete Guide to Advanced Logistics Management Software in Riyadh.pdf
Software Company
 
How Can I use the AI Hype in my Business Context?
How Can I use the AI Hype in my Business Context?How Can I use the AI Hype in my Business Context?
How Can I use the AI Hype in my Business Context?
Daniel Lehner
 
Role of Data Annotation Services in AI-Powered Manufacturing
Role of Data Annotation Services in AI-Powered ManufacturingRole of Data Annotation Services in AI-Powered Manufacturing
Role of Data Annotation Services in AI-Powered Manufacturing
Andrew Leo
 
How analogue intelligence complements AI
How analogue intelligence complements AIHow analogue intelligence complements AI
How analogue intelligence complements AI
Paul Rowe
 
Build Your Own Copilot & Agents For Devs
Build Your Own Copilot & Agents For DevsBuild Your Own Copilot & Agents For Devs
Build Your Own Copilot & Agents For Devs
Brian McKeiver
 
Heap, Types of Heap, Insertion and Deletion
Heap, Types of Heap, Insertion and DeletionHeap, Types of Heap, Insertion and Deletion
Heap, Types of Heap, Insertion and Deletion
Jaydeep Kale
 
Designing Low-Latency Systems with Rust and ScyllaDB: An Architectural Deep Dive
Designing Low-Latency Systems with Rust and ScyllaDB: An Architectural Deep DiveDesigning Low-Latency Systems with Rust and ScyllaDB: An Architectural Deep Dive
Designing Low-Latency Systems with Rust and ScyllaDB: An Architectural Deep Dive
ScyllaDB
 
AI and Data Privacy in 2025: Global Trends
AI and Data Privacy in 2025: Global TrendsAI and Data Privacy in 2025: Global Trends
AI and Data Privacy in 2025: Global Trends
InData Labs
 
Procurement Insights Cost To Value Guide.pptx
Procurement Insights Cost To Value Guide.pptxProcurement Insights Cost To Value Guide.pptx
Procurement Insights Cost To Value Guide.pptx
Jon Hansen
 
Andrew Marnell: Transforming Business Strategy Through Data-Driven Insights
Andrew Marnell: Transforming Business Strategy Through Data-Driven InsightsAndrew Marnell: Transforming Business Strategy Through Data-Driven Insights
Andrew Marnell: Transforming Business Strategy Through Data-Driven Insights
Andrew Marnell
 
Special Meetup Edition - TDX Bengaluru Meetup #52.pptx
Special Meetup Edition - TDX Bengaluru Meetup #52.pptxSpecial Meetup Edition - TDX Bengaluru Meetup #52.pptx
Special Meetup Edition - TDX Bengaluru Meetup #52.pptx
shyamraj55
 
IEDM 2024 Tutorial2_Advances in CMOS Technologies and Future Directions for C...
IEDM 2024 Tutorial2_Advances in CMOS Technologies and Future Directions for C...IEDM 2024 Tutorial2_Advances in CMOS Technologies and Future Directions for C...
IEDM 2024 Tutorial2_Advances in CMOS Technologies and Future Directions for C...
organizerofv
 
UiPath Community Berlin: Orchestrator API, Swagger, and Test Manager API
UiPath Community Berlin: Orchestrator API, Swagger, and Test Manager APIUiPath Community Berlin: Orchestrator API, Swagger, and Test Manager API
UiPath Community Berlin: Orchestrator API, Swagger, and Test Manager API
UiPathCommunity
 
HCL Nomad Web – Best Practices and Managing Multiuser Environments
HCL Nomad Web – Best Practices and Managing Multiuser EnvironmentsHCL Nomad Web – Best Practices and Managing Multiuser Environments
HCL Nomad Web – Best Practices and Managing Multiuser Environments
panagenda
 
ThousandEyes Partner Innovation Updates for May 2025
ThousandEyes Partner Innovation Updates for May 2025ThousandEyes Partner Innovation Updates for May 2025
ThousandEyes Partner Innovation Updates for May 2025
ThousandEyes
 
TrustArc Webinar: Consumer Expectations vs Corporate Realities on Data Broker...
TrustArc Webinar: Consumer Expectations vs Corporate Realities on Data Broker...TrustArc Webinar: Consumer Expectations vs Corporate Realities on Data Broker...
TrustArc Webinar: Consumer Expectations vs Corporate Realities on Data Broker...
TrustArc
 
Into The Box Conference Keynote Day 1 (ITB2025)
Into The Box Conference Keynote Day 1 (ITB2025)Into The Box Conference Keynote Day 1 (ITB2025)
Into The Box Conference Keynote Day 1 (ITB2025)
Ortus Solutions, Corp
 
tecnologias de las primeras civilizaciones.pdf
tecnologias de las primeras civilizaciones.pdftecnologias de las primeras civilizaciones.pdf
tecnologias de las primeras civilizaciones.pdf
fjgm517
 
Increasing Retail Store Efficiency How can Planograms Save Time and Money.pptx
Increasing Retail Store Efficiency How can Planograms Save Time and Money.pptxIncreasing Retail Store Efficiency How can Planograms Save Time and Money.pptx
Increasing Retail Store Efficiency How can Planograms Save Time and Money.pptx
Anoop Ashok
 
Dev Dives: Automate and orchestrate your processes with UiPath Maestro
Dev Dives: Automate and orchestrate your processes with UiPath MaestroDev Dives: Automate and orchestrate your processes with UiPath Maestro
Dev Dives: Automate and orchestrate your processes with UiPath Maestro
UiPathCommunity
 
Complete Guide to Advanced Logistics Management Software in Riyadh.pdf
Complete Guide to Advanced Logistics Management Software in Riyadh.pdfComplete Guide to Advanced Logistics Management Software in Riyadh.pdf
Complete Guide to Advanced Logistics Management Software in Riyadh.pdf
Software Company
 
How Can I use the AI Hype in my Business Context?
How Can I use the AI Hype in my Business Context?How Can I use the AI Hype in my Business Context?
How Can I use the AI Hype in my Business Context?
Daniel Lehner
 
Role of Data Annotation Services in AI-Powered Manufacturing
Role of Data Annotation Services in AI-Powered ManufacturingRole of Data Annotation Services in AI-Powered Manufacturing
Role of Data Annotation Services in AI-Powered Manufacturing
Andrew Leo
 
How analogue intelligence complements AI
How analogue intelligence complements AIHow analogue intelligence complements AI
How analogue intelligence complements AI
Paul Rowe
 
Build Your Own Copilot & Agents For Devs
Build Your Own Copilot & Agents For DevsBuild Your Own Copilot & Agents For Devs
Build Your Own Copilot & Agents For Devs
Brian McKeiver
 
Heap, Types of Heap, Insertion and Deletion
Heap, Types of Heap, Insertion and DeletionHeap, Types of Heap, Insertion and Deletion
Heap, Types of Heap, Insertion and Deletion
Jaydeep Kale
 
Designing Low-Latency Systems with Rust and ScyllaDB: An Architectural Deep Dive
Designing Low-Latency Systems with Rust and ScyllaDB: An Architectural Deep DiveDesigning Low-Latency Systems with Rust and ScyllaDB: An Architectural Deep Dive
Designing Low-Latency Systems with Rust and ScyllaDB: An Architectural Deep Dive
ScyllaDB
 
AI and Data Privacy in 2025: Global Trends
AI and Data Privacy in 2025: Global TrendsAI and Data Privacy in 2025: Global Trends
AI and Data Privacy in 2025: Global Trends
InData Labs
 
Procurement Insights Cost To Value Guide.pptx
Procurement Insights Cost To Value Guide.pptxProcurement Insights Cost To Value Guide.pptx
Procurement Insights Cost To Value Guide.pptx
Jon Hansen
 
Andrew Marnell: Transforming Business Strategy Through Data-Driven Insights
Andrew Marnell: Transforming Business Strategy Through Data-Driven InsightsAndrew Marnell: Transforming Business Strategy Through Data-Driven Insights
Andrew Marnell: Transforming Business Strategy Through Data-Driven Insights
Andrew Marnell
 
Special Meetup Edition - TDX Bengaluru Meetup #52.pptx
Special Meetup Edition - TDX Bengaluru Meetup #52.pptxSpecial Meetup Edition - TDX Bengaluru Meetup #52.pptx
Special Meetup Edition - TDX Bengaluru Meetup #52.pptx
shyamraj55
 
IEDM 2024 Tutorial2_Advances in CMOS Technologies and Future Directions for C...
IEDM 2024 Tutorial2_Advances in CMOS Technologies and Future Directions for C...IEDM 2024 Tutorial2_Advances in CMOS Technologies and Future Directions for C...
IEDM 2024 Tutorial2_Advances in CMOS Technologies and Future Directions for C...
organizerofv
 
UiPath Community Berlin: Orchestrator API, Swagger, and Test Manager API
UiPath Community Berlin: Orchestrator API, Swagger, and Test Manager APIUiPath Community Berlin: Orchestrator API, Swagger, and Test Manager API
UiPath Community Berlin: Orchestrator API, Swagger, and Test Manager API
UiPathCommunity
 
HCL Nomad Web – Best Practices and Managing Multiuser Environments
HCL Nomad Web – Best Practices and Managing Multiuser EnvironmentsHCL Nomad Web – Best Practices and Managing Multiuser Environments
HCL Nomad Web – Best Practices and Managing Multiuser Environments
panagenda
 

Using AWR/Statspack for Wait Analysis

  • 1. Using AWR For Wait AnalysisMike Ault, Oracle GuruMarch 2011The World’s Fastest Storage® for over thirty years!
  • 2. Michael R. Ault, Oracle Guru Nuclear Navy 6 years
  • 4. Kennedy Western University Graduate
  • 5. Bachelors Degree Computer Science
  • 6. Certified in all Oracle Versions Since 6
  • 7. Oracle DBA, author, since 1990Books by Michael R. Ault
  • 8. StatspackAnalyzer.comFree Statspack/AWR Analysis Sponsored by Texas Memory SystemsLooks for IO bottlenecks and other configuration issues.
  • 9. Straightforward tuning adviceIntroductionStatspack was introduced in 8.1.7AWR came out in Oracle10gBoth are very similarBoth provide a top-down look at performance statistics
  • 10. What Is AWR?A background processA set of tablesA set of reportsTakes snapshots of statistics every hourTakes snapshot of high-cost SQL every hour
  • 11. Preparation for AnalysisKnow your systems normal performance fingerprintBe familiar with Concepts and Tuning GuidesHave “normal” AWR/Statspacks for comparison
  • 12. Top-Down ApproachReport starts with settings overviewNext provides Top-5 waitsUse the Waits to guide further investigation
  • 13. AWR Report HeaderWORKLOAD REPOSITORY report forDB Name DB Id Instance Inst Num Startup Time Release RAC------------ ----------- ------------ -------- --------------- ----------- ---AULTDB 4030696936 aultdb1 1 04-Aug-08 10:16 11.1.0.6.0 YESHost Name Platform CPUs Cores Sockets Memory(GB)---------------- -------------------------------- ---- ----- ------- ----------aultlinux3 Linux IA (32-bit) 2 1 1 2.97 Snap Id Snap Time Sessions Curs/Sess--------- ------------------- -------- ---------Begin Snap: 91 04-Aug-08 12:00:15 41 1.2 End Snap: 92 04-Aug-08 13:00:28 47 1.1Elapsed: 60.22 (mins) DB Time: 139.52 (mins)Cache Sizes Begin End~~~~~~~~~~~ ---------- ---------- Buffer Cache: 1,312M 1,312M Std Block Size: 8K Shared Pool Size: 224M 224M Log Buffer: 10,604K
  • 14. AWR Report HeaderWORKLOAD REPOSITORY report forDB Name DB Id Instance Inst Num Startup Time Release RAC------------ ----------- ------------ -------- --------------- ----------- ---AULTDB 4030696936 aultdb1 1 04-Aug-08 10:16 11.1.0.6.0 YESHost Name Platform CPUs Cores Sockets Memory(GB)---------------- -------------------------------- ---- ----- ------- ----------aultlinux3 Linux IA (32-bit) 2 1 1 2.97 Snap Id Snap Time Sessions Curs/Sess--------- ------------------- -------- ---------Begin Snap: 91 04-Aug-08 12:00:15 41 1.2 End Snap: 92 04-Aug-08 13:00:28 47 1.1Elapsed: 60.22 (mins) DB Time: 139.52 (mins)Cache Sizes Begin End~~~~~~~~~~~ ---------- ---------- Buffer Cache: 1,312M 1,312M Std Block Size: 8K Shared Pool Size: 224M 224M Log Buffer: 10,604K
  • 15. AWR Report HeaderWORKLOAD REPOSITORY report forDB Name DB Id Instance Inst Num Startup Time Release RAC------------ ----------- ------------ -------- --------------- ----------- ---AULTDB 4030696936 aultdb1 1 04-Aug-08 10:16 11.1.0.6.0 YESHost Name Platform CPUs Cores Sockets Memory(GB)---------------- -------------------------------- ---- ----- ------- ----------aultlinux3 Linux IA (32-bit) 2 1 1 2.97 Snap Id Snap Time Sessions Curs/Sess--------- ------------------- -------- ---------Begin Snap: 91 04-Aug-08 12:00:15 41 1.2 End Snap: 92 04-Aug-08 13:00:28 47 1.1Elapsed: 60.22 (mins) DB Time: 139.52 (mins)Cache Sizes Begin End~~~~~~~~~~~ ---------- ---------- Buffer Cache: 1,312M 1,312M Std Block Size: 8K Shared Pool Size: 224M 224M Log Buffer: 10,604K
  • 16. AWR Report HeaderWORKLOAD REPOSITORY report forDB Name DB Id Instance Inst Num Startup Time Release RAC------------ ----------- ------------ -------- --------------- ----------- ---AULTDB 4030696936 aultdb1 1 04-Aug-08 10:16 11.1.0.6.0 YESHost Name Platform CPUs Cores Sockets Memory(GB)---------------- -------------------------------- ---- ----- ------- ----------aultlinux3 Linux IA (32-bit) 2 1 1 2.97 Snap Id Snap Time Sessions Curs/Sess--------- ------------------- -------- ---------Begin Snap: 91 04-Aug-08 12:00:15 41 1.2 End Snap: 92 04-Aug-08 13:00:28 47 1.1Elapsed: 60.22 (mins) DB Time: 139.52 (mins)Cache Sizes Begin End~~~~~~~~~~~ ---------- ---------- Buffer Cache: 1,312M 1,312M Std Block Size: 8K Shared Pool Size: 224M 224M Log Buffer: 10,604K
  • 17. AWR Report HeaderWORKLOAD REPOSITORY report forDB Name DB Id Instance Inst Num Startup Time Release RAC------------ ----------- ------------ -------- --------------- ----------- ---AULTDB 4030696936 aultdb1 1 04-Aug-08 10:16 11.1.0.6.0 YESHost Name Platform CPUs Cores Sockets Memory(GB)---------------- -------------------------------- ---- ----- ------- ----------aultlinux3 Linux IA (32-bit) 2 1 1 2.97 Snap Id Snap Time Sessions Curs/Sess--------- ------------------- -------- ---------Begin Snap: 91 04-Aug-08 12:00:15 41 1.2 End Snap: 92 04-Aug-08 13:00:28 47 1.1Elapsed: 60.22 (mins) DB Time: 139.52 (mins)Cache Sizes Begin End~~~~~~~~~~~ ---------- ---------- Buffer Cache: 1,312M 1,312M Std Block Size: 8K Shared Pool Size: 224M 224M Log Buffer: 10,604K
  • 18. AWR Report HeaderWORKLOAD REPOSITORY report forDB Name DB Id Instance Inst Num Startup Time Release RAC------------ ----------- ------------ -------- --------------- ----------- ---AULTDB 4030696936 aultdb1 1 04-Aug-08 10:16 11.1.0.6.0 YESHost Name Platform CPUs Cores Sockets Memory(GB)---------------- -------------------------------- ---- ----- ------- ----------aultlinux3 Linux IA (32-bit) 2 1 1 2.97 Snap Id Snap Time Sessions Curs/Sess--------- ------------------- -------- ---------Begin Snap: 91 04-Aug-08 12:00:15 41 1.2 End Snap: 92 04-Aug-08 13:00:28 47 1.1Elapsed: 60.22 (mins) DB Time: 139.52 (mins)Cache Sizes Begin End~~~~~~~~~~~ ---------- ---------- Buffer Cache: 1,312M 1,312M Std Block Size: 8K Shared Pool Size: 224M 224M Log Buffer: 10,604K
  • 19. AWR Report HeaderWORKLOAD REPOSITORY report forDB Name DB Id Instance Inst Num Startup Time Release RAC------------ ----------- ------------ -------- --------------- ----------- ---AULTDB 4030696936 aultdb1 1 04-Aug-08 10:16 11.1.0.6.0 YESHost Name Platform CPUs Cores Sockets Memory(GB)---------------- -------------------------------- ---- ----- ------- ----------aultlinux3 Linux IA (32-bit) 2 1 1 2.97 Snap Id Snap Time Sessions Curs/Sess--------- ------------------- -------- ---------Begin Snap: 91 04-Aug-08 12:00:15 41 1.2 End Snap: 92 04-Aug-08 13:00:28 47 1.1Elapsed: 60.22 (mins) DB Time: 139.52 (mins)Cache Sizes Begin End~~~~~~~~~~~ ---------- ---------- Buffer Cache: 1,312M 1,312M Std Block Size: 8K Shared Pool Size: 224M 224M Log Buffer: 10,604K
  • 20. AWR Report HeaderWORKLOAD REPOSITORY report forDB Name DB Id Instance Inst Num Startup Time Release RAC------------ ----------- ------------ -------- --------------- ----------- ---AULTDB 4030696936 aultdb1 1 04-Aug-08 10:16 11.1.0.6.0 YESHost Name Platform CPUs Cores Sockets Memory(GB)---------------- -------------------------------- ---- ----- ------- ----------aultlinux3 Linux IA (32-bit) 2 1 1 2.97 Snap Id Snap Time Sessions Curs/Sess--------- ------------------- -------- ---------Begin Snap: 91 04-Aug-08 12:00:15 41 1.2 End Snap: 92 04-Aug-08 13:00:28 47 1.1Elapsed: 60.22 (mins) DB Time: 139.52 (mins)Cache Sizes Begin End~~~~~~~~~~~ ---------- ---------- Buffer Cache: 1,312M 1,312M Std Block Size: 8K Shared Pool Size: 224M 224M Log Buffer: 10,604K
  • 21. AWR Report HeaderWORKLOAD REPOSITORY report forDB Name DB Id Instance Inst Num Startup Time Release RAC------------ ----------- ------------ -------- --------------- ----------- ---AULTDB 4030696936 aultdb1 1 04-Aug-08 10:16 11.1.0.6.0 YESHost Name Platform CPUs Cores Sockets Memory(GB)---------------- -------------------------------- ---- ----- ------- ----------aultlinux3 Linux IA (32-bit) 2 1 1 2.97 Snap Id Snap Time Sessions Curs/Sess--------- ------------------- -------- ---------Begin Snap: 91 04-Aug-08 12:00:15 41 1.2 End Snap: 92 04-Aug-08 13:00:28 47 1.1Elapsed: 60.22 (mins) DB Time: 139.52 (mins)Cache Sizes Begin End~~~~~~~~~~~ ---------- ---------- Buffer Cache: 1,312M 1,312M Std Block Size: 8K Shared Pool Size: 224M 224M Log Buffer: 10,604K
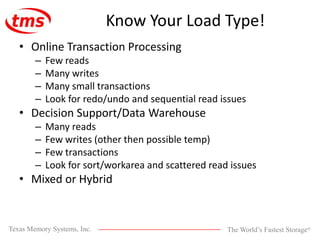
  • 22. Know Your Load Type!Online Transaction ProcessingFew readsMany writesMany small transactionsLook for redo/undo and sequential read issuesDecision Support/Data WarehouseMany readsFew writes (other then possible temp)Few transactionsLook for sort/workarea and scattered read issuesMixed or Hybrid
  • 23. Load Profile SectionLoad Profile Per Second Per Transaction Per Exec Per Call~~~~~~~~~~~~ --------------- --------------- ---------- ---------- DB Time(s): 2.3 7.1 0.63 1.05 DB CPU(s): 0.3 0.9 0.07 0.13 Redo size: 800.5 2,461.8 Logical reads: 6,307.6 19,396.7 Block changes: 3.6 10.9 Physical reads: 2,704.9 8,317.8 Physical writes: 86.9 267.3 User calls: 2.2 6.8 Parses: 2.0 6.1 Hard parses: 0.0 0.1W/A MB processed: 932,965.4 2,868,990.9 Logons: 0.1 0.2 Executes: 3.7 11.3 Rollbacks: 0.1 0.3 Transactions: 0.3
  • 24. Load Profile SectionLoad Profile Per Second Per Transaction Per Exec Per Call~~~~~~~~~~~~ --------------- --------------- ---------- ---------- DB Time(s): 2.3 7.1 0.63 1.05 DB CPU(s): 0.3 0.9 0.07 0.13 Redo size: 800.5 2,461.8 Logical reads: 6,307.6 19,396.7 Block changes: 3.6 10.9 Physical reads: 2,704.9 8,317.8 Physical writes: 86.9 267.3 User calls: 2.2 6.8 Parses: 2.0 6.1 Hard parses: 0.0 0.1W/A MB processed: 932,965.4 2,868,990.9 Logons: 0.1 0.2 Executes: 3.7 11.3 Rollbacks: 0.1 0.3 Transactions: 0.3
  • 25. Load Profile SectionLoad Profile Per Second Per Transaction Per Exec Per Call~~~~~~~~~~~~ --------------- --------------- ---------- ---------- DB Time(s): 2.3 7.1 0.63 1.05 DB CPU(s): 0.3 0.9 0.07 0.13 Redo size: 800.5 2,461.8 Logical reads: 6,307.6 19,396.7 Block changes: 3.6 10.9 Physical reads: 2,704.9 8,317.8 Physical writes: 86.9 267.3 User calls: 2.2 6.8 Parses: 2.0 6.1 Hard parses: 0.0 0.1W/A MB processed: 932,965.4 2,868,990.9 Logons: 0.1 0.2 Executes: 3.7 11.3 Rollbacks: 0.1 0.3 Transactions: 0.3
  • 26. Load Profile SectionLoad Profile Per Second Per Transaction Per Exec Per Call~~~~~~~~~~~~ --------------- --------------- ---------- ---------- DB Time(s): 2.3 7.1 0.63 1.05 DB CPU(s): 0.3 0.9 0.07 0.13 Redo size: 800.5 2,461.8 Logical reads: 6,307.6 19,396.7 Block changes: 3.6 10.9 Physical reads: 2,704.9 8,317.8 Physical writes: 86.9 267.3 User calls: 2.2 6.8 Parses: 2.0 6.1 Hard parses: 0.0 0.1W/A MB processed: 932,965.4 2,868,990.9 Logons: 0.1 0.2 Executes: 3.7 11.3 Rollbacks: 0.1 0.3 Transactions: 0.3
  • 27. Load Profile SectionLoad Profile Per Second Per Transaction Per Exec Per Call~~~~~~~~~~~~ --------------- --------------- ---------- ---------- DB Time(s): 2.3 7.1 0.63 1.05 DB CPU(s): 0.3 0.9 0.07 0.13 Redo size: 800.5 2,461.8 Logical reads: 6,307.6 19,396.7 Block changes: 3.6 10.9 Physical reads: 2,704.9 8,317.8 Physical writes: 86.9 267.3 User calls: 2.2 6.8 Parses: 2.0 6.1 Hard parses: 0.0 0.1W/A MB processed: 932,965.4 2,868,990.9 Logons: 0.1 0.2 Executes: 3.7 11.3 Rollbacks: 0.1 0.3 Transactions: 0.3
  • 28. Load Profile SectionLoad Profile Per Second Per Transaction Per Exec Per Call~~~~~~~~~~~~ --------------- --------------- ---------- ---------- DB Time(s): 2.3 7.1 0.63 1.05 DB CPU(s): 0.3 0.9 0.07 0.13 Redo size: 800.5 2,461.8 Logical reads: 6,307.6 19,396.7 Block changes: 3.6 10.9 Physical reads: 2,704.9 8,317.8 Physical writes: 86.9 267.3 User calls: 2.2 6.8 Parses: 2.0 6.1 Hard parses: 0.0 0.1W/A MB processed: 932,965.4 2,868,990.9 Logons: 0.1 0.2 Executes: 3.7 11.3 Rollbacks: 0.1 0.3 Transactions: 0.3
  • 29. Load Profile SectionLoad Profile Per Second Per Transaction Per Exec Per Call~~~~~~~~~~~~ --------------- --------------- ---------- ---------- DB Time(s): 2.3 7.1 0.63 1.05 DB CPU(s): 0.3 0.9 0.07 0.13 Redo size: 800.5 2,461.8 Logical reads: 6,307.6 19,396.7 Block changes: 3.6 10.9 Physical reads: 2,704.9 8,317.8 Physical writes: 86.9 267.3 User calls: 2.2 6.8 Parses: 2.0 6.1 Hard parses: 0.0 0.1W/A MB processed: 932,965.4 2,868,990.9 Logons: 0.1 0.2 Executes: 3.7 11.3 Rollbacks: 0.1 0.3 Transactions: 0.3
  • 30. Load Profile SectionLoad Profile Per Second Per Transaction Per Exec Per Call~~~~~~~~~~~~ --------------- --------------- ---------- ---------- DB Time(s): 2.3 7.1 0.63 1.05 DB CPU(s): 0.3 0.9 0.07 0.13 Redo size: 800.5 2,461.8 Logical reads: 6,307.6 19,396.7 Block changes: 3.6 10.9 Physical reads: 2,704.9 8,317.8 Physical writes: 86.9 267.3 User calls: 2.2 6.8 Parses: 2.0 6.1 Hard parses: 0.0 0.1W/A MB processed: 932,965.4 2,868,990.9 Logons: 0.1 0.2 Executes: 3.7 11.3 Rollbacks: 0.1 0.3 Transactions: 0.3
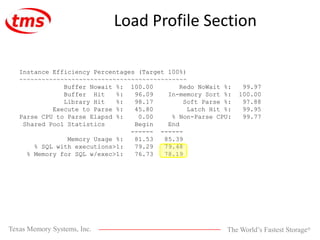
  • 31. What Are Your EfficienciesShould be close to 100%Parse issues usually are a result of:Bad bind variable usageInsufficient memoryWill also be co-indicated by low percentage of memory for multiple SQL execution
  • 32. Load Profile SectionInstance Efficiency Percentages (Target 100%)~~~~~~~~~~~~~~~~~~~~~~~~~~~~~~~~~~~~~~~~~~~~~ Buffer Nowait %: 100.00 Redo NoWait %: 99.97 Buffer Hit %: 96.09 In-memory Sort %: 100.00 Library Hit %: 98.17 Soft Parse %: 97.88 Execute to Parse %: 45.80 Latch Hit %: 99.95Parse CPU to ParseElapsd %: 0.00 % Non-Parse CPU: 99.77Shared Pool Statistics Begin End ------ ------ Memory Usage %: 81.53 85.39 % SQL with executions>1: 79.29 79.48 % Memory for SQL w/exec>1: 76.73 78.19
  • 33. Load Profile SectionInstance Efficiency Percentages (Target 100%)~~~~~~~~~~~~~~~~~~~~~~~~~~~~~~~~~~~~~~~~~~~~~ Buffer Nowait %: 100.00 Redo NoWait %: 99.97 Buffer Hit %: 96.09 In-memory Sort %: 100.00 Library Hit %: 98.17 Soft Parse %: 97.88 Execute to Parse %: 45.80 Latch Hit %: 99.95Parse CPU to ParseElapsd %: 0.00 % Non-Parse CPU: 99.77Shared Pool Statistics Begin End ------ ------ Memory Usage %: 81.53 85.39 % SQL with executions>1: 79.29 79.48 % Memory for SQL w/exec>1: 76.73 78.19
  • 34. Load Profile SectionInstance Efficiency Percentages (Target 100%)~~~~~~~~~~~~~~~~~~~~~~~~~~~~~~~~~~~~~~~~~~~~~ Buffer Nowait %: 100.00 Redo NoWait %: 99.97 Buffer Hit %: 96.09 In-memory Sort %: 100.00 Library Hit %: 98.17 Soft Parse %: 97.88 Execute to Parse %: 45.80 Latch Hit %: 99.95Parse CPU to ParseElapsd %: 0.00 % Non-Parse CPU: 99.77Shared Pool Statistics Begin End ------ ------ Memory Usage %: 81.53 85.39 % SQL with executions>1: 79.29 79.48 % Memory for SQL w/exec>1: 76.73 78.19
  • 35. Load Profile SectionInstance Efficiency Percentages (Target 100%)~~~~~~~~~~~~~~~~~~~~~~~~~~~~~~~~~~~~~~~~~~~~~ Buffer Nowait %: 100.00 Redo NoWait %: 99.97 Buffer Hit %: 96.09 In-memory Sort %: 100.00 Library Hit %: 98.17 Soft Parse %: 97.88 Execute to Parse %: 45.80 Latch Hit %: 99.95Parse CPU to ParseElapsd %: 0.00 % Non-Parse CPU: 99.77Shared Pool Statistics Begin End ------ ------ Memory Usage %: 81.53 85.39 % SQL with executions>1: 79.29 79.48 % Memory for SQL w/exec>1: 76.73 78.19
  • 36. Load Profile SectionInstance Efficiency Percentages (Target 100%)~~~~~~~~~~~~~~~~~~~~~~~~~~~~~~~~~~~~~~~~~~~~~ Buffer Nowait %: 100.00 Redo NoWait %: 99.97 Buffer Hit %: 96.09 In-memory Sort %: 100.00 Library Hit %: 98.17 Soft Parse %: 97.88 Execute to Parse %: 45.80 Latch Hit %: 99.95Parse CPU to ParseElapsd %: 0.00 % Non-Parse CPU: 99.77Shared Pool Statistics Begin End ------ ------ Memory Usage %: 81.53 85.39 % SQL with executions>1: 79.29 79.48 % Memory for SQL w/exec>1: 76.73 78.19
  • 37. Load Profile SectionInstance Efficiency Percentages (Target 100%)~~~~~~~~~~~~~~~~~~~~~~~~~~~~~~~~~~~~~~~~~~~~~ Buffer Nowait %: 100.00 Redo NoWait %: 99.97 Buffer Hit %: 96.09 In-memory Sort %: 100.00 Library Hit %: 98.17 Soft Parse %: 97.88 Execute to Parse %: 45.80 Latch Hit %: 99.95Parse CPU to ParseElapsd %: 0.00 % Non-Parse CPU: 99.77Shared Pool Statistics Begin End ------ ------ Memory Usage %: 81.53 85.39 % SQL with executions>1: 79.29 79.48 % Memory for SQL w/exec>1: 76.73 78.19
  • 38. Load Profile SectionInstance Efficiency Percentages (Target 100%)~~~~~~~~~~~~~~~~~~~~~~~~~~~~~~~~~~~~~~~~~~~~~ Buffer Nowait %: 100.00 Redo NoWait %: 99.97 Buffer Hit %: 96.09 In-memory Sort %: 100.00 Library Hit %: 98.17 Soft Parse %: 97.88 Execute to Parse %: 45.80 Latch Hit %: 99.95Parse CPU to ParseElapsd %: 0.00 % Non-Parse CPU: 99.77Shared Pool Statistics Begin End ------ ------ Memory Usage %: 81.53 85.39 % SQL with executions>1: 79.29 79.48 % Memory for SQL w/exec>1: 76.73 78.19
  • 39. Load Profile SectionInstance Efficiency Percentages (Target 100%)~~~~~~~~~~~~~~~~~~~~~~~~~~~~~~~~~~~~~~~~~~~~~ Buffer Nowait %: 100.00 Redo NoWait %: 99.97 Buffer Hit %: 96.09 In-memory Sort %: 100.00 Library Hit %: 98.17 Soft Parse %: 97.88 Execute to Parse %: 45.80 Latch Hit %: 99.95Parse CPU to ParseElapsd %: 0.00 % Non-Parse CPU: 99.77Shared Pool Statistics Begin End ------ ------ Memory Usage %: 81.53 85.39 % SQL with executions>1: 79.29 79.48 % Memory for SQL w/exec>1: 76.73 78.19
  • 40. Load Profile SectionInstance Efficiency Percentages (Target 100%)~~~~~~~~~~~~~~~~~~~~~~~~~~~~~~~~~~~~~~~~~~~~~ Buffer Nowait %: 100.00 Redo NoWait %: 99.97 Buffer Hit %: 96.09 In-memory Sort %: 100.00 Library Hit %: 98.17 Soft Parse %: 97.88 Execute to Parse %: 45.80 Latch Hit %: 99.95Parse CPU to ParseElapsd %: 0.00 % Non-Parse CPU: 99.77Shared Pool Statistics Begin End ------ ------ Memory Usage %: 81.53 85.39 % SQL with executions>1: 79.29 79.48 % Memory for SQL w/exec>1: 76.73 78.19
  • 41. Load Profile SectionInstance Efficiency Percentages (Target 100%)~~~~~~~~~~~~~~~~~~~~~~~~~~~~~~~~~~~~~~~~~~~~~ Buffer Nowait %: 100.00 Redo NoWait %: 99.97 Buffer Hit %: 96.09 In-memory Sort %: 100.00 Library Hit %: 98.17 Soft Parse %: 97.88 Execute to Parse %: 45.80 Latch Hit %: 99.95Parse CPU to ParseElapsd %: 0.00 % Non-Parse CPU: 99.77Shared Pool Statistics Begin End ------ ------ Memory Usage %: 81.53 85.39 % SQL with executions>1: 79.29 79.48 % Memory for SQL w/exec>1: 76.73 78.19
  • 42. Load Profile SectionInstance Efficiency Percentages (Target 100%)~~~~~~~~~~~~~~~~~~~~~~~~~~~~~~~~~~~~~~~~~~~~~ Buffer Nowait %: 100.00 Redo NoWait %: 99.97 Buffer Hit %: 96.09 In-memory Sort %: 100.00 Library Hit %: 98.17 Soft Parse %: 97.88 Execute to Parse %: 45.80 Latch Hit %: 99.95Parse CPU to ParseElapsd %: 0.00 % Non-Parse CPU: 99.77Shared Pool Statistics Begin End ------ ------ Memory Usage %: 81.53 85.39 % SQL with executions>1: 79.29 79.48 % Memory for SQL w/exec>1: 76.73 78.19
  • 43. Load Profile SectionInstance Efficiency Percentages (Target 100%)~~~~~~~~~~~~~~~~~~~~~~~~~~~~~~~~~~~~~~~~~~~~~ Buffer Nowait %: 100.00 Redo NoWait %: 99.97 Buffer Hit %: 96.09 In-memory Sort %: 100.00 Library Hit %: 98.17 Soft Parse %: 97.88 Execute to Parse %: 45.80 Latch Hit %: 99.95Parse CPU to ParseElapsd %: 0.00 % Non-Parse CPU: 99.77Shared Pool Statistics Begin End ------ ------ Memory Usage %: 81.53 85.39 % SQL with executions>1: 79.29 79.48 % Memory for SQL w/exec>1: 76.73 78.19
  • 44. Load Profile SectionInstance Efficiency Percentages (Target 100%)~~~~~~~~~~~~~~~~~~~~~~~~~~~~~~~~~~~~~~~~~~~~~ Buffer Nowait %: 100.00 Redo NoWait %: 99.97 Buffer Hit %: 96.09 In-memory Sort %: 100.00 Library Hit %: 98.17 Soft Parse %: 97.88 Execute to Parse %: 45.80 Latch Hit %: 99.95Parse CPU to ParseElapsd %: 0.00 % Non-Parse CPU: 99.77Shared Pool Statistics Begin End ------ ------ Memory Usage %: 81.53 85.39 % SQL with executions>1: 79.29 79.48 % Memory for SQL w/exec>1: 76.73 78.19
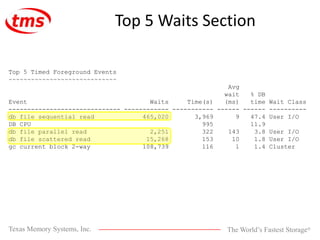
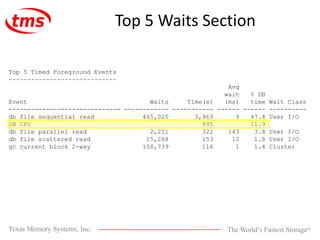
  • 45. Top 5 Waits SectionCritical to look closely at this sectionUse highest wait times to guide investigationDB FILE type waits – physical IOBUFFER type waits – Logical IOLOG type waits – Redo relatedPX – Parallel QueryGC – Global Cache (RAC related)Undo – Undo or rollback segment related
  • 46. Top 5 Waits SectionTop 5 Timed Foreground Events~~~~~~~~~~~~~~~~~~~~~~~~~~~~~Avg wait % DBEvent Waits Time(s) (ms) time Wait Class------------------------------ ------------ ----------- ------ ------ ----------db file sequential read 465,020 3,969 9 47.4 User I/ODB CPU 995 11.9db file parallel read 2,251 322 143 3.8 User I/Odb file scattered read 15,268 153 10 1.8 User I/Ogc current block 2-way 108,739 116 1 1.4 Cluster
  • 47. Top 5 Waits SectionTop 5 Timed Foreground Events~~~~~~~~~~~~~~~~~~~~~~~~~~~~~Avg wait % DBEvent Waits Time(s) (ms) time Wait Class------------------------------ ------------ ----------- ------ ------ ----------db file sequential read 465,020 3,969 9 47.4 User I/ODB CPU 995 11.9db file parallel read 2,251 322 143 3.8 User I/Odb file scattered read 15,268 153 10 1.8 User I/Ogc current block 2-way 108,739 116 1 1.4 Cluster
  • 48. Top 5 Waits SectionTop 5 Timed Foreground Events~~~~~~~~~~~~~~~~~~~~~~~~~~~~~Avg wait % DBEvent Waits Time(s) (ms) time Wait Class------------------------------ ------------ ----------- ------ ------ ----------db file sequential read 465,020 3,969 9 47.4 User I/ODB CPU 995 11.9db file parallel read 2,251 322 143 3.8 User I/Odb file scattered read 15,268 153 10 1.8 User I/Ogc current block 2-way 108,739 116 1 1.4 Cluster
  • 49. Top 5 Waits SectionTop 5 Timed Foreground Events~~~~~~~~~~~~~~~~~~~~~~~~~~~~~Avg wait % DBEvent Waits Time(s) (ms) time Wait Class------------------------------ ------------ ----------- ------ ------ ----------db file sequential read 465,020 3,969 9 47.4 User I/ODB CPU 995 11.9db file parallel read 2,251 322 143 3.8 User I/Odb file scattered read 15,268 153 10 1.8 User I/Ogc current block 2-way 108,739 116 1 1.4 Cluster
  • 50. Top 5 Waits SectionTop 5 Timed Foreground Events~~~~~~~~~~~~~~~~~~~~~~~~~~~~~Avg wait % DBEvent Waits Time(s) (ms) time Wait Class------------------------------ ------------ ----------- ------ ------ ----------db file sequential read 465,020 3,969 9 47.4 User I/ODB CPU 995 11.9db file parallel read 2,251 322 143 3.8 User I/Odb file scattered read 15,268 153 10 1.8 User I/Ogc current block 2-way 108,739 116 1 1.4 Cluster
  • 51. Top 5 Waits SectionTop 5 Timed Foreground Events~~~~~~~~~~~~~~~~~~~~~~~~~~~~~Avg wait % DBEvent Waits Time(s) (ms) time Wait Class------------------------------ ------------ ----------- ------ ------ ----------db file sequential read 465,020 3,969 9 47.4 User I/ODB CPU 995 11.9db file parallel read 2,251 322 143 3.8 User I/Odb file scattered read 15,268 153 10 1.8 User I/Ogc current block 2-way 108,739 116 1 1.4 Cluster
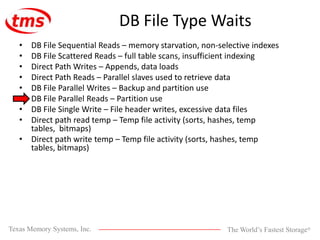
  • 52. DB File Type WaitsDB File Sequential Reads – memory starvation, non-selective indexesDB File Scattered Reads – full table scans, insufficient indexingDirect Path Writes – Appends, data loadsDirect Path Reads – Parallel slaves used to retrieve dataDB File Parallel Writes – Backup and partition useDB File Parallel Reads – Partition useDB File Single Write – File header writes, excessive data filesDirect path read temp – Temp file activity (sorts, hashes, temp tables, bitmaps)Direct path write temp – Temp file activity (sorts, hashes, temp tables, bitmaps)
  • 53. DB File Type WaitsDB File Sequential Reads – memory starvation, non-selective indexesDB File Scattered Reads – full table scans, insufficient indexingDirect Path Writes – Appends, data loadsDirect Path Reads – Parallel slaves used to retrieve dataDB File Parallel Writes – Backup and partition useDB File Parallel Reads – Partition useDB File Single Write – File header writes, excessive data filesDirect path read temp – Temp file activity (sorts, hashes, temp tables, bitmaps)Direct path write temp – Temp file activity (sorts, hashes, temp tables, bitmaps)
  • 54. DB File Type WaitsDB File Sequential Reads – memory starvation, non-selective indexesDB File Scattered Reads – full table scans, insufficient indexingDirect Path Writes – Appends, data loadsDirect Path Reads – Parallel slaves used to retrieve dataDB File Parallel Writes – Backup and partition useDB File Parallel Reads – Partition useDB File Single Write – File header writes, excessive data filesDirect path read temp – Temp file activity (sorts, hashes, temp tables, bitmaps)Direct path write temp – Temp file activity (sorts, hashes, temp tables, bitmaps)
  • 55. DB File Type WaitsDB File Sequential Reads – memory starvation, non-selective indexesDB File Scattered Reads – full table scans, insufficient indexingDirect Path Writes – Appends, data loadsDirect Path Reads – Parallel slaves used to retrieve dataDB File Parallel Writes – Backup and partition useDB File Parallel Reads – Partition useDB File Single Write – File header writes, excessive data filesDirect path read temp – Temp file activity (sorts, hashes, temp tables, bitmaps)Direct path write temp – Temp file activity (sorts, hashes, temp tables, bitmaps)
  • 56. DB File Type WaitsDB File Sequential Reads – memory starvation, non-selective indexesDB File Scattered Reads – full table scans, insufficient indexingDirect Path Writes – Appends, data loadsDirect Path Reads – Parallel slaves used to retrieve dataDB File Parallel Writes – Backup and partition useDB File Parallel Reads – Partition useDB File Single Write – File header writes, excessive data filesDirect path read temp – Temp file activity (sorts, hashes, temp tables, bitmaps)Direct path write temp – Temp file activity (sorts, hashes, temp tables, bitmaps)
  • 57. DB File Type WaitsDB File Sequential Reads – memory starvation, non-selective indexesDB File Scattered Reads – full table scans, insufficient indexingDirect Path Writes – Appends, data loadsDirect Path Reads – Parallel slaves used to retrieve dataDB File Parallel Writes – Backup and partition useDB File Parallel Reads – Partition useDB File Single Write – File header writes, excessive data filesDirect path read temp – Temp file activity (sorts, hashes, temp tables, bitmaps)Direct path write temp – Temp file activity (sorts, hashes, temp tables, bitmaps)
  • 58. DB File Type WaitsDB File Sequential Reads – memory starvation, non-selective indexesDB File Scattered Reads – full table scans, insufficient indexingDirect Path Writes – Appends, data loadsDirect Path Reads – Parallel slaves used to retrieve dataDB File Parallel Writes – Backup and partition useDB File Parallel Reads – Partition useDB File Single Write – File header writes, excessive data filesDirect path read temp – Temp file activity (sorts, hashes, temp tables, bitmaps)Direct path write temp – Temp file activity (sorts, hashes, temp tables, bitmaps)
  • 59. DB File Type WaitsDB File Sequential Reads – memory starvation, non-selective indexesDB File Scattered Reads – full table scans, insufficient indexingDirect Path Writes – Appends, data loadsDirect Path Reads – Parallel slaves used to retrieve dataDB File Parallel Writes – Backup and partition useDB File Parallel Reads – Partition useDB File Single Write – File header writes, excessive data filesDirect path read temp – Temp file activity (sorts, hashes, temp tables, bitmaps)Direct path write temp – Temp file activity (sorts, hashes, temp tables, bitmaps)
  • 60. Buffer Type Waitslatch: cache buffers chains – Hot blocks, check for hot objectsfree buffer waits – Insufficient buffers, processes holding buffers too long, IO subsystem over loadedbuffer busy waits – See what is causing them further along in reportgc buffer busy – Overloaded interconnect, find problem objects and tunelog buffer space – High load, too small a log buffer, increase log buffer sizelatch: cache buffers lru chain – Freelist issues, hot blockslatch: cache buffer handles – Freelist issues, hot blocksbuffer busy - See what is causing them further along in reportno free buffers – Insufficient buffers, dbwr contention
  • 61. Buffer Type Waitslatch: cache buffers chains – Hot blocks, check for hot objectsfree buffer waits – Insufficient buffers, processes holding buffers too long, IO subsystem over loadedbuffer busy waits – See what is causing them further along in reportgc buffer busy – Overloaded interconnect, find problem objects and tunelog buffer space – High load, too small a log buffer, increase log buffer sizelatch: cache buffers lru chain – Freelist issues, hot blockslatch: cache buffer handles – Freelist issues, hot blocksbuffer busy - See what is causing them further along in reportno free buffers – Insufficient buffers, dbwr contention
  • 62. Buffer Type Waitslatch: cache buffers chains – Hot blocks, check for hot objectsfree buffer waits – Insufficient buffers, processes holding buffers too long, IO subsystem over loadedbuffer busy waits – See what is causing them further along in reportgc buffer busy – Overloaded interconnect, find problem objects and tunelog buffer space – High load, too small a log buffer, increase log buffer sizelatch: cache buffers lru chain – Freelist issues, hot blockslatch: cache buffer handles – Freelist issues, hot blocksbuffer busy - See what is causing them further along in reportno free buffers – Insufficient buffers, dbwr contention
  • 63. Buffer Type Waitslatch: cache buffers chains – Hot blocks, check for hot objectsfree buffer waits – Insufficient buffers, processes holding buffers too long, IO subsystem over loadedbuffer busy waits – See what is causing them further along in reportgc buffer busy – Overloaded interconnect, find problem objects and tunelog buffer space – High load, too small a log buffer, increase log buffer sizelatch: cache buffers lru chain – Freelist issues, hot blockslatch: cache buffer handles – Freelist issues, hot blocksbuffer busy - See what is causing them further along in reportno free buffers – Insufficient buffers, dbwr contention
  • 64. Buffer Type Waitslatch: cache buffers chains – Hot blocks, check for hot objectsfree buffer waits – Insufficient buffers, processes holding buffers too long, IO subsystem over loadedbuffer busy waits – See what is causing them further along in reportgc buffer busy – Overloaded interconnect, find problem objects and tunelog buffer space – High load, too small a log buffer, increase log buffer sizelatch: cache buffers lru chain – Freelist issues, hot blockslatch: cache buffer handles – Freelist issues, hot blocksbuffer busy - See what is causing them further along in reportno free buffers – Insufficient buffers, dbwr contention
  • 65. Log Type Waitslog file parallel write – Look for log file contentionlog buffer space – Look at increasing log buffer sizelog file switch (checkpoint incomplete) – May indicate excessive db files or slow IO subsystemlog file switch (archiving needed) – Indicates archive files are written too slowlylog file switch completion – May need more log files per threadlog file sync – Could indicate excessive commits
  • 66. Log Type Waitslog file parallel write – Look for log file contentionlog buffer space – Look at increasing log buffer sizelog file switch (checkpoint incomplete) – May indicate excessive db files or slow IO subsystemlog file switch (archiving needed) – Indicates archive files are written too slowlylog file switch completion – May need more log files per threadlog file sync – Could indicate excessive commits
  • 67. Log Type Waitslog file parallel write – Look for log file contentionlog buffer space – Look at increasing log buffer sizelog file switch (checkpoint incomplete) – May indicate excessive db files or slow IO subsystemlog file switch (archiving needed) – Indicates archive files are written too slowlylog file switch completion – May need more log files per threadlog file sync – Could indicate excessive commits
  • 68. Log Type Waitslog file parallel write – Look for log file contentionlog buffer space – Look at increasing log buffer sizelog file switch (checkpoint incomplete) – May indicate excessive db files or slow IO subsystemlog file switch (archiving needed) – Indicates archive files are written too slowlylog file switch completion – May need more log files per threadlog file sync – Could indicate excessive commits
  • 69. PX Type WaitsPX Deq: Msg Fragment – PEM maybe too smallPX qref latch - Data is produced faster than it is consumed, look at PEMPX Deq Credit: send blkd – Look at PEM size and parallel query into non-parallel DML
  • 70. GC Eventsgccr multi block request – Full table or index scansgc current multi block request – Full table or index scansgccr block 2-way – Blocks are busy in another instance, check for block level contention or hot blocksgccr block 3-way – Blocks are busy in another instance, check for block level contention or hot blocksgccr block busy – Blocks are busy in another instance, check for block level contention or hot blocksgccr block congested – cr block congestion, check for hot blocks or busy interconnectgccr block lost – Indicates interconnect issues and contentiongc current block 2-way – Blocks are busy in another instance, check for block level contention or hot blocksgc current block 3-way – Blocks are busy in another instance, check for block level contention or hot blocksgc current block busy – Block is already involved in GC operation, shows hot blocks or congestiongc current block congested – current block congestion, check for hot blocks or busy interconnectgc current block lost - Indicates interconnect issues and contention
  • 71. GC Eventsgccr multi block request – Full table or index scansgc current multi block request – Full table or index scansgccr block 2-way – Blocks are busy in another instance, check for block level contention or hot blocksgccr block 3-way – Blocks are busy in another instance, check for block level contention or hot blocksgccr block busy – Blocks are busy in another instance, check for block level contention or hot blocksgccr block congested – cr block congestion, check for hot blocks or busy interconnectgccr block lost – Indicates interconnect issues and contentiongc current block 2-way – Blocks are busy in another instance, check for block level contention or hot blocksgc current block 3-way – Blocks are busy in another instance, check for block level contention or hot blocksgc current block busy – Block is already involved in GC operation, shows hot blocks or congestiongc current block congested – current block congestion, check for hot blocks or busy interconnectgc current block lost - Indicates interconnect issues and contention
  • 72. GC Eventsgccr multi block request – Full table or index scansgc current multi block request – Full table or index scansgccr block 2-way – Blocks are busy in another instance, check for block level contention or hot blocksgccr block 3-way – Blocks are busy in another instance, check for block level contention or hot blocksgccr block busy – Blocks are busy in another instance, check for block level contention or hot blocksgccr block congested – cr block congestion, check for hot blocks or busy interconnectgccr block lost – Indicates interconnect issues and contentiongc current block 2-way – Blocks are busy in another instance, check for block level contention or hot blocksgc current block 3-way – Blocks are busy in another instance, check for block level contention or hot blocksgc current block busy – Block is already involved in GC operation, shows hot blocks or congestiongc current block congested – current block congestion, check for hot blocks or busy interconnectgc current block lost - Indicates interconnect issues and contention
  • 73. Undo Eventsundo segment extension – If excessive, tune undolatch: In memory undo latch – If excessive could be bug, check for your version, may have to turn off in memory undowait for a undo record – Usually only during recovery of large transactions, look at turning off parallel undo recovery.
  • 74. Undo Eventsundo segment extension – If excessive, tune undolatch: In memory undo latch – If excessive could be bug, check for your version, may have to turn off in memory undowait for a undo record – Usually only during recovery of large transactions, look at turning off parallel undo recovery.
  • 75. Undo Eventsundo segment extension – If excessive, tune undolatch: In memory undo latch – If excessive could be bug, check for your version, may have to turn off in memory undowait for a undo record – Usually only during recovery of large transactions, look at turning off parallel undo recovery.
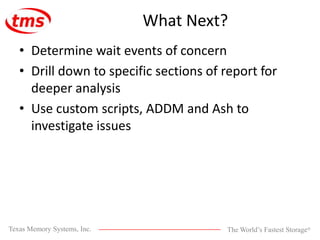
  • 76. What Next?Determine wait events of concernDrill down to specific sections of report for deeper analysisUse custom scripts, ADDM and Ash to investigate issues