
 Data Structure
 Networking
 RDBMS
RDBMS Operating System
 Java
Java MS Excel
 iOS
iOS HTML
HTML CSS
CSS Android
 Python
 C Programming
 C++
C++ C#
C# MongoDB
 MySQL
MySQL Javascript
 PHP
PHP
- Selected Reading
- UPSC IAS Exams Notes
- Developer's Best Practices
- Questions and Answers
- Effective Resume Writing
- HR Interview Questions
- Computer Glossary
- Who is Who
Add Labels in Bubble Chart in Excel
You can easily recognise a data series in a chart by adding data labels to the data points of the chart. This will help you to identify the data series more quickly. The data labels on the worksheet are connected to the values by default, and when these values are modified, the links between the labels and the values are immediately updated.
Let's understand step by step with an example.
Step 1
In our example, we have student's name, Marks in an excel sheet in columnar format. Refer to the below screenshot.

Step 2
Create the Bubble Chart ? Select the cells in the A2:C10 range. Then, click the Insert tab on the top ribbon and then click the Bubble Chart option in the Charts group.

Step 3
The following bubble chart will be generated automatically.

Step 4
Add Labels ? To add labels to the bubble chart, click anywhere on the chart and then click the "+" sign in the upper right corner.
Then click the arrow beside Data Labels, followed by More Options in the drop-down menu.

Step 5
In the panel that appears on the right side of the screen, check the box next to Value from Cells within the Label Options group
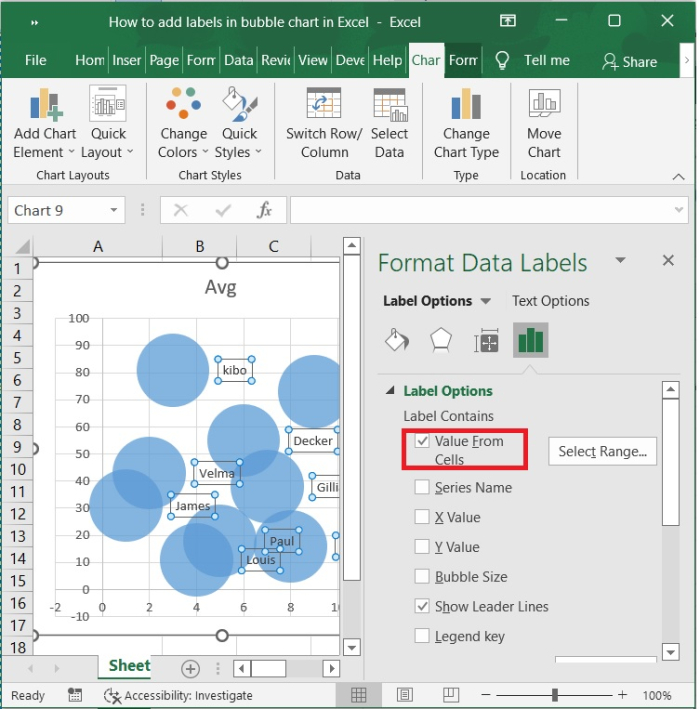
Step 6
In the new window that opens, select the range of cells from A2 to A10 that contains our labels

Step 7
On the right side of the screen, in the Format Data Labels panel, uncheck the box next to Y Value and choose Center as Label Position.

Step 8
The bubble chart will automatically add the following labels ?

Step 9
Customize the Bubble Chart ? Click a bubble and it will show a series options on the right. Now, select the "Vary Colors by Point" option.

Step 10
Now, we can see the bubble colors vary based on the names.

Conclusion
In this tutorial, we explained how you can add labels in a bubble chart in Excel and how to customize the bubble chart.

1K+ Views
