
 Data Structure
 Networking
 RDBMS
RDBMS Operating System
 Java
Java MS Excel
 iOS
iOS HTML
HTML CSS
CSS Android
 Python
 C Programming
 C++
C++ C#
C# MongoDB
 MySQL
MySQL Javascript
 PHP
PHP
- Selected Reading
- UPSC IAS Exams Notes
- Developer's Best Practices
- Questions and Answers
- Effective Resume Writing
- HR Interview Questions
- Computer Glossary
- Who is Who
Create Histogram for Uniform Data in R
To create a histogram for uniform data in R, we can simply use hist function but the bars size may vary even if the frequency is same. Therefore, for this purpose, we need to define the breaks as shown in the below example.
Example
To create a histogram for uniform data in R, use the code given below −
hist(1:6)
Output
If you execute the above given code, it generates the following output −

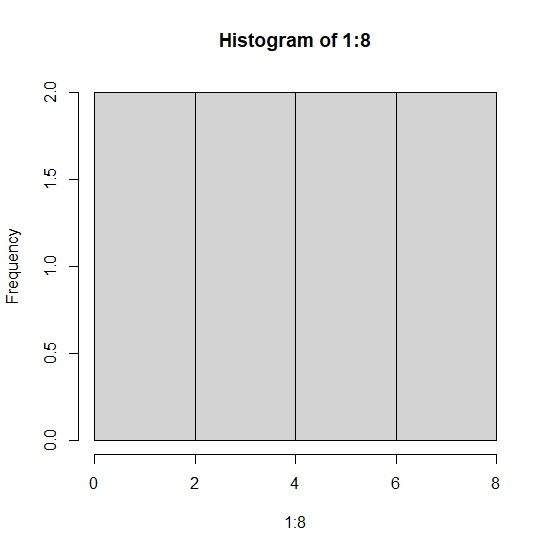
To create a histogram for uniform data in R, use the code given below −
hist(1:8)
Output
If you execute the above given code, it generates the following output −
To create a histogram for uniform data in R, use the code given below −
hist(1:6,breaks=0:6)
Output
If you execute the above given code, it generates the following output −


Updated on: 2021-11-09T07:08:51+05:30
313 Views

Advertisements