| perezju | 8f6b9c0 | 2017-01-09 17:17:24 | [diff] [blame] | 1 | # Memory Benchmarks |
| 2 | |
| 3 | This document describes benchmarks available to track Chrome's and |
| 4 | WebView's memory usage, where they live, what they measure, how to run them, |
| 5 | and on how to diagnose regressions. |
| 6 | |
| 7 | [TOC] |
| 8 | |
| 9 | ## Glossary |
| 10 | |
| 11 | * **User story:** a set of actions to perform on a browser or device (e.g. |
| 12 | open google homepage, type "foo", click search, scroll down, visit first |
| 13 | result, etc.). |
| 14 | * **Metric:** a data aggregation process that takes a Chrome trace as input |
| 15 | (produced by a [Telemetry][] run) and produces a set of summary numbers as |
| 16 | output (e.g. total GPU memory used). |
| 17 | * **Benchmark:** a combination of (one or more) user stories and (one or |
| 18 | more) metrics. |
| 19 | |
| 20 | [Telemetry]: https://github.com/catapult-project/catapult/blob/master/telemetry/README.md |
| 21 | |
| 22 | ## System Health |
| 23 | |
| 24 | *System health* is an effort to unify top-level benchmarks (as opposite to |
| 25 | micro-benchmarks and regression tests) that are suitable to capture |
| 26 | representative user stories. |
| 27 | |
| 28 | ### Benchmarks |
| 29 | |
| 30 | System health memory benchmarks are: |
| 31 | |
| 32 | * [system_health.memory_mobile][system_health] - |
| 33 | user stories running on Android devices. |
| 34 | * [system_health.memory_desktop][system_health] - |
| 35 | user stories running on desktop platforms. |
| 36 | |
| Juan Antonio Navarro Perez | 2097a1d | 2019-07-05 10:42:58 | [diff] [blame] | 37 | These benchmarks are run continuously on the [chrome.perf][] waterfall, |
| perezju | 8f6b9c0 | 2017-01-09 17:17:24 | [diff] [blame] | 38 | collecting and reporting results on the |
| 39 | [Chrome Performance Dashboard][chromeperf]. |
| 40 | |
| John Palmer | 046f987 | 2021-05-24 01:24:56 | [diff] [blame] | 41 | [system_health]: https://chromium.googlesource.com/chromium/src/+/main/tools/perf/page_sets/system_health/ |
| Juan Antonio Navarro Perez | 2097a1d | 2019-07-05 10:42:58 | [diff] [blame] | 42 | [chrome.perf]: https://ci.chromium.org/p/chrome/g/chrome.perf/console |
| perezju | 8f6b9c0 | 2017-01-09 17:17:24 | [diff] [blame] | 43 | [chromeperf]: https://chromeperf.appspot.com/report |
| 44 | |
| 45 | ### User stories |
| 46 | |
| 47 | System health user stories are classified by the kind of interactions they |
| 48 | perform with the browser: |
| 49 | |
| 50 | * `browse` stories navigate to a URL and interact with the page; e.g. |
| 51 | scroll, click on elements, navigate to subpages, navigate back. |
| 52 | * `load` stories just navigate to a URL and wait for the page to |
| 53 | load. |
| 54 | * `background` stories navigate to a URL, possibly interact with the |
| 55 | page, and then bring another app to the foreground (thus pushing the |
| 56 | browser to the background). |
| 57 | * `long_running` stories interact with a page for a longer period |
| 58 | of time (~5 mins). |
| Juan Antonio Navarro Perez | c3c2282f | 2019-12-05 10:43:00 | [diff] [blame] | 59 | * `multitab` loads different web sites in several tabs, then cycles through |
| 60 | them. |
| 61 | * `play` loads a web site and plays some media (e.g. a song). |
| perezju | 8f6b9c0 | 2017-01-09 17:17:24 | [diff] [blame] | 62 | |
| Juan Antonio Navarro Perez | c3c2282f | 2019-12-05 10:43:00 | [diff] [blame] | 63 | The full name of a story has the form `{interaction}:{category}:{site}[:{year}]` |
| 64 | where: |
| perezju | 8f6b9c0 | 2017-01-09 17:17:24 | [diff] [blame] | 65 | |
| 66 | * `interaction` is one the labels given above; |
| 67 | * `category` is used to group together sites with a similar purpose, |
| 68 | e.g. `news`, `social`, `tools`; |
| 69 | * `site` is a short name identifying the website in which the story mostly |
| 70 | takes place, e.g. `cnn`, `facebook`, `gmail`. |
| Juan Antonio Navarro Perez | c3c2282f | 2019-12-05 10:43:00 | [diff] [blame] | 71 | * `year` indicates the year in which the web page recording for the story |
| 72 | was most recently updated. |
| perezju | 8f6b9c0 | 2017-01-09 17:17:24 | [diff] [blame] | 73 | |
| Juan Antonio Navarro Perez | c3c2282f | 2019-12-05 10:43:00 | [diff] [blame] | 74 | For example `browse:news:cnn:2018` and `background:social:facebook` are two |
| 75 | system health user stories. The list of all current stories can be found at |
| 76 | [bit.ly/csh-stories](http://bit.ly/csh-stories). |
| perezju | 8f6b9c0 | 2017-01-09 17:17:24 | [diff] [blame] | 77 | |
| Juan Antonio Navarro Perez | c3c2282f | 2019-12-05 10:43:00 | [diff] [blame] | 78 | Today, for most stories, a garbage collection is forced at the end of the |
| perezju | 8f6b9c0 | 2017-01-09 17:17:24 | [diff] [blame] | 79 | story and a memory dump is then triggered. Metrics report the values |
| 80 | obtained from this single measurement. |
| 81 | |
| 82 | ## Continuous monitoring |
| 83 | |
| 84 | 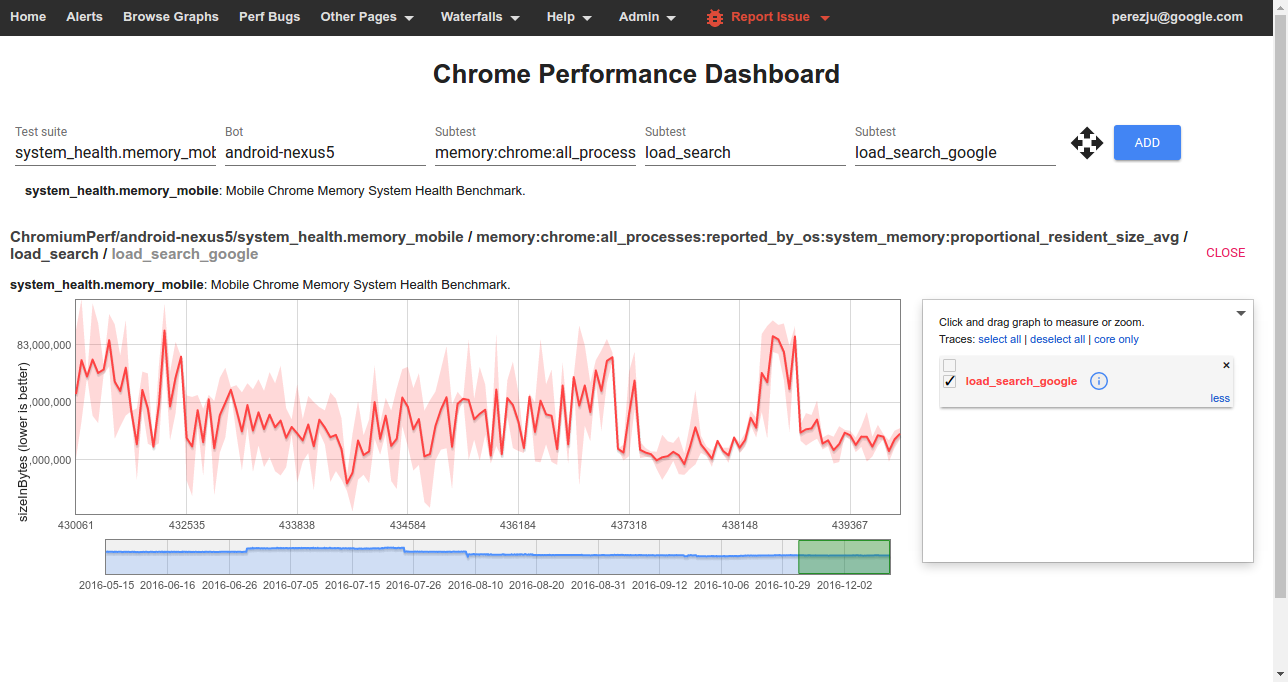 |
| 85 | |
| 86 | To view data from one of the benchmarks on the |
| 87 | [Chrome Performance Dashboard][chromeperf] you should select: |
| 88 | |
| 89 | * **Test suite:** The name of a *[benchmark](#Benchmarks)*. |
| 90 | * **Bot:** The name of a *platform or device configuration*. Sign in to also |
| 91 | see internal bots. |
| 92 | * **Subtest (1):** The name of a *[metric](#Understanding-memory-metrics)*. |
| 93 | * **Subtest (2):** The name of a *story group*; these have the form |
| 94 | `{interaction}_{category}` for system health stories. |
| 95 | * **Subtest (3):** The name of a *[user story](#User-stories)* |
| 96 | (with `:` replaced by `_`). |
| 97 | |
| Juan Antonio Navarro Perez | c3c2282f | 2019-12-05 10:43:00 | [diff] [blame] | 98 | Clicking on any point of the graph will give you the commit range, links to the |
| 99 | builder that ran the benchmark, and a trace file collected during the story |
| 100 | run. See below for details on how to interpret these traces when |
| 101 | [debugging memory related issues](#debugging-memory-regressions). |
| sullivan | a65c32f | 2017-07-06 17:39:04 | [diff] [blame] | 102 | |
| Juan Antonio Navarro Perez | c3c2282f | 2019-12-05 10:43:00 | [diff] [blame] | 103 | Many of the high level memory measurements are automatically tracked and the |
| 104 | Performance Dashboard will generate alerts when a memory regression is detected. |
| 105 | These are triaged by [perf sheriffs][] who create bugs and start bisect jobs |
| 106 | to find the root cause of regressions. |
| 107 | |
| 108 | [perf sheriffs]: /docs/speed/perf_regression_sheriffing.md |
| xunjieli | 0c0ed3be | 2017-06-23 14:08:35 | [diff] [blame] | 109 | |
| 110 | 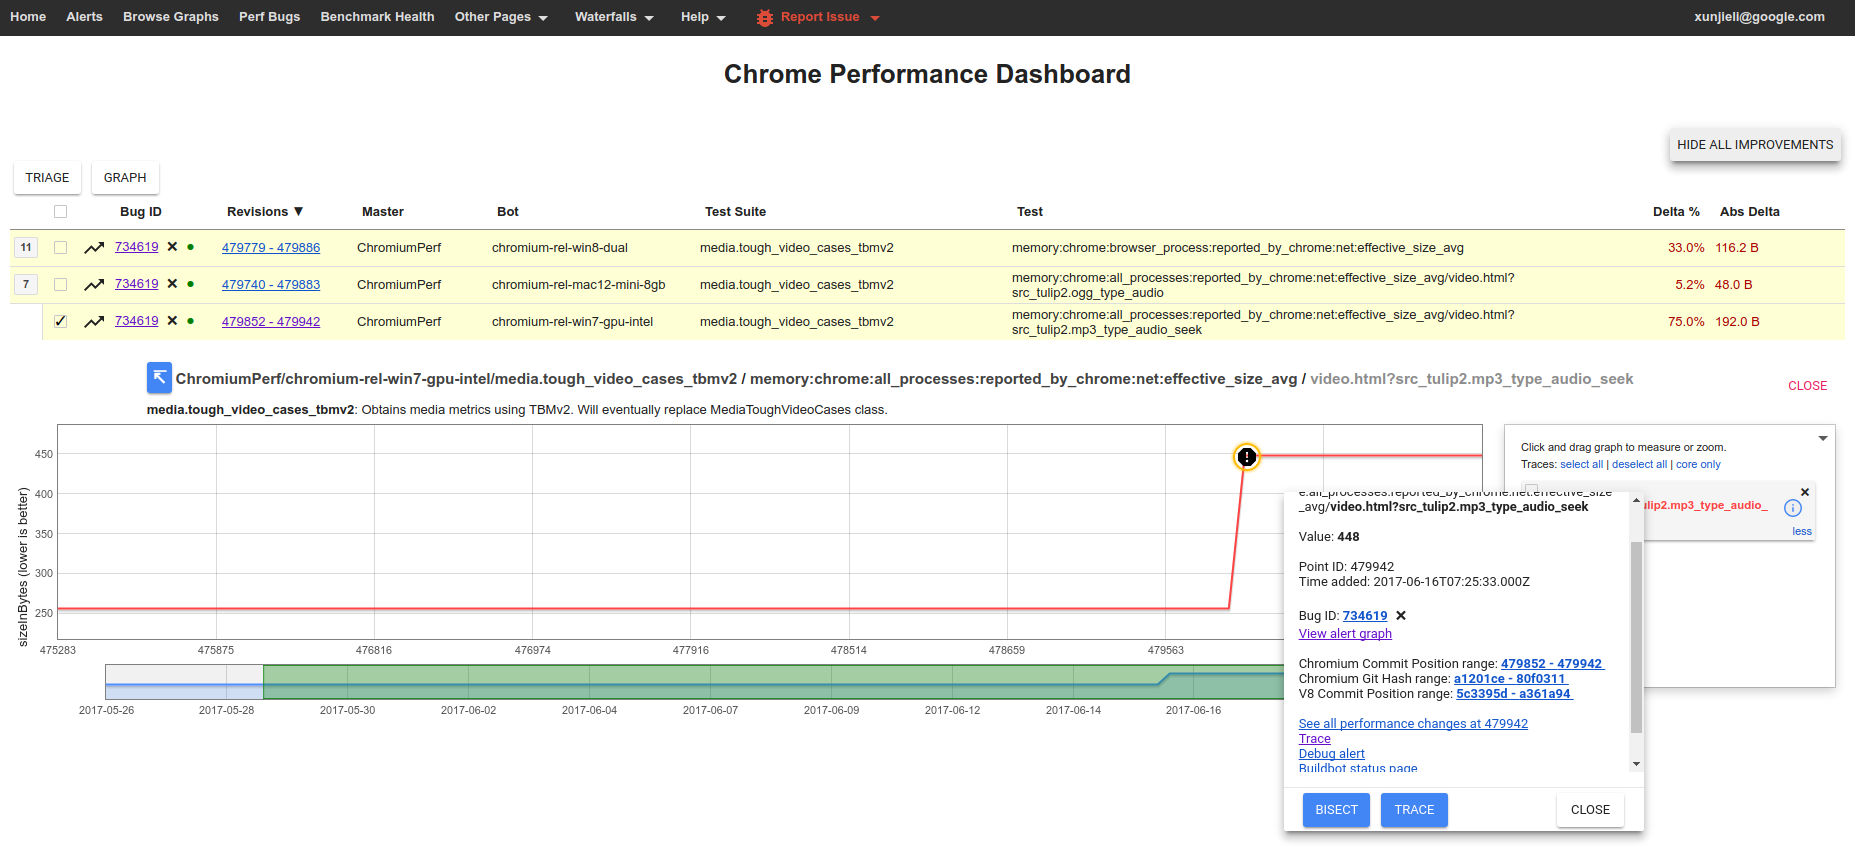 |
| 111 | |
| Juan Antonio Navarro Perez | c3c2282f | 2019-12-05 10:43:00 | [diff] [blame] | 112 | ## Debugging memory regressions |
| 113 | |
| 114 | If you are investigating a memory regression, chances are, a [pinpoint][] |
| 115 | job identified one of your CLs as a possible culprit. |
| 116 | |
| 117 | 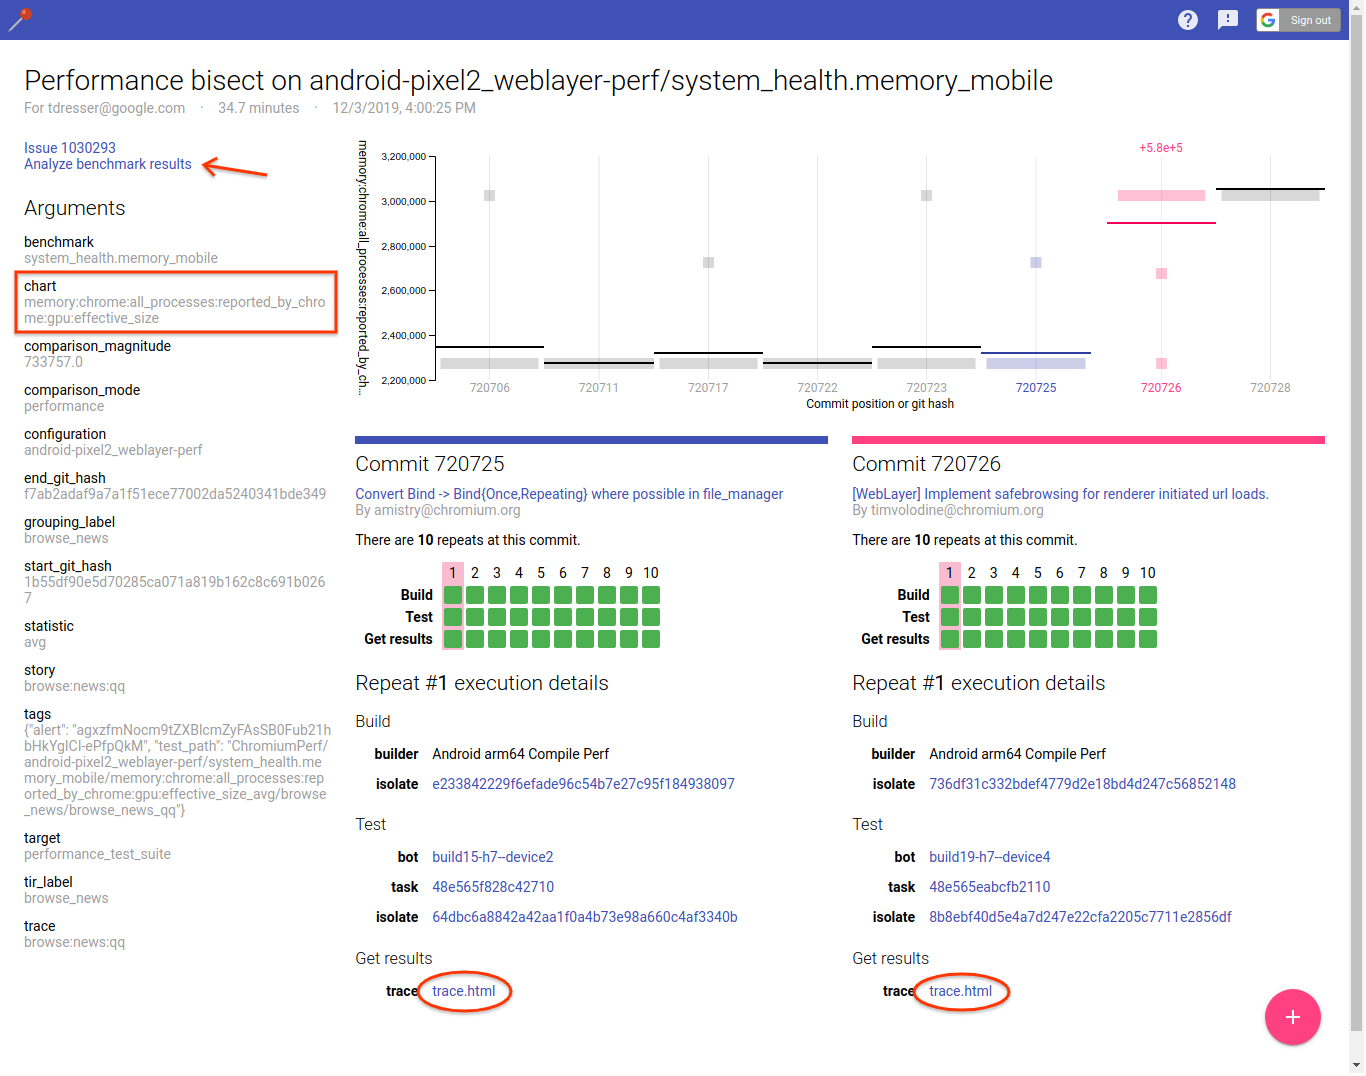 |
| 118 | |
| 119 | Note the "chart" argument identifies the memory metric that regressed. The |
| 120 | pinpoint results page also gives you easy access to traces before and after |
| 121 | your commit landed. It's useful to look at both and compare them to identify what |
| 122 | changed. The documentation on [memory-infra][memory-infra] explains how to dig |
| 123 | down into details and interpret memory measurements. Also note that pinpoint |
| 124 | runs each commit multiple times, so you can access more traces by clicking on |
| 125 | a different "repeat" of either commit. |
| 126 | |
| 127 | Sometimes it's also useful to follow the link to "Analyze benchmark results" |
| 128 | which will bring up the [Metrics Results UI][results-ui] to compare all |
| 129 | measurements (not just the one caught by the alert) before and after your |
| 130 | CL landed. Make sure to select the "before" commit as reference column, show |
| 131 | absolute changes (i.e. "Δavg") instead of relative, and sort by the column |
| 132 | with changes on the "after" commit to visualize them more easily. This can be |
| 133 | useful to find a more specific source of the regression, e.g. |
| 134 | `renderer_processes:reported_by_chrome:v8:heap:code_space:effective_size` |
| 135 | rather than just `all_processes:reported_by_chrome:effective_size`, and help |
| 136 | you pin down the source of the regression. |
| 137 | |
| 138 | To confirm whether a revert of your CL would fix the regression you can run |
| 139 | a [pinpoint try job](#How-to-run-a-pinpoint-try-job) with a patch containing |
| 140 | the revert. Finally, **do not close the bug** even if you suspect that your CL |
| 141 | may not be the cause of the regression; instead follow the more general |
| 142 | guidance on how to [address performance regressions][addressing-regressions]. |
| 143 | Bugs should only be closed if the regression has been fixed or justified. |
| 144 | |
| 145 | [results-ui]: https://chromium.googlesource.com/catapult.git/+/HEAD/docs/metrics-results-ui.md |
| 146 | [memory-infra]: /docs/memory-infra/README.md |
| 147 | [addressing-regressions]: /docs/speed/addressing_performance_regressions.md |
| 148 | |
| perezju | 8f6b9c0 | 2017-01-09 17:17:24 | [diff] [blame] | 149 | ## How to run the benchmarks |
| 150 | |
| Juan Antonio Navarro Perez | 9e50ddde | 2018-12-18 10:22:49 | [diff] [blame] | 151 | Benchmarks may be run on a local platform/device or remotely on a pinpoint |
| 152 | try job. |
| 153 | |
| 154 | ### How to run a pinpoint try job |
| 155 | |
| 156 | Given a patch already uploaded to code review, try jobs provide a convenient |
| 157 | way to evaluate its memory implications on devices or platforms which |
| 158 | may not be immediately available to developers. |
| 159 | |
| 160 | 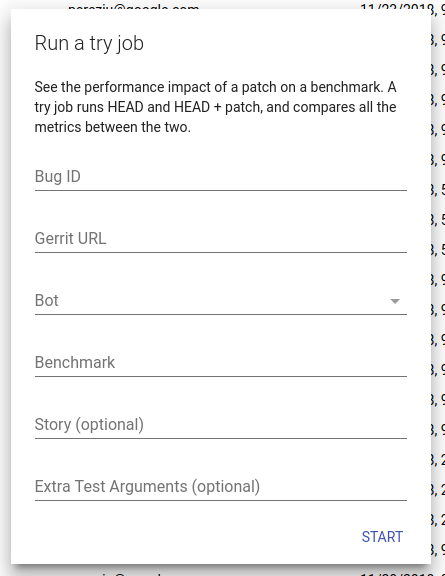 |
| 161 | |
| 162 | To start a try job go to the [pinpoint][] website, click on the `+` button to |
| 163 | create a new job, and fill in the required details: |
| 164 | |
| 165 | [pinpoint]: https://pinpoint-dot-chromeperf.appspot.com/ |
| 166 | |
| 167 | * **Bug ID** (optional): The id of a crbug.com issue where pinpoint can post |
| 168 | updates when the job finishes. |
| 169 | * **Gerrit URL**: URL to the patch you want to test. Note that your patch can |
| 170 | live in chromium or any of its sub-repositories! |
| 171 | * **Bot**: Select a suitable device/platform from the drop-down menu on which |
| 172 | to run your job. |
| 173 | * **Benchmark**: The name of the benchmark to run. If you are interested in |
| 174 | memory try `system_health.memory_mobile` or `system_health.memory_desktop` |
| 175 | as appropriate. |
| Egor Pasko | d11dd40 | 2020-01-08 15:37:12 | [diff] [blame] | 176 | * **Story** (optional): A pattern (Python regular expression) passed to |
| 177 | Telemetry's `--story-filter` option to only run stories that match the |
| 178 | pattern. |
| Juan Antonio Navarro Perez | 9e50ddde | 2018-12-18 10:22:49 | [diff] [blame] | 179 | * **Extra Test Arguments** (optional): Additional command line arguments for |
| 180 | Telemetry's `run_benchmark`. Of note, if you are interested in running a |
| 181 | small but representative sample of system health stories you can pass |
| 182 | `--story-tag-filter health_check`. |
| 183 | |
| 184 | If you have more specific needs, or need to automate the creation of jobs, you |
| 185 | can also consider using [pinpoint_cli][]. |
| 186 | |
| Juan Antonio Navarro Perez | 2097a1d | 2019-07-05 10:42:58 | [diff] [blame] | 187 | [pinpoint_cli]: https://cs.chromium.org/chromium/src/tools/perf/pinpoint_cli |
| perezju | 8f6b9c0 | 2017-01-09 17:17:24 | [diff] [blame] | 188 | |
| 189 | ### How to run locally |
| 190 | |
| 191 | After building, e.g. `ChromePublic.apk`, you can run a specific system health |
| 192 | story with the command: |
| 193 | |
| 194 | ``` |
| 195 | $SRC/tools/perf/run_benchmark run system_health.memory_mobile \ |
| 196 | --browser android-chromium --story-filter load:search:google |
| 197 | ``` |
| 198 | |
| 199 | This will run the story with a default of 3 repetitions and produce a |
| 200 | `results.html` file comparing results from this and any previous benchmark |
| Juan A. Navarro Perez | ee12a2a | 2017-10-02 16:20:18 | [diff] [blame] | 201 | runs. In addition, you'll also get individual [trace files][memory-infra] |
| Juan Antonio Navarro Perez | 33b0d14 | 2018-01-19 14:54:35 | [diff] [blame] | 202 | for each story run by the benchmark. **Note:** by default only high level |
| 203 | metrics are shown, you may need to tick the "Show all" check box in order to |
| 204 | view some of the lower level memory metrics. |
| perezju | 8f6b9c0 | 2017-01-09 17:17:24 | [diff] [blame] | 205 | |
| 206 |  |
| 207 | |
| 208 | Other useful options for this command are: |
| 209 | |
| 210 | * `--pageset-repeat [n]` - override the default number of repetitions |
| perezju | 8f6b9c0 | 2017-01-09 17:17:24 | [diff] [blame] | 211 | * `--reset-results` - clear results from any previous benchmark runs in the |
| 212 | `results.html` file. |
| 213 | * `--results-label [label]` - give meaningful names to your benchmark runs, |
| 214 | this way it is easier to compare them. |
| 215 | |
| 216 | For WebView make sure to [replace the system WebView][webview_install] |
| 217 | on your device and use `--browser android-webview`. |
| 218 | |
| sullivan | a65c32f | 2017-07-06 17:39:04 | [diff] [blame] | 219 | [memory-infra]: /docs/memory-infra/README.md |
| perezju | 8f6b9c0 | 2017-01-09 17:17:24 | [diff] [blame] | 220 | [webview_install]: https://www.chromium.org/developers/how-tos/build-instructions-android-webview |
| 221 | |
| perezju | 8f6b9c0 | 2017-01-09 17:17:24 | [diff] [blame] | 222 | ## Understanding memory metrics |
| 223 | |
| 224 | There is a large number of [memory-infra][] metrics, breaking down usage |
| 225 | attributed to different components and processes. |
| 226 | |
| 227 |  |
| 228 | |
| 229 | Most memory metrics have the form |
| 230 | `memory:{browser}:{processes}:{source}:{component}:{kind}` |
| 231 | where: |
| 232 | |
| 233 | * **browser:** One of `chrome` or `webview`. |
| 234 | * **processess:** One of `browser_process`, `renderer_processess`, |
| 235 | `gpu_process`, or `all_processess`. |
| 236 | * **source:** One of `reported_by_chrome` or `reported_by_os` |
| 237 | * **component:** May be a Chrome component, e.g. `skia` or `sqlite`; |
| 238 | details about a specific component, e.g. `v8:heap`; or a class of memory |
| xunjieli | 0c0ed3be | 2017-06-23 14:08:35 | [diff] [blame] | 239 | as seen by the OS, e.g. `system_memory:native_heap` or `gpu_memory`. If |
| 240 | reported by chrome, the metrics are gathered by `MemoryDumpProvider`s, |
| 241 | probes placed in the specific components' codebase. For example, in |
| 242 | "memory:chrome:all_processes:reported_by_chrome:net:effective_size_avg," |
| 243 | the component is "net" which is Chrome's network stack and |
| 244 | "reported_by_chrome" means that this metric is gathered via probes in |
| 245 | the network stack. |
| perezju | 8f6b9c0 | 2017-01-09 17:17:24 | [diff] [blame] | 246 | * **kind:** The kind of memory being reported. For metrics reported by |
| 247 | Chrome this usually is `effective_size` (others are `locked_size` |
| 248 | and `allocated_objects_size`); for metrics by the OS this usually is |
| 249 | `proportional_resident_size` (others are `peak_resident_size` and |
| 250 | `private_dirty_size`). |
| 251 | |
| Juan Antonio Navarro Perez | c3c2282f | 2019-12-05 10:43:00 | [diff] [blame] | 252 | Read the [memory-infra documentation][memory-infra] for more details on them. |
| 253 | |
| sullivan | a65c32f | 2017-07-06 17:39:04 | [diff] [blame] | 254 | [memory-infra]: /docs/memory-infra/README.md |